
Abstract
Some wood-destroying fungi are increasingly present in Québec, Canada, and this reported increase seems to coincide with climate change. Serpula lacrymans is a brown rot fungus that is one of the most destructive fungi reported across the province. This paper documents and simulates the spread of biodegradation in wood-framed buildings and, more specifically, investigates this spread considering the impact of S. lacrymans contamination of wood components on the hygrothermal performance of wall assemblies. The work presented is two-pronged. First, we assess physical and mechanical properties of pine and spruce wood degraded by S. lacrymans. Density, porosity, water vapor permeability, water vapor sorption, capillary water absorption, water content at capillary saturation and effective saturation have been measured to provide comparative insight for healthy and contaminated wood. Degraded samples showed an increase in their water vapor resistance factor and water content at capillary saturation as well as a general decrease in values of sorption isotherms and capillary water absorption coefficients. Effective saturation values were higher for degraded spruce samples and lower for degraded pine samples. The mechanical properties tested showed that, even if the measured mass loss is negligible, loss of mechanical strength can be considerable. Second, we assess how the presence of damaged wood affects the hygrothermal performance of different envelope assemblies for seven climatic sub-regions in Québec. The degradation criterion is based on the duration of exposure to humidity and temperature levels conducive to the fungal growth. S. lacrymans has a particular ability compared to other decay fungi in that it can move water source toward sought nutrients. Hence, fungal presence and distribution in the envelope assemblies is modeled with two means: modified water transport properties obtained from laboratory measurements on contaminated wood and addition of water flux in wood components to simulate hyphae-borne moisture transfer in the assemblies.
Keywords
Introduction
Serpula lacrymans is a fungus which degrades the cellulose in wood, leading to dry rot (DesRochers et al., 2017; Jennings and Bravery, 1991). S. lacrymans intolerance to sudden changes in temperature, light or wind explains that the fungus is mostly found inside buildings, rather than in nature (VanderGoot, 2017). Wood degrading agents, S. lacrymans being one of them, that historically did not survive in the climate of Québec, Canada, now seem able to establish themselves (Institut national de santé publique du Québec, n.d.). Government agencies have reported a lack of technical knowledge to manage the problem (Québec (Province), Comité interministériel sur la mérule pleureuse, and Société d’habitation du Québec, 2018). Available statistics on recorded cases of S. lacrymans in Québec document the increase. According to the Canadian Forest Service, 18 cases were reported in Québec between 1947 and 1995 (Ressources naturelles Canada, n.d). Although it is not mandatory in Québec to report cases of S. lacrymans, 243 cases have been reported in the province since 2014 (Mérule Québec, n.d.a). The discovery of a building contaminated by S. lacrymans requires the owners to take action promptly as once established this fungus can attain the rapid growth of 0.3 cm per day (Maurice et al., 2011). Measures against this serious situation involve either decontamination or demolition, both costly. Particularly troublesome is the coincidence of such colonization following energy retrofit interventions. Over the last decades, to limit energy losses, many buildings with crawl spaces have had their foundations and subfloors insulated from the inside. This insulation technique could increase certain damage risks, including rotting of wood behind insulation. Increasing knowledge of the risks associated with wood-framed building colonization by S. lacrymans in Québec under different environmental contexts, is crucial to better preventing colonization and reacting in the event of its occurrence.
Although previous work has looked at the interactions of wood degraded by decay fungi with water over the years, the conclusions drawn stem from a limited array of fungi and wood species (Chauhan and Nagaveni, 2009; Lee et al., 2004; Papadopoulos, 2012; Zabel and Morrell, 2020). There is therefore a need to deepen this knowledge specifically for S. lacrymans in terms of the cause and impact of its presence on further spreading, toward limiting the financial and technical impact on owners. To do so, a campaign was put in place to collect wood specimens in contaminated buildings, deemed to be in presence of S. lacrymans, across Québec (Roy et al., 2023). Specimens of sound and S. lacrymans-colonized wood were characterized to provide insight on the behavior of wood framed assemblies exposed to different indoor and outdoor environments.
This paper presents a characterization of site-collected sound and colonized wood and uses the observed properties to evaluate their impact on hygrothermal performance of wood-framed systems. We present the methods and the results of the physical and mechanical characterization of the wood samples. The colonized wood samples data is then compared to sound wood data. The discussion focuses on the main differences observed in two wood species for the three different colonization levels. To gain a better understanding of the impact of the deterioration caused by the growth of S. lacrymans on wood-framed building assemblies in Québec, hygrothermal simulations are used to document the temperature, relative humidity, and moisture content of wood elements in different insulation configurations, climates, and levels of fungal degradation. A simulation approach to ascertain the impact of colonized wood within assemblies is developed and presented using own-developed moisture year of seven cities. The results are presented and discussed with an analysis highlighting the impacts of the different simulation parameters, within this study limitations. Finally, the conclusion summarizes the work done and presents some avenues that could be explored to further the knowledge of this type of colonization.
Methodology
Characterization of damaged wood
Specimens of colonized wood, collected directly from affected homes spread over the Québec territory, were experimentally characterized. The wood species studied were white pine (Pinus strobus) and spruce (Picea, species unidentified), the most common species used in residential construction in Québec (ACQC, n.d.). The research team was unable to identify the specific species of spruce and, for the purpose of this project, sapwood and heartwood have not been treated separately. For sample collection, potential buildings were preidentified via two avenues, through decontamination companies that had obtained their customers’ agreement, and through Mérule Québec, a non-profit support organization for home owners faced with such situations (Mérule Québec, n.d.b). Building owners were contacted and agreed to the specimen collection. The specimens had to meet two criteria: they had to be large enough to produce the cut samples required by the different tests, and they had to include three levels of degradation, that is, a sound-looking part, a part partially covered by the fungus and a part completely covered. After consideration, we retained seven houses for site visit and collection of wood specimens for the project. At each site, the occupants were interviewed to determine the timeline of events, photos documented the collection site and measurements were done. For specimen collection, per standard BNQ 3009-610/2021 (Bureau de normalisation du Québec, 2021) the protective protocol involved a full suit, gloves, mask, and goggles. To transport the specimens to the laboratory, a double bagging protocol was followed. Prior to characterization, specimens were oven dried at 80°C for at least two weeks. Samples were collected at the different periods of the year, in winter spring and summer, thus under different environmental conditions and on buildings with different conditions leading to the presence S. lacrymans. The in-situ moisture content was not seen as indicative. Thus, the samples were not weighed before the initial drying. Visits took place between June 2022 and April 2023. A total of 14 specimens were collected and 12 of these were retained for full characterization as the advanced degradation level of the two specimens from Gaspésie-Îles-de-la-Madeleine prevented adequate samples for characterization to be produced because of their advanced stage of degradation and the impossibility of mechanically processing them without destroying the specimens. The fungus had been previously identified by fungal colonization analysis laboratories. Seven specimens came from inhabitable basements, three from an insulated crawl space and two from uninsulated crawl spaces. Most spaces had a finish concrete layer but some had dirt floor. Table 1 presents photos of the samples used for the physical characterization.
Specimens used for the project with dimensions, provenance (administrative region) and date of site visit.
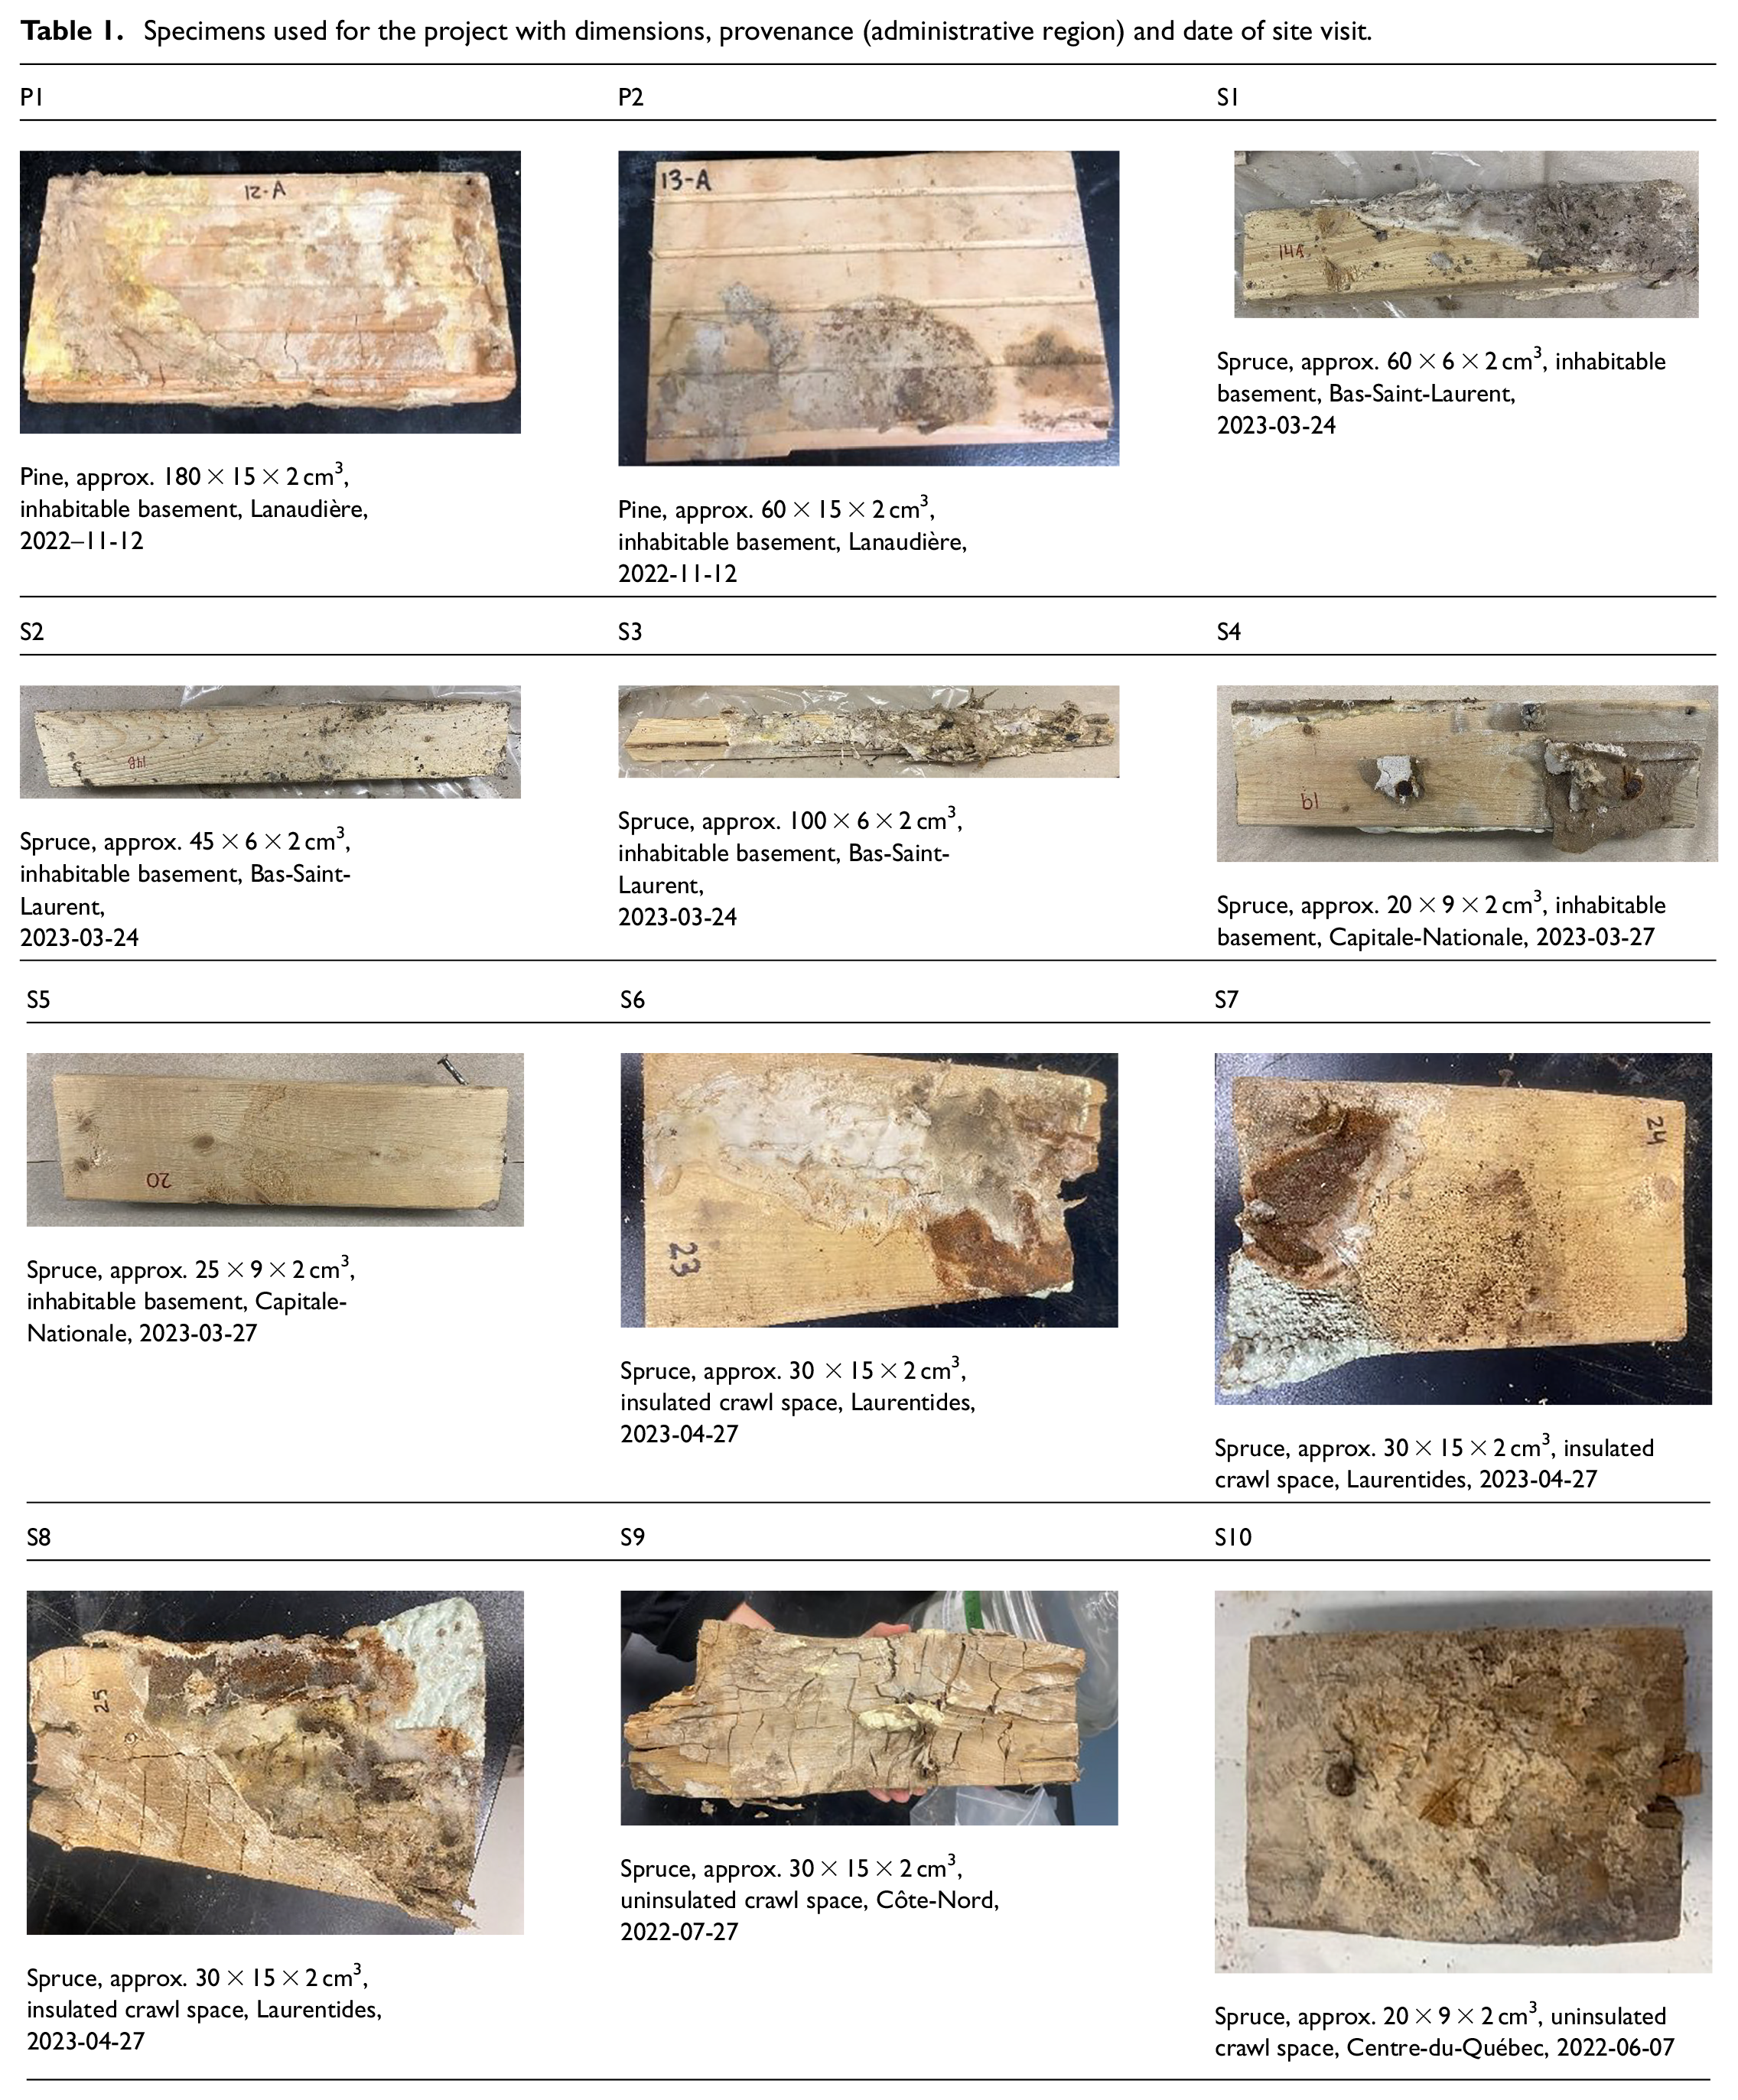
Measurements on the samples included density, porosity, water vapor permeability, water vapor sorption, capillary water absorption, and water content at capillary saturation. These properties provide the basis upon which the fungus-colonized wood material properties used in hygrothermal simulations are formulated. As many studies have shown that mechanical properties, such as the modulus of elasticity (MOE) and the modulus of rupture (MOR), can be significantly affected by rot (ACQC, n.d.; Roy et al., 2023), mechanical tests were also performed. Most physical properties have been characterized on dry wood under isothermal conditions in a laboratory with conditions maintained around 23°C and 20%–25% relative humidity (RH), unless mentioned otherwise.
Density
The bulk density (ρ in [kg/m3]) of the samples was determined by the ratio of their dry mass to their dry volume prior to tests on samples of measurable dimensions (uncertainty of weighing = ±0.01 g).
Porosity
Porosity (
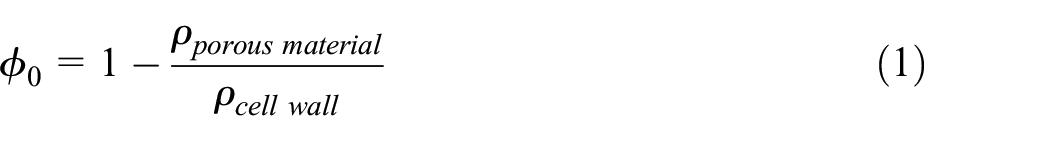
Permeability
The water vapor permeability of the samples was measured using permeability cells (wet cup/dry cup), here aluminum container of 50 mm radius, with water to obtain near 100% RH in the cell. The cell was covered with a wood disc-shaped sample of 8 mm thickness. The perimeter of the sample was sealed with bee wax to ensure unidirectional moisture flow. The cells were installed in a desiccator cabinet with a relative humidity of 19.3% RH for a period of 7 weeks until equilibrium was reached. Figure 1(a) shows a permeability cell. The change in mass of the cell over time gives a flux for a permeable material considering its area and thickness as installed in the cell. The permeability (
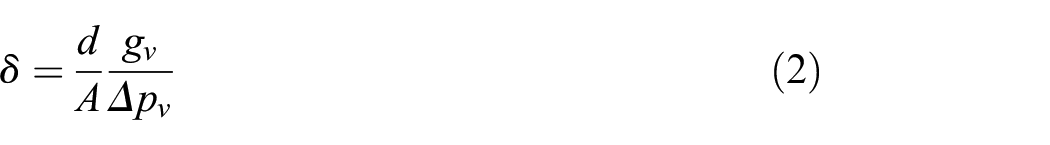
where,
d = wood specimen thickness (m)
A = exposed area (m2)
Δpv = vapor pressure difference (Pa)
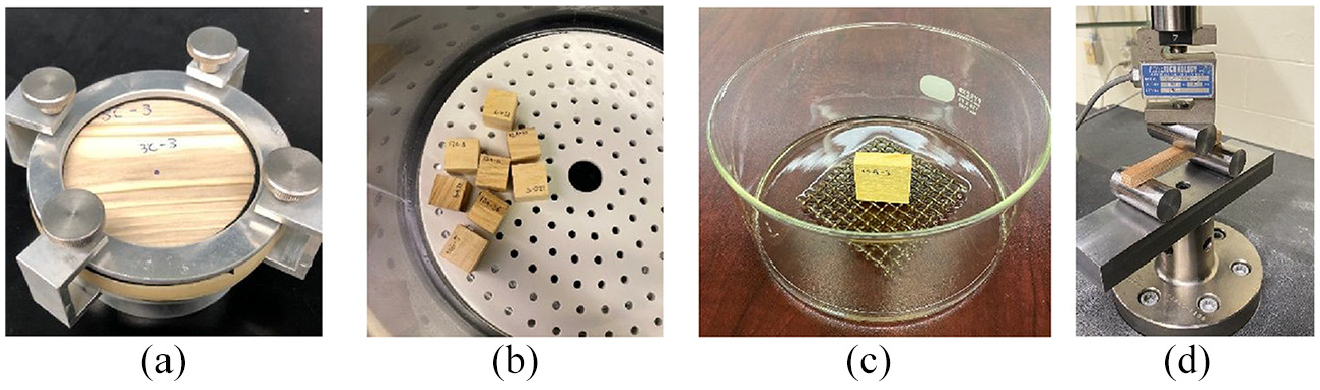
(a) Permeability cell with wood sample, (b) lithium chloride solution in desiccator, (c) set-up for imbibition test, and (d) set-up for three-point bending test.
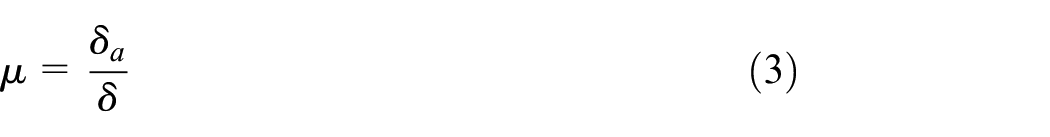
The water vapor resistance factor (μ) is obtained by the ratio of the water vapor coefficient in dry air δa of approximately 1.87 × 10⁻¹⁰ s at 20°C and material vapor permeability δ as follows:
Water vapor sorption isotherms
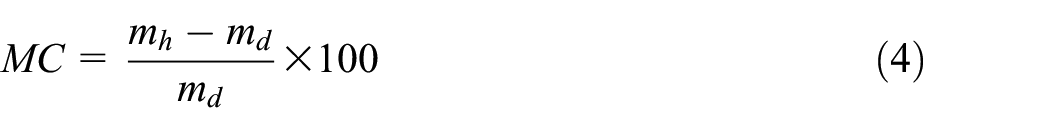
Water vapor sorption isotherms were acquired using a series of seven desiccators, with water, desiccant, or saline solutions to control relative humidity toward obtaining the sample mass at equilibrium with environments of varying relative humidities (C16 Committee, 2021). Equilibrium of the samples mass took on average 7 weeks to reach (uncertainty of weighing = ±0.01 g). These environments and their RH were as following: lithium chloride (12% RH), magnesium chloride (33% RH), magnesium nitrate (54% RH), sodium nitrate (65% RH), sodium chloride (75% RH), potassium chloride (85% RH) and water (tending to 100% RH). The relative humidity for the water desiccator approached 100%, but did not reach this value. Figure 1(b) a desiccator used to condition samples at the desired relative humidity. Samples were 20 × 20 × 20 mm3. Water content (MC) of samples, expressed as kgwater/kgdry wood %, is calculated with the following equation:
where,
mh = moist sample mass (kg)
md = oven dried sample mass (kg)
Capillary water absorption, water content at capillary saturation and effective saturation
Capillary water uptake coefficient (Acap in [kg/(m2.s0.5)]) was measured by imbibition where a wood sample was put in contact with liquid water and the mass increase over a determined period of time monitored (ASTM International, n.d.). Uptake in three grain directions was tested for most samples. Samples were 30 × 30 × 10 mm3. Water content at capillary saturation (wcap in [m3/m3]) was determined, from the liquid uptake results plotted in function of square root of time, as the point of intersection of the first slope of uptake and the final slope. Effective saturation (wsat in [m3/m3]) was measured as the maximum mass value reached at the end of the experiment, which is chosen long enough to effectively approach water saturation. Figure 1(c) shows an example of an imbibition test set-up.
Mechanical properties
With the aim of documenting damage as a complement to physical characterization, mechanical strength tests were performed to obtain comparative data on the structural capacity of the wood specimens at different levels of colonization. Three-point bending tests were conducted on a series of colonized and sound samples to determine modulus of elasticity (MOE) and modulus of rupture (MOR) values (in [MPa]). The samples were conditioned to 12% MC to represent the upper bound of indoor service conditions. Due to the constraints imposed by the geometry of the original samples, mechanical tests were carried out on longitudinal samples. Samples were 100 mm long (longitudinal direction), 8 mm thick and wide (radial and tangential directions). The level of degradation of cut samples is not necessarily the same as the overall level of colonization of the specimen. The span between lower supports was 80 mm. The loading support was fixed, and the diameter of the roller bearings was 25.4 mm. The tests were conducted at a rate of 2 mm/min using an Instron 4482 apparatus. Figure 1(d) shows the set-up for three-point bending tests.
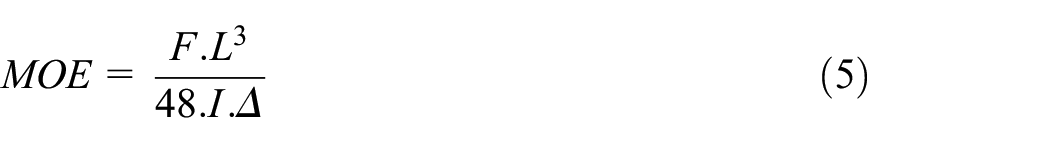
MOE values are determined by the following equation (D07 Committee, n.d.):
where,
F = applied load (N)
L = span between two supports (m)
I = sample moment of inertia (m4)
Δ = deflection at sample center (m)
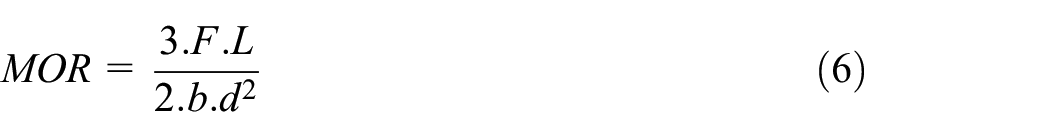
MOR values are determined by the following equation (D07 Committee, n.d.):
where,
F = applied load at fracture point (N)
L = span between two supports (m)
b = sample width (m)
d = sample thickness (m)
Parametric hygrothermal evaluations of assemblies with colonized wood
The assembly modeling consisted of an exterior wall and interior floor resting on a concrete foundation. Two scenarios of loading conditions, presented in detail below, were retained for the simulations. Scenario 1 aimed to simulate the wall assembly under typical climates and indoor crawl space conditions with fluctuating temperature while relative humidity is maintained at 80% RH, in line with relative humidity measurements in contaminated houses. Scenario 2 had the same exterior climate, but two variations: crawl space temperature and relative humidity fluctuating with exterior conditions, and the addition of a constant water leak between the header joist and the sill plate resting on the concrete foundation. It should be noted that, in this second scenario, liquid water infiltration is continuous and hypothetically unaffected by frost. In addition to the basic configuration a, a second configuration b accounts for indoor sprayed-applied thermal insulation in the crawl space.
Simulation setup
Hygrothermal simulations were conducted with the software Delphin 6.1.6 (Bauklimatik-Dresden, n.d.). The initial conditions for temperature and RH for all materials were respectively set to 20°C and 80%. Anisotropic transport modeling was activated to allow the use of longitudinal and transverse properties. Simulations were performed with the same weather file applied five consecutive times.
Outdoor climates
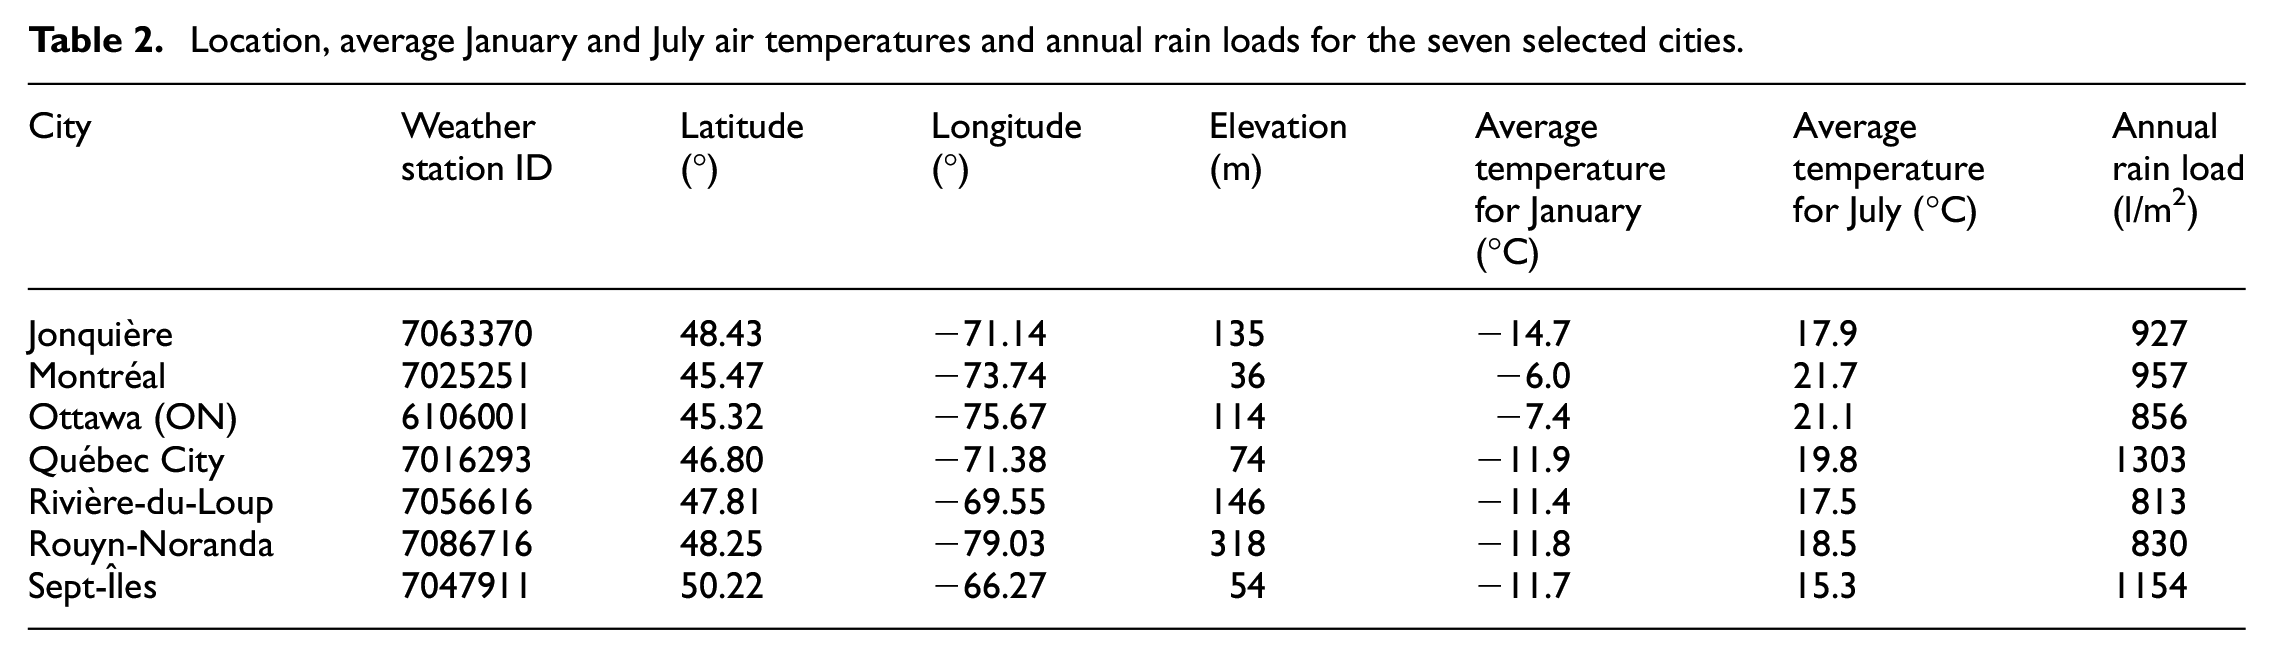
Seven cities were selected across Québec as representative climatic subregions. Also, these cities had 30 years of climate data available from airport weather stations (Index, n.d.), actually measured between 1991 and 2020. City locations and indicative climatic characteristics are shown in Table 2. Typical meteorological year weather files were constructed using a data-driven approach (Bigtashi et al., 2024). The methodology uses feature importance to define the generation parameters used in the Sandia National Laboratories method (Hall et al., 1979; Marion and Urban, 1995) to generate typical meteorological year weather files. To adequately adapt the methodology for different applications, the training input dataset must include the weather parameters used by the selected simulation software. As a result, rain precipitation was added to the list of features used to train the machine learning regression model. Furthermore, to tailor the weather files to the given study, the overall header joist temperature simulated for five years was used as the training output dataset. The selected weather parameters (temperature (°C), relative humidity (%), direct radiation normal (W/m2), diffuse radiation horizontal (W/m2), wind direction (deg), wind velocity (m/s), longwave counter radiation (W/m2), air pressure (Pa), rain (l/m2h)) and the resulting weighting factors obtained from the model using feature importance were incorporated into the Sandia method to construct the weather files. More detailed information on the methodology is found in (Sexton et al., 1993).
Location, average January and July air temperatures and annual rain loads for the seven selected cities.
Indoor and crawl space conditions
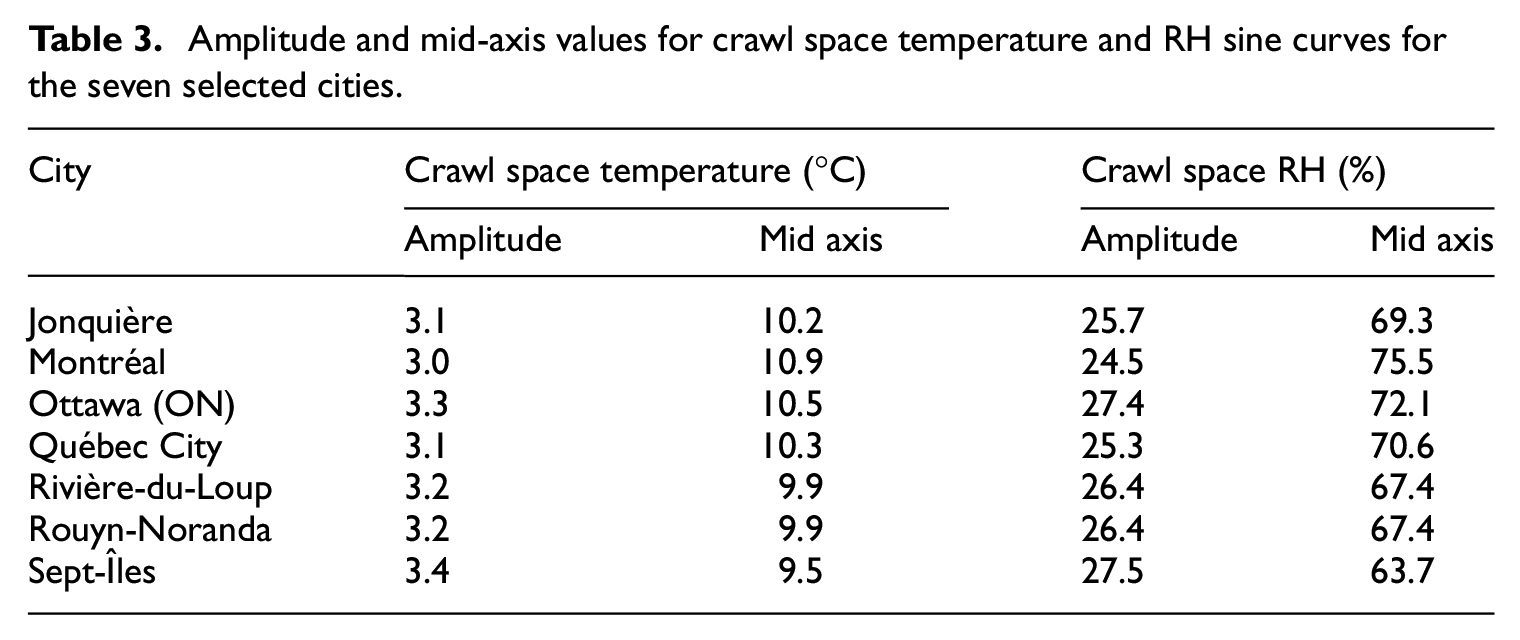
Scenario 1 needed indoor temperature and Scenario 2 needed indoor temperature and RH to be calculated for each city according to the tables provided by ASHRAE 160 (ASHRAE Standing Standard Project Committee 160, 2021). Indoor temperature was calculated using the 24h running average with heating only. Hourly RH values were calculated based on the simplified method provided by ASHRAE 160. Using the outdoor weather files from the seven cities processed for this study, a sine function was plotted to define the indoor conditions of the crawl spaces (Laukkarinen and Vinha, 2017; Vanhoutteghem et al., 2017). The functions consider the annual average outdoor temperature, the temperature amplitude of a year and the time of the year. Table 3 presents the amplitude and mid-axis values for the sine curves defining the crawl space conditions.
Amplitude and mid-axis values for crawl space temperature and RH sine curves for the seven selected cities.
Base wall assembly configuration
As wood decay by water-conducting fungi typically is frequently observed to begin in crawl spaces and basements in houses (Verrall, 1968), a wood-framed wall assembly typical of residential building practices in the province of Québec for the 1950–1980 period is selected for this study.
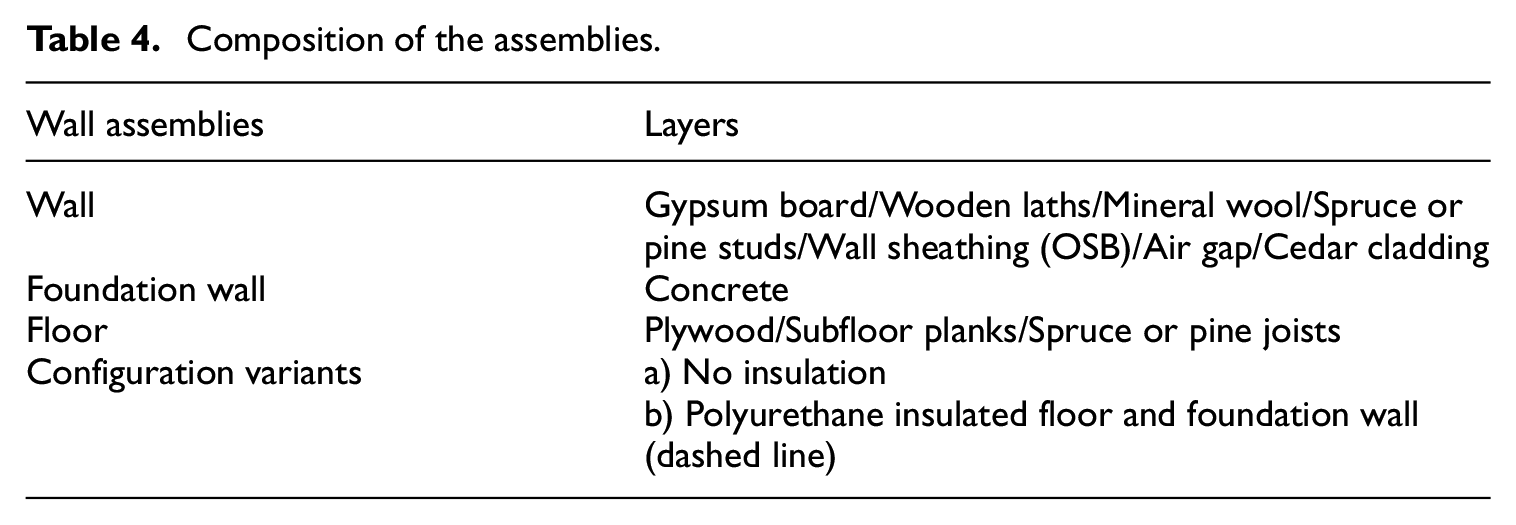
Figure 2(a) shows an uninsulated condition that was surprisingly common in the visited building. The computational domain followed this configuration with façade orientation to North. As mentioned above, two insulation configurations were simulated for the crawl space: no insulation (configuration a) and a layer of 32 mm of polyurethane foam covering the foundation wall and the sub floor area (configuration b). It is assumed that the cedar siding is untreated and unpainted, and that the wall sheathing, here oriented strand board (OSB), acts as a vapor barrier. As no bitumen sheet were observed between the concrete foundation and wooden sill plate in the buildings part of this study, none were included in the models. Table 4 presents the composition of the wall assembly. With two scenarios and two configurations, we obtain four loading conditions: scenarios 1a, 1b, 2a, and 2b.
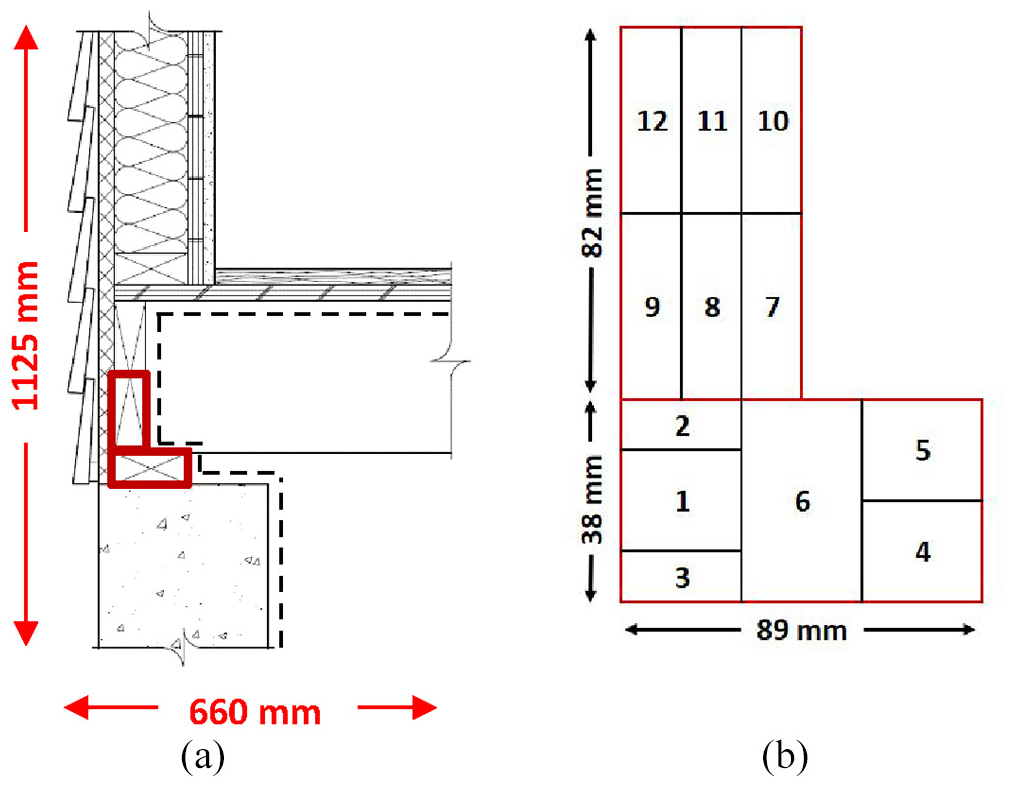
(a) Schematic representation of wall assembly, highlighting the zones of interest and (b) subdivision of header joist and wall plate into 6 zones each.
Composition of the assemblies.
The exterior portion of the wall and concrete foundation was exposed to wind driven rain in the simulations. No ground contact was considered and the conditions at the bottom of the concrete foundation were considered adiabatic.
Development of the simulation protocol
The aim of this project was to analyze the influence of changes in wood properties due to decay by S. lacrymans on the results of hygrothermal simulations. However, such degradation, that is, loss of mass, was calculated as a post-processing step in Delphin. Hence, a Scenario was applied here as a series of simulations, implementing step changes in material properties as per mass loss. The simulation scenarios detailed above were first simulated with sound wood properties, to target areas of decay over time (Phase 1). In a second simulation phase, at the appropriate moment, the calculation in progress was interrupted and the properties of the degraded wood, as characterized in laboratory, were integrated into the model. To do so, corresponding material files were created within Delphin (see Table 9). It was then possible to continue the simulation with the modified properties to observe their impact on temperature, relative humidity, and moisture content in targeted wood components (Phase 2). In a third simulation phase that reused this approach, water paths were added throughout the degradation process to simulate water transport in S. lacrymans hyphae (Phase 3), with water source added to the colonized parts following the changes in properties. The water flux is set to be a constant 3.89 × 10⁻⁸ kg/m3s (Thompson et al., 1985).
To better follow the hygrothermal performance within the assembly junction, the header joist and the sill plate are divided into 12 zones of interest (Figure 2).
To simulate the hygrothermal behavior of wood, material property datasets used in hygrothermal simulation have a completeness and range of measurement that is beyond the characterization performed with our limited number of specimens. Hence, to ensure the robustness of the property dataset applied in the simulations, material property datasets available in Delphin were selected and adjusted according to our findings on sound wood. The properties of sound pine (Ps) come from materials 714 Pine_longitudinal (from Saxony) and 715 Pine radial (from Saxony) and the sound properties of sound spruce (Ss) come from 711 Spruce longitudinal (from Saxony) and 712 Spruce_radial (from Saxony), as listed in the Delphin database (Bauklimatik-Dresden, n.d.). These materials are chosen because, among the essences with properties in two directions from the same laboratory, they are the ones that most closely resemble density-wise the specimens collected in this study.
Mass loss and mold index
The mass loss and mold index discussed in this article is calculated in post-processing from Viitanen et al. rot degradation model (Hukka and Viitanen, 1999; Viitanen et al., 2010). The mass loss model is based on laboratory experiments on pine sapwood using two decay fungi, the Coniophora puteana and the Gloeophyllum sepiarium, which are basidiomycetes and lignivorous like S. lacrymans. The mold growth model is also based on laboratory experiments using pine and spruce sapwood. Since the methodology of the project is parametric and thus aims to be comparative in nature, it is assumed that the results obtained with the VTT models in post-processing are adequate to document such parametric study.
Results and discussion
Characterization of colonized wood
Hygrothermal properties
The results in Table 5 summarize the physical properties of the characterized wood samples. As several samples from the same specimen could be produced with dimensions appropriate for a specific test, the number of specimens is given. For tests with more than 6 samples, the standard deviation is included. The specimens are classified by level of colonization, where C1 means no or few signs of colonization, C2 is used for specimens showing moderate signs of colonization, and C3 means a high level of colonization. C3 includes fully fungus covered and friable specimens.
Physical properties of pine and spruce of 3 colonization levels.
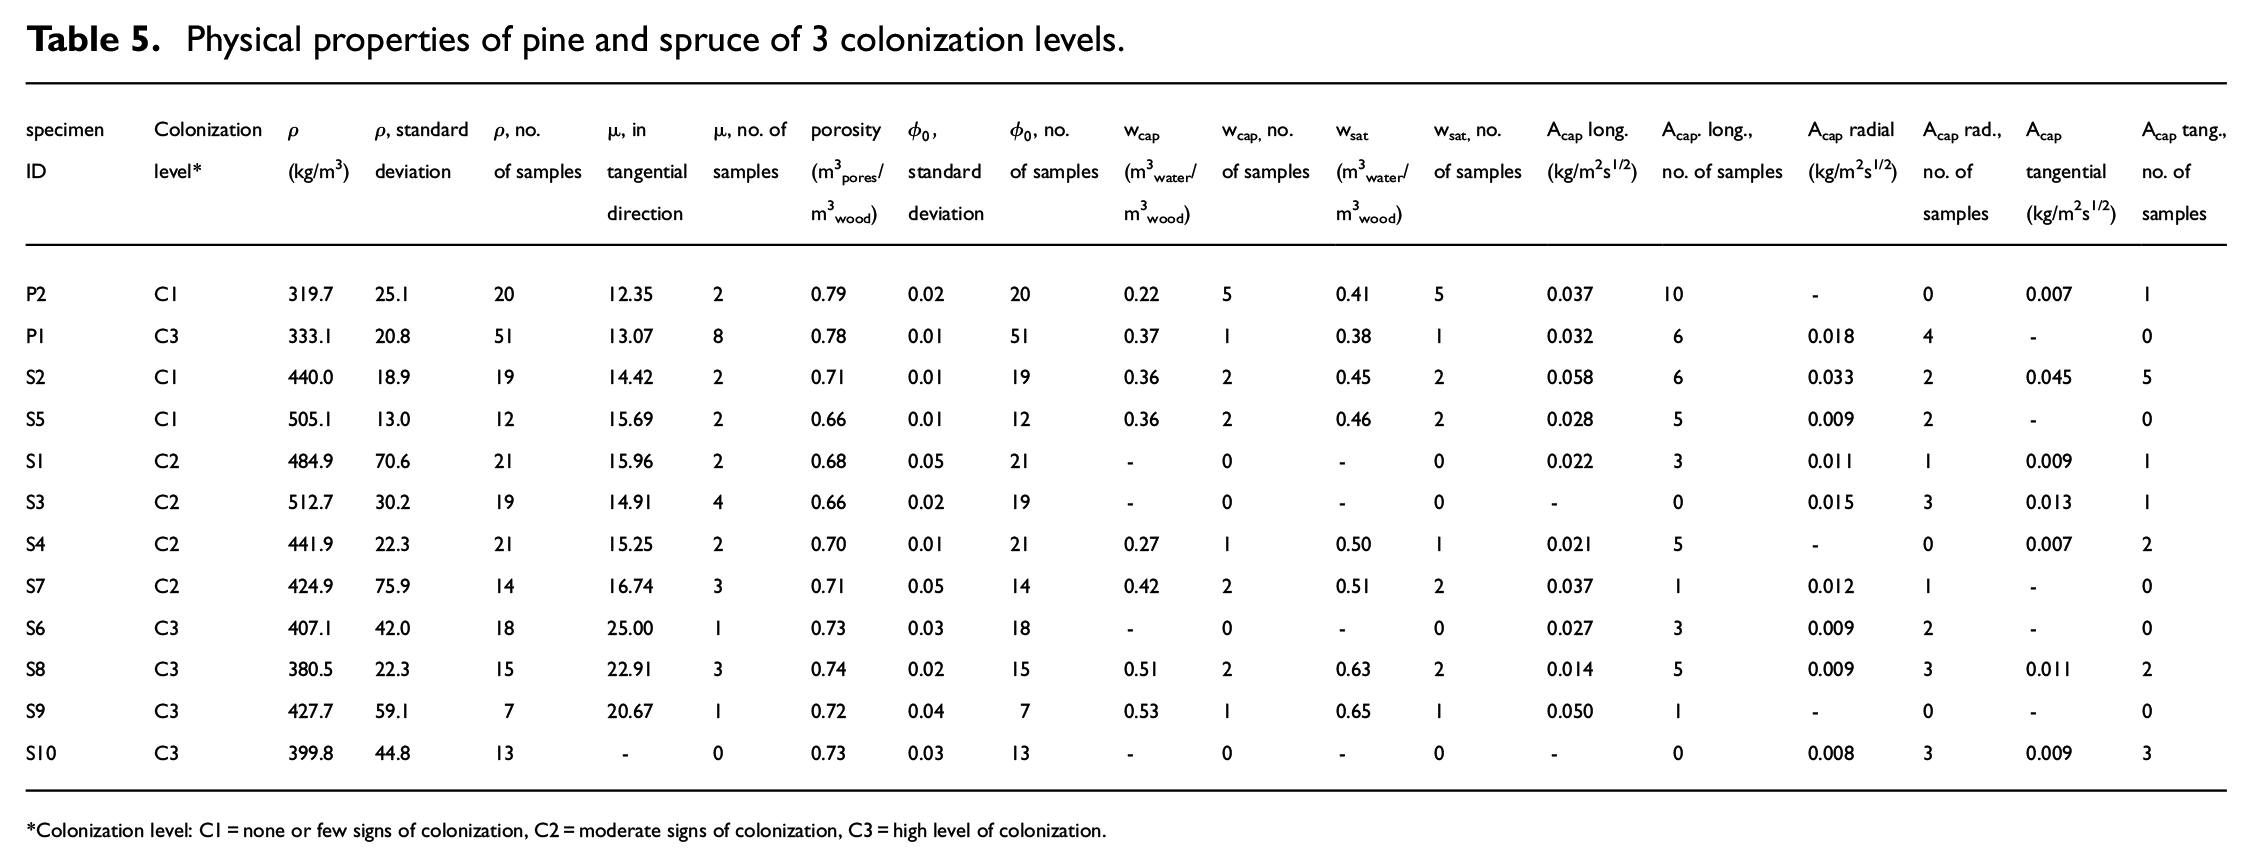
Colonization level: C1 = none or few signs of colonization, C2 = moderate signs of colonization, C3 = high level of colonization.
Looking at pine results, the colonized P1 shows slightly higher density that the sound pine, even when taken into account standard deviation. The measured water vapor resistance factor is higher for colonized pine samples (P1) than for sound samples (P2). While Acap and wsat values are higher for the sound samples, wcap values are lower for sound samples. The pine sorption isotherms as samples of both levels of colonization follow a similar tendency (Figure 3). From this set of data, it is not possible to draw strong conclusions on the impact of the fungi presence of the properties of pine.
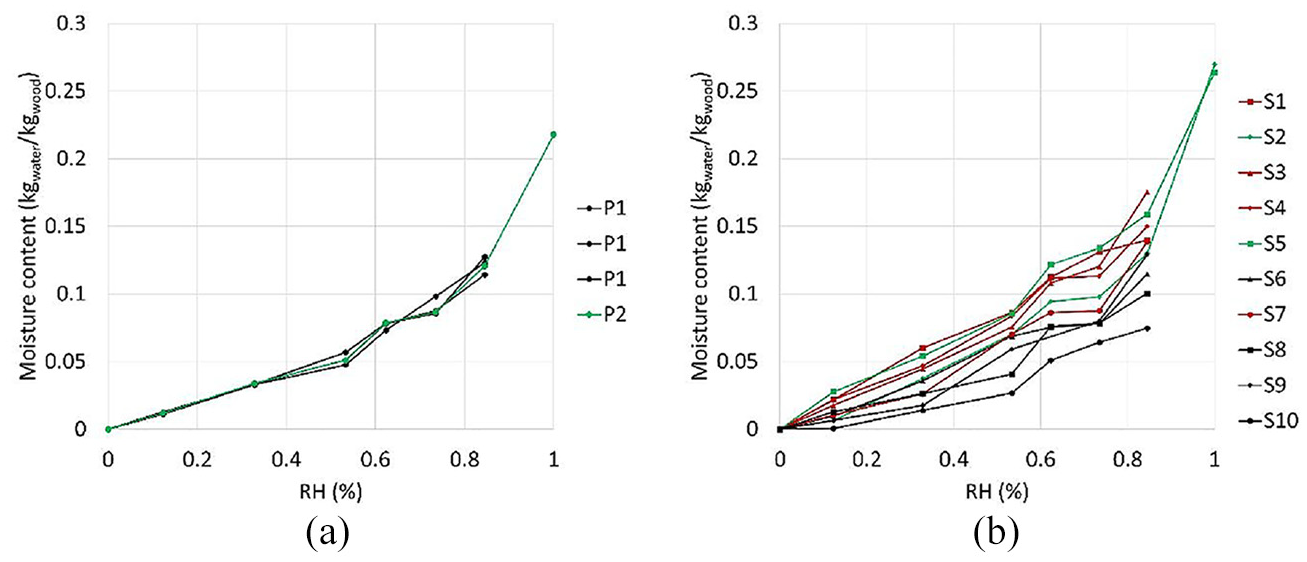
(a) Pine and (b) spruce sorption isotherms, with levels of colonization C1 in green, C2 in red, and C3 in black.
The most visually degraded spruce samples are the ones with the highest water vapor resistance factor (S6, S8, S9) and the highest theoretical porosity (S6-S10). The wsat values are higher for degraded samples unlike for pine. As with pine, wcap values are lower for sound samples. Acap values, for their part, are on average higher for sound samples. Regarding moisture sorption, the most visually degraded samples are those with the lowest sorption isotherms (S6-S10).
The decay by S. lacrymans incurs significant changes in the chemical composition of wood. In the early stages of wood degradation, when the hyphae penetrate the cell walls, the cell walls are depolymerized. The number of sorption sites, that is, free hydroxyl groups -OH, then increases. However, as degradation increases the number of sorption sites decreases (Brischke et al., 2019; Cowling, 1961; Thybring, 2017). The majority of free -OH groups found in wood cell walls are found on hemicellulose and amorphous cellulose (Siau, 1995). Since S. lacrymans degrades the cellulose in the wood, it is normal to observe a reduction in sorption capacity of highly degraded samples. The irregularity found at a RH of 65% could be explained by the fact that the team had a hard time keeping the sodium nitrate solution saturated. This decay process causes the cell walls to shrink, forming cracks (Schwarze, 2004). Brown rot fungi, such as S. lacrymans, degrade wood in that way where wood pores become larger the more wood is degraded (Flournoy et al., 1991). A bigger pore radius implies a lower capillary pressure. This could partly explain an Acap value that is lower for decayed wood. The further degradation progresses, the more mycelium is found in the wood cells, as seen by computer tomography. This in turn increases resistance to the passage of water vapor in colonized materials. As this new material transforms the pore network, capillary saturation is seen to increase in colonized wood.
Mechanical properties
For mechanical testing, samples cut from specimens were categorized according to the specimen’s overall level of colonization. The level of colonization of each specimen may vary.
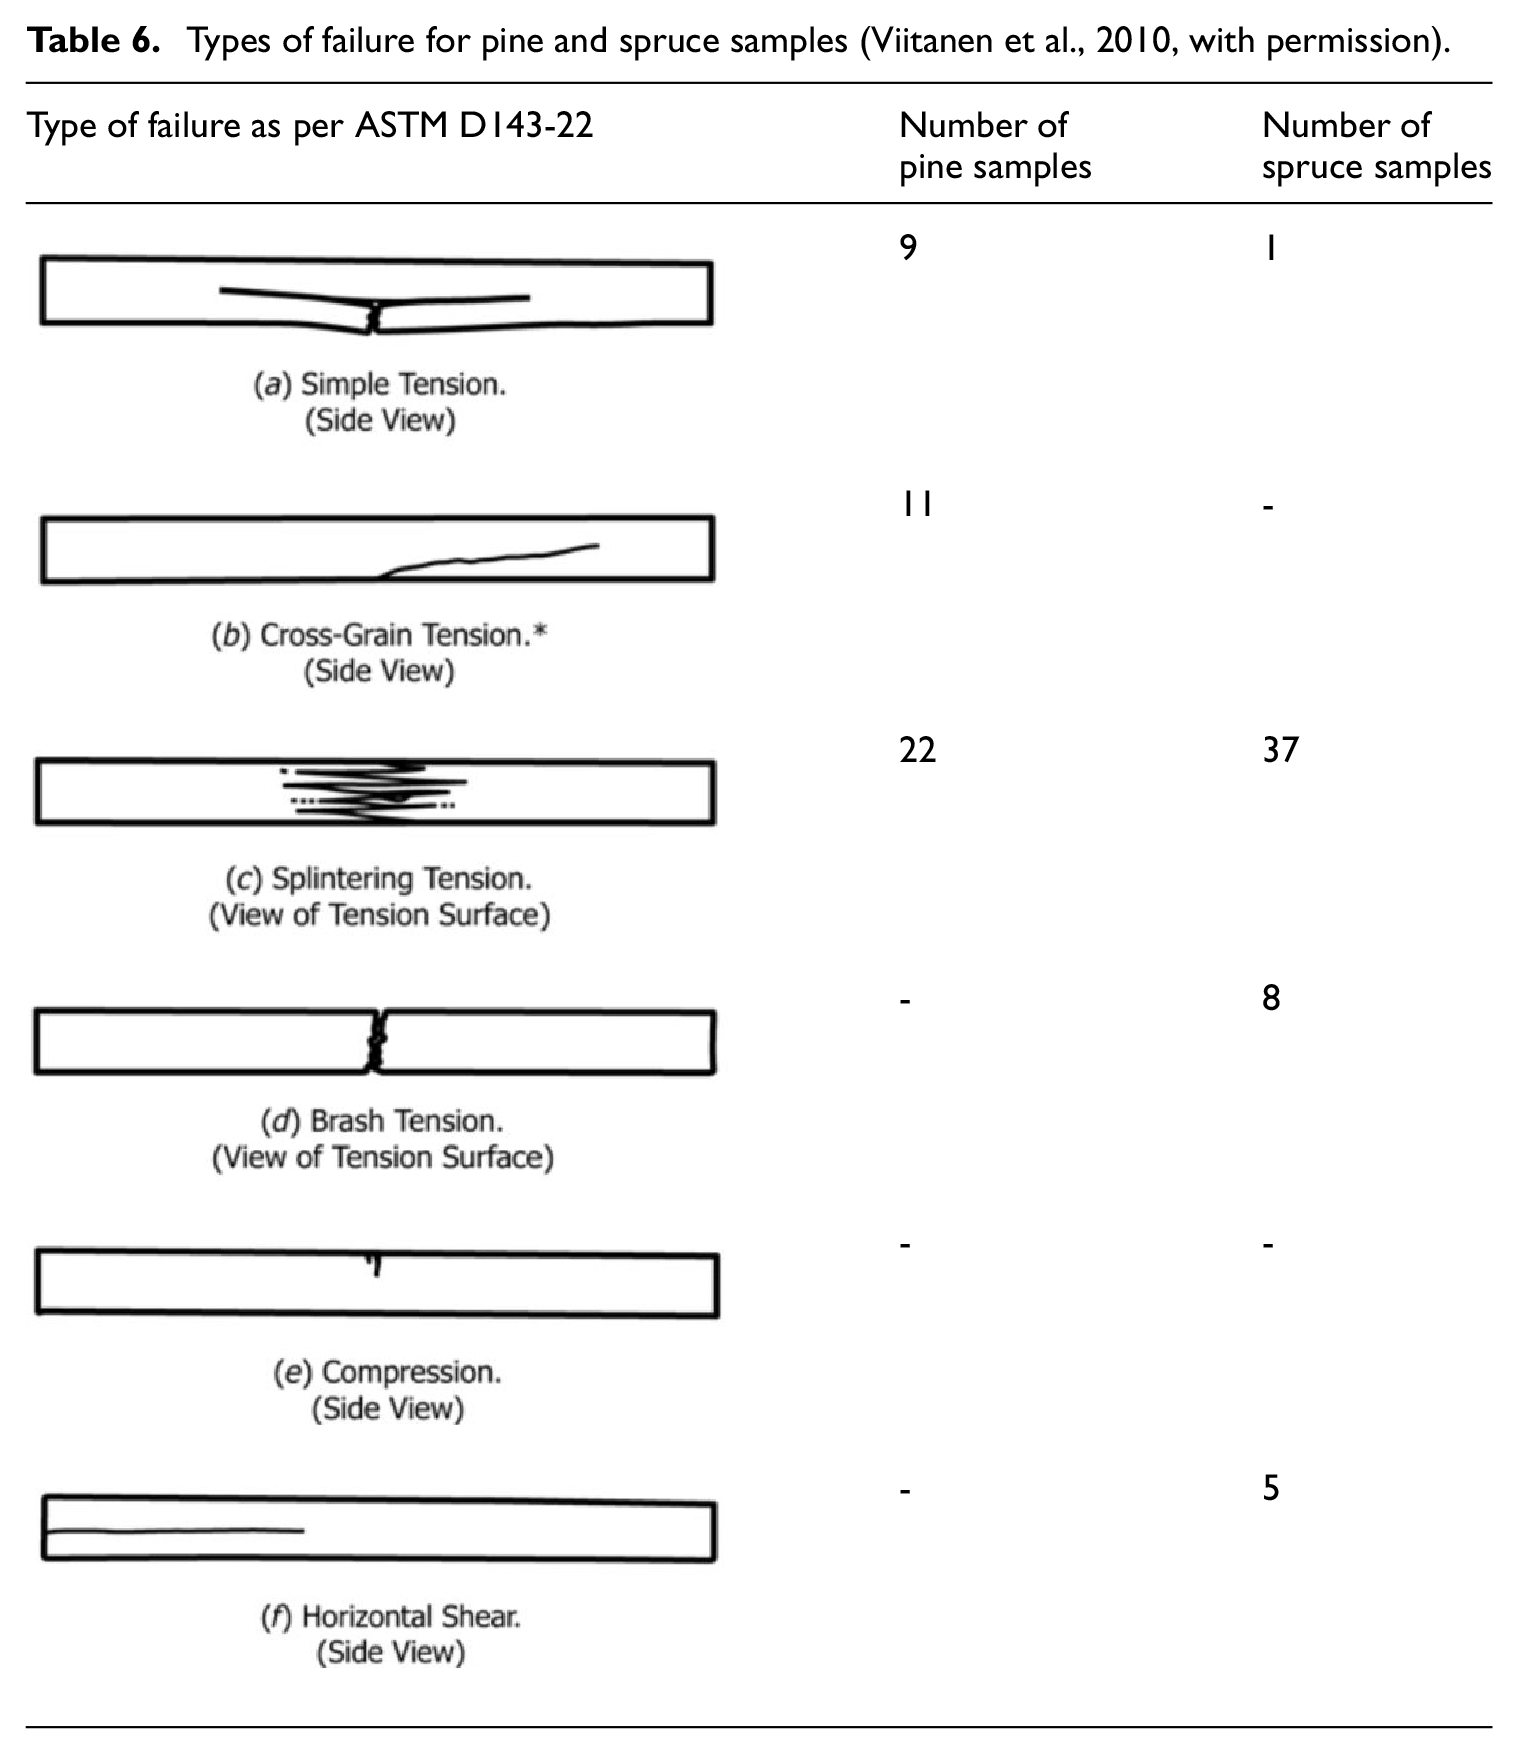
We first report modes of failure observed as categorized in D07 Committee (2021). Table 6 provides the number of events observed per type of failure. Splintering tension failure was the most commonly observed type on the two species, on samples with MOR ranging from 38.4 to 95.0 MPa. Simple tension is also observed in both species with MOR values ranging respectively from 52.3 to 69.9 MPa. Brash failure mode was observed only in spruce samples on the specimens with the lowest MOR values recorded (i.e. less than 25.8 MPa). Cross-grain tension was only found in the pine samples with MOR values ranging from 27.5 to 49.2 MPa. Horizontal shear only happened with spruce samples with MOR values between 72.4 and 92.4 MPa.
Types of failure for pine and spruce samples (Viitanen et al., 2010, with permission).
The moduli of elasticity and rupture of the characterized wood samples are listed in Table 7. We remind that the mechanical tests were carried out with a length/width ratio of 10 to extract the maximum number of samples from the colonized wood pieces, whereas this ratio should have been 14 to comply with ASTM D143-22 (D07 Committee, 2021) which could tend to encourage shear. However, this modification does not prevent the discussion of the results. The following figures have been drawn to better understand the influence of colonization on mechanical strength in relation to wood density. Figure 4 show that, for sound pine samples, the greater the density, the greater the MOE and MOR. For spruce samples, the correlation, initially including only sound samples, becomes stronger with the addition of colonized samples, suggesting that loss of density implies loss of mechanical strength in this case. For similar densities, it is possible to observe that visually altered samples have much lower MOE and MOR values (Figure 5). We note the low and very low correlation values, but include them to illustrate the spread of the tendencies.
MOE and MOR values of pine and spruce and 3 colonization levels.
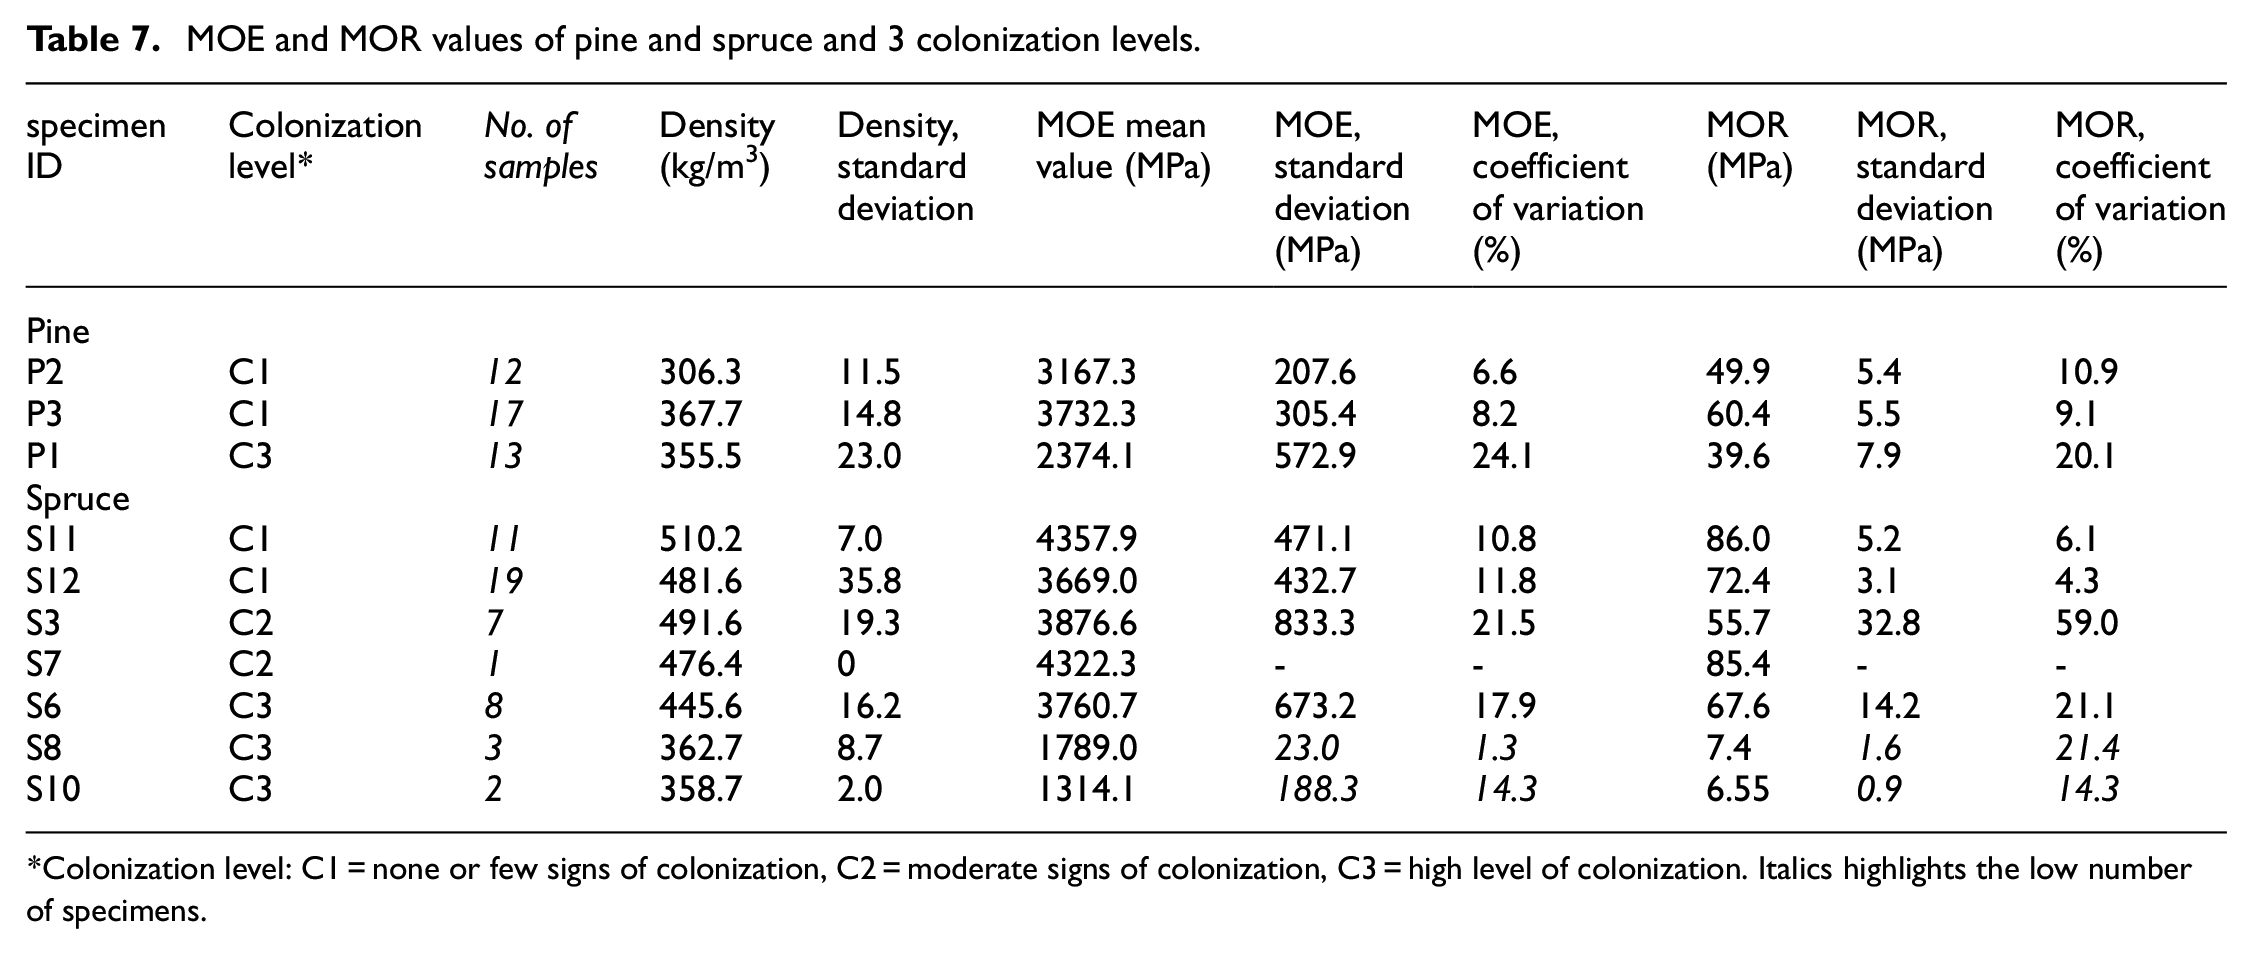
Colonization level: C1 = none or few signs of colonization, C2 = moderate signs of colonization, C3 = high level of colonization. Italics highlights the low number of specimens.
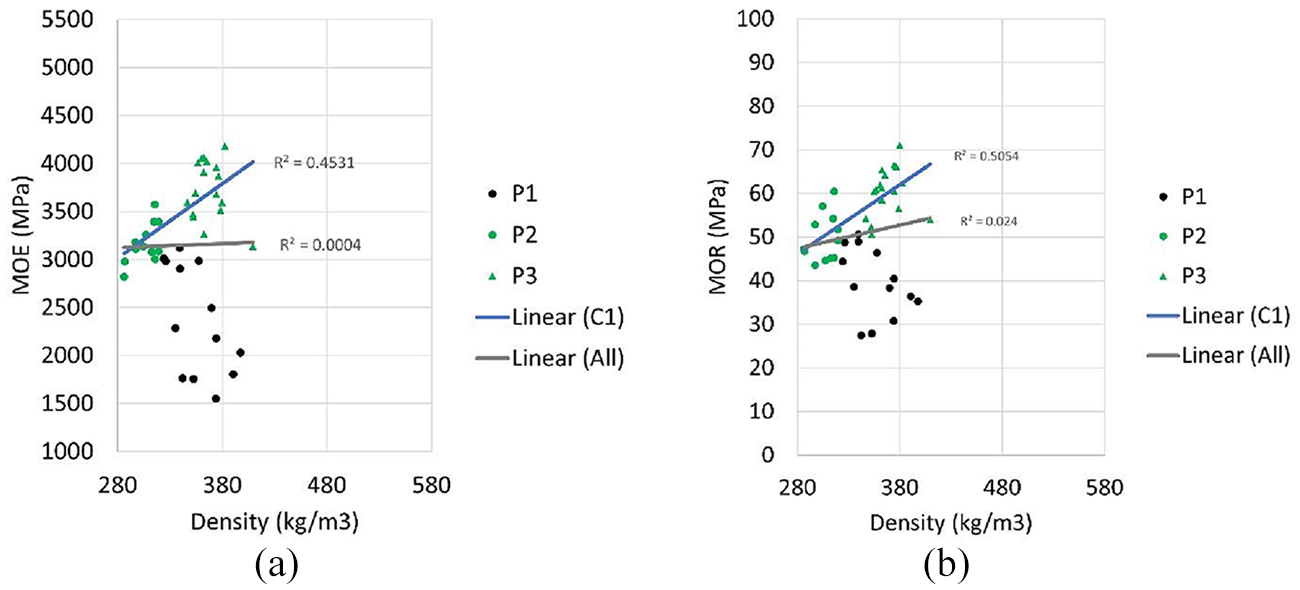
(a) MOE and (b) MOR values for pine samples.
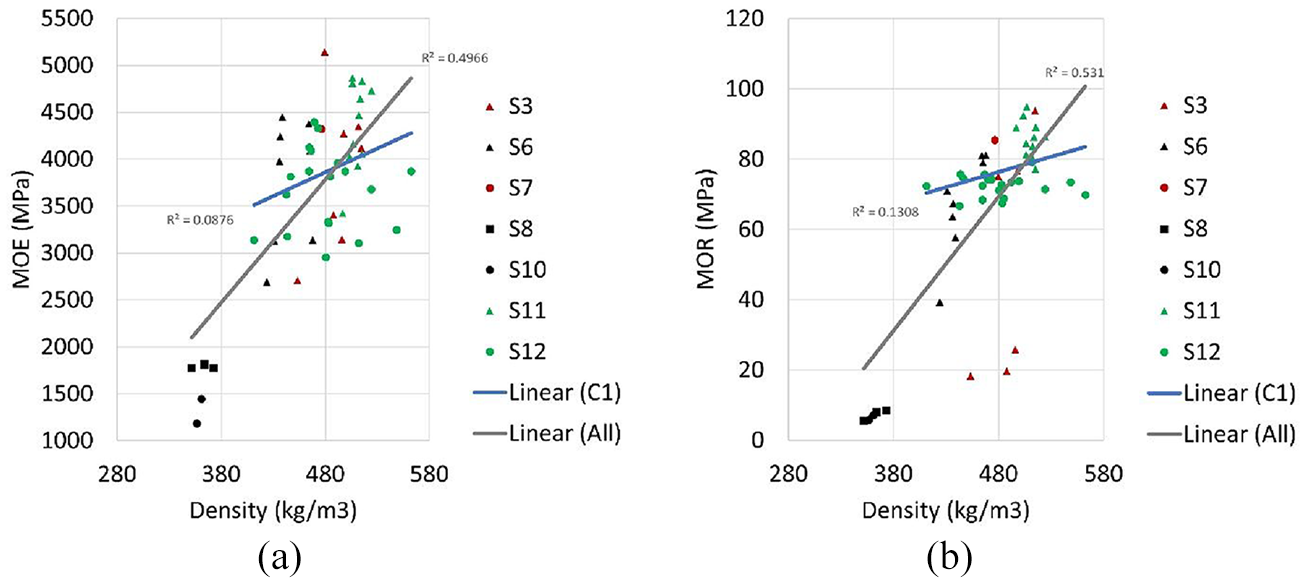
(a) MOE and (b) MOR values for spruce samples.
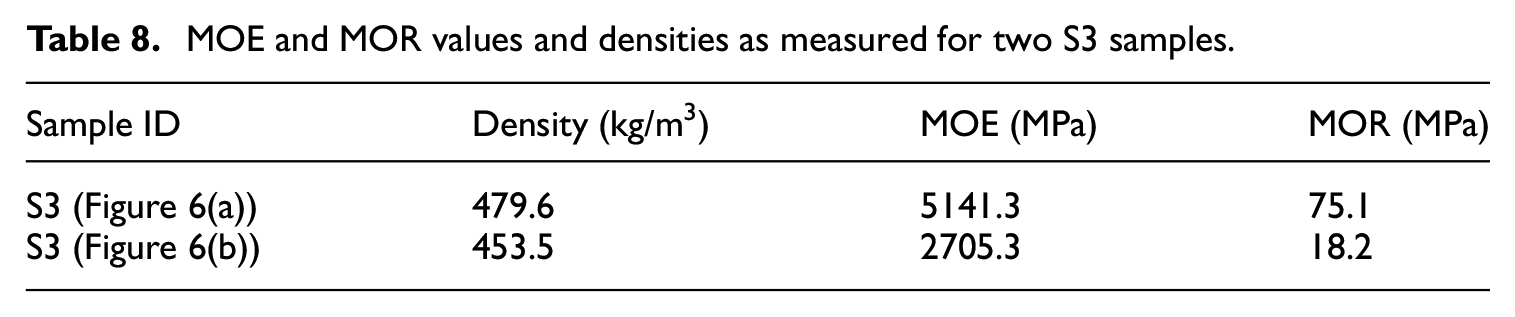
The two samples shown in Figure 6(a) and (b) come from the same piece of wood, covered by S. lacrymans, shown in Figure 6(c). Figure 6(b) shows signs of alteration with its darker brown color. Table 8 presents MOE and MOR values measured. For a density 5.5% higher, S3 (Figure 6(a)) has MOE and MOR values respectively 47.3% and 75.8% higher than S3 (Figure 6(b)).
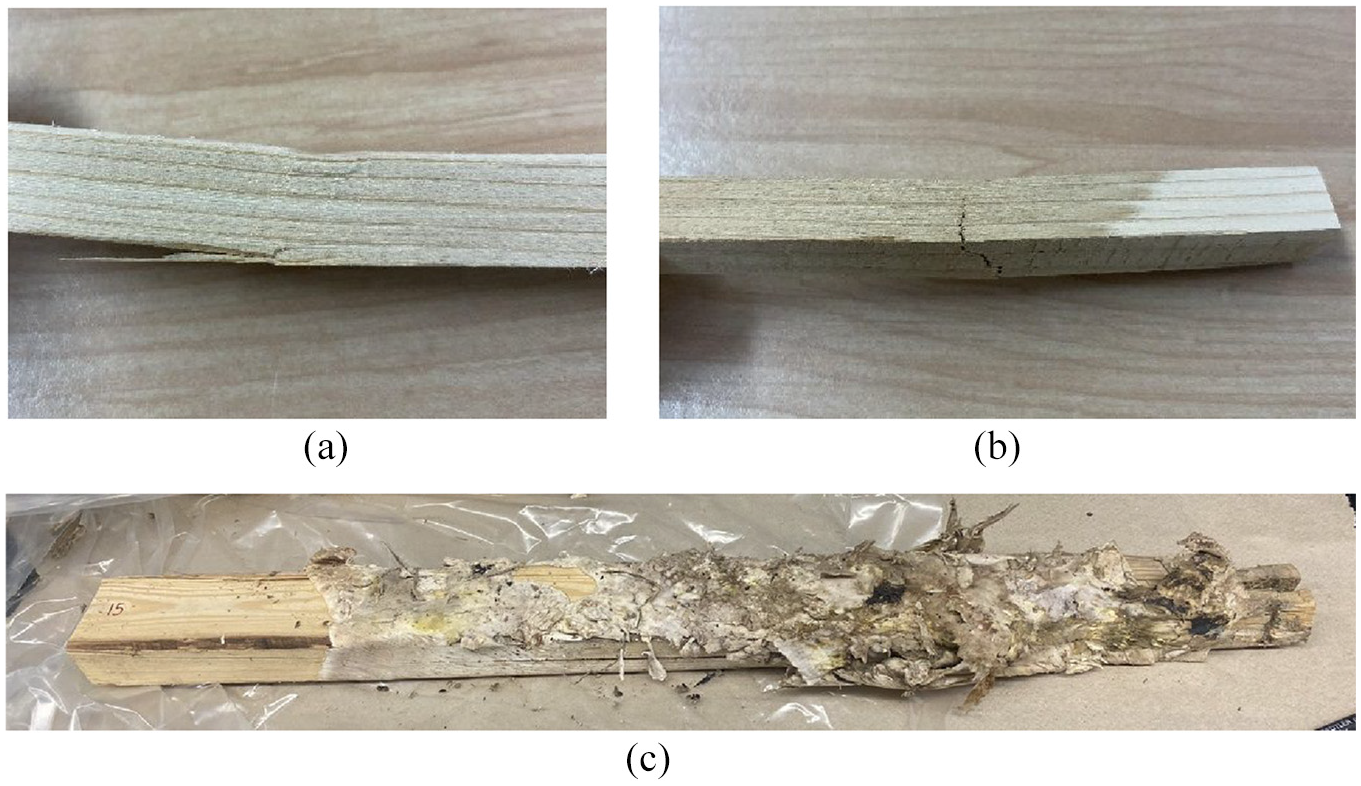
(a) Spruce sample with no sign of colonization, (b) spruce sample with signs of degradation and (c) spruce specimen covered by S. lacrymans.
MOE and MOR values and densities as measured for two S3 samples.
We note that mechanical testing indicates that the absence of mass loss does not necessarily mean the absence of loss of mechanical strength. As there is no known method for estimating loss of mechanical strength from visual inspection of colonized samples, when rot-affected components play a structural role, it would be preferable to replace them, even if the colonization is minimal (Forest Products Laboratory and United States Department of Agriculture, 2010).
Hygrothermal performance of assemblies with colonized components
Assessment of colonized wood hygrothermal properties
For Phase 1, the material properties from the material files from Delphin are used as is, except for moisture sorption which is replaced by results obtained experimentally on sound wood. Table 9 provides density (ρ in [kg/m3]), water vapor resistance factor (μ in [-]), porosity (ϕ in [m3/m3]), capillary saturation content (wcap in [m3/m3]), effective saturation (wsat in [m3/m3]) and water uptake coefficient (Acap in [kg/(m2.s0.5)]) for longitudinal and radial directions of sound pine and spruce.
Base properties of pine and spruce and calibrated properties of spruce wood at two colonization levels.
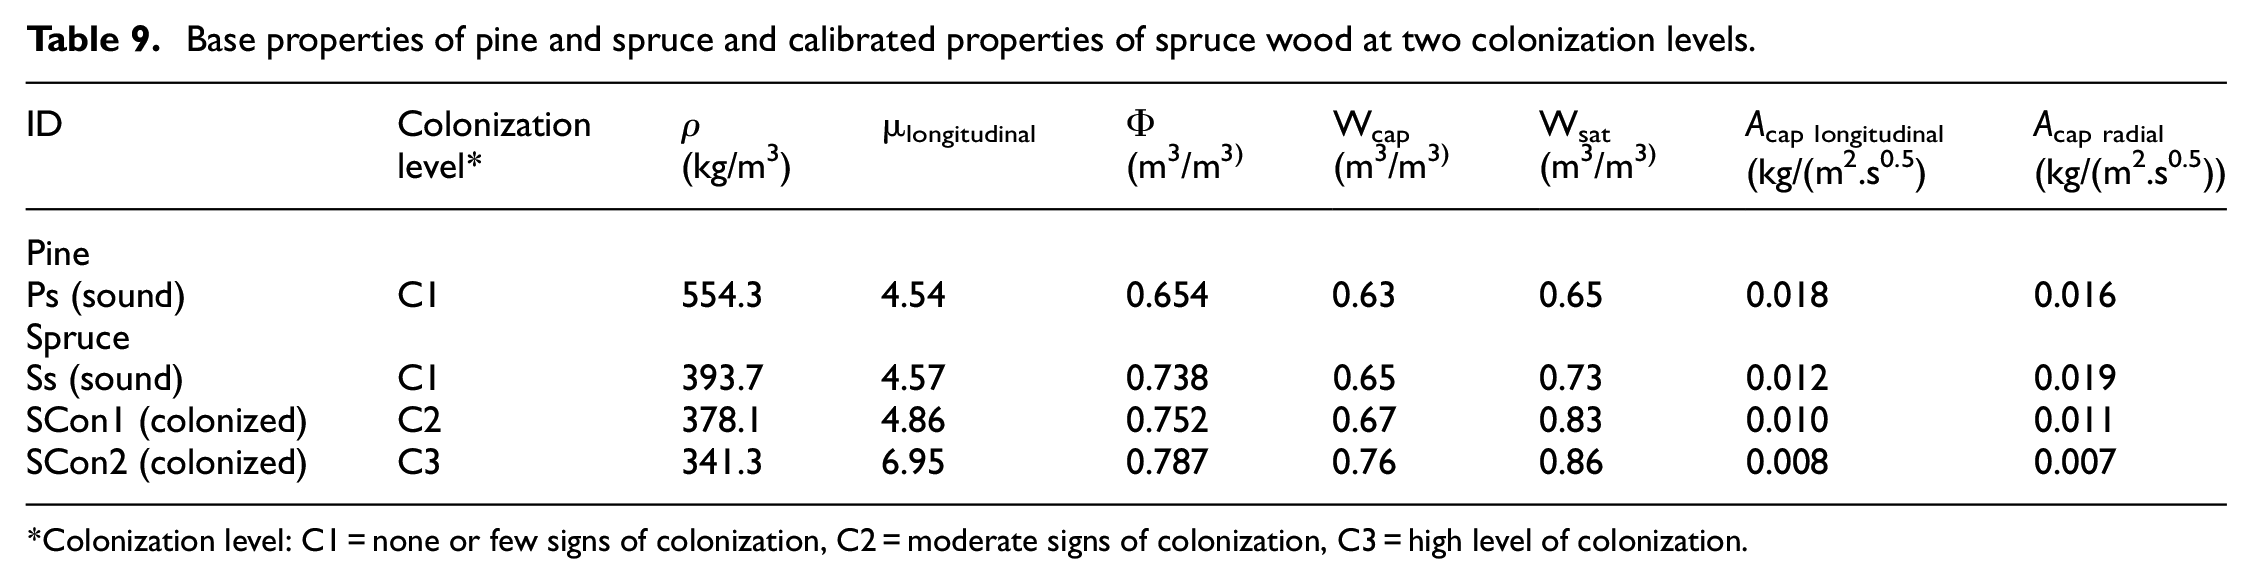
Colonization level: C1 = none or few signs of colonization, C2 = moderate signs of colonization, C3 = high level of colonization.
Hygrothermal simulation results
Given the scarcity of our pine results, we do not attempt to produce a “colonized pine” dataset, and we proceed solely to produce a “colonized spruce” dataset using the results of colonized samples of spruce reported above to calibrate the retained spruce dataset. To do this, based on the properties characterized in the laboratory, the properties of the materials selected in Delphin are weighted. For example, as the colonized wood density has a percentage deviation of 15% lower, the 15% deviation is applied to the wood density taken from Delphin to create the colonized wood to be simulated. Our proposed calibrated hygrothermal properties of spruce colonized to levels C2 and C3 are listed in Table 9. Sorption isotherm curves measured experimentally have also been added to the materials modified in Delphin.
The hygrothermal parameters, temperature, relative humidity, moisture content, are evaluated based on an average value over the area of each of the 12 zones.
Phase 1
Phase 1 is carried out to target areas of decay over time and to assess which cities are more prone to decay depending on the scenario. Figure 7 shows a comparison of the results obtained for the seven cities, for the four scenarios in zone 8. The results for the other 11 zones can be found in Supplemental Information.
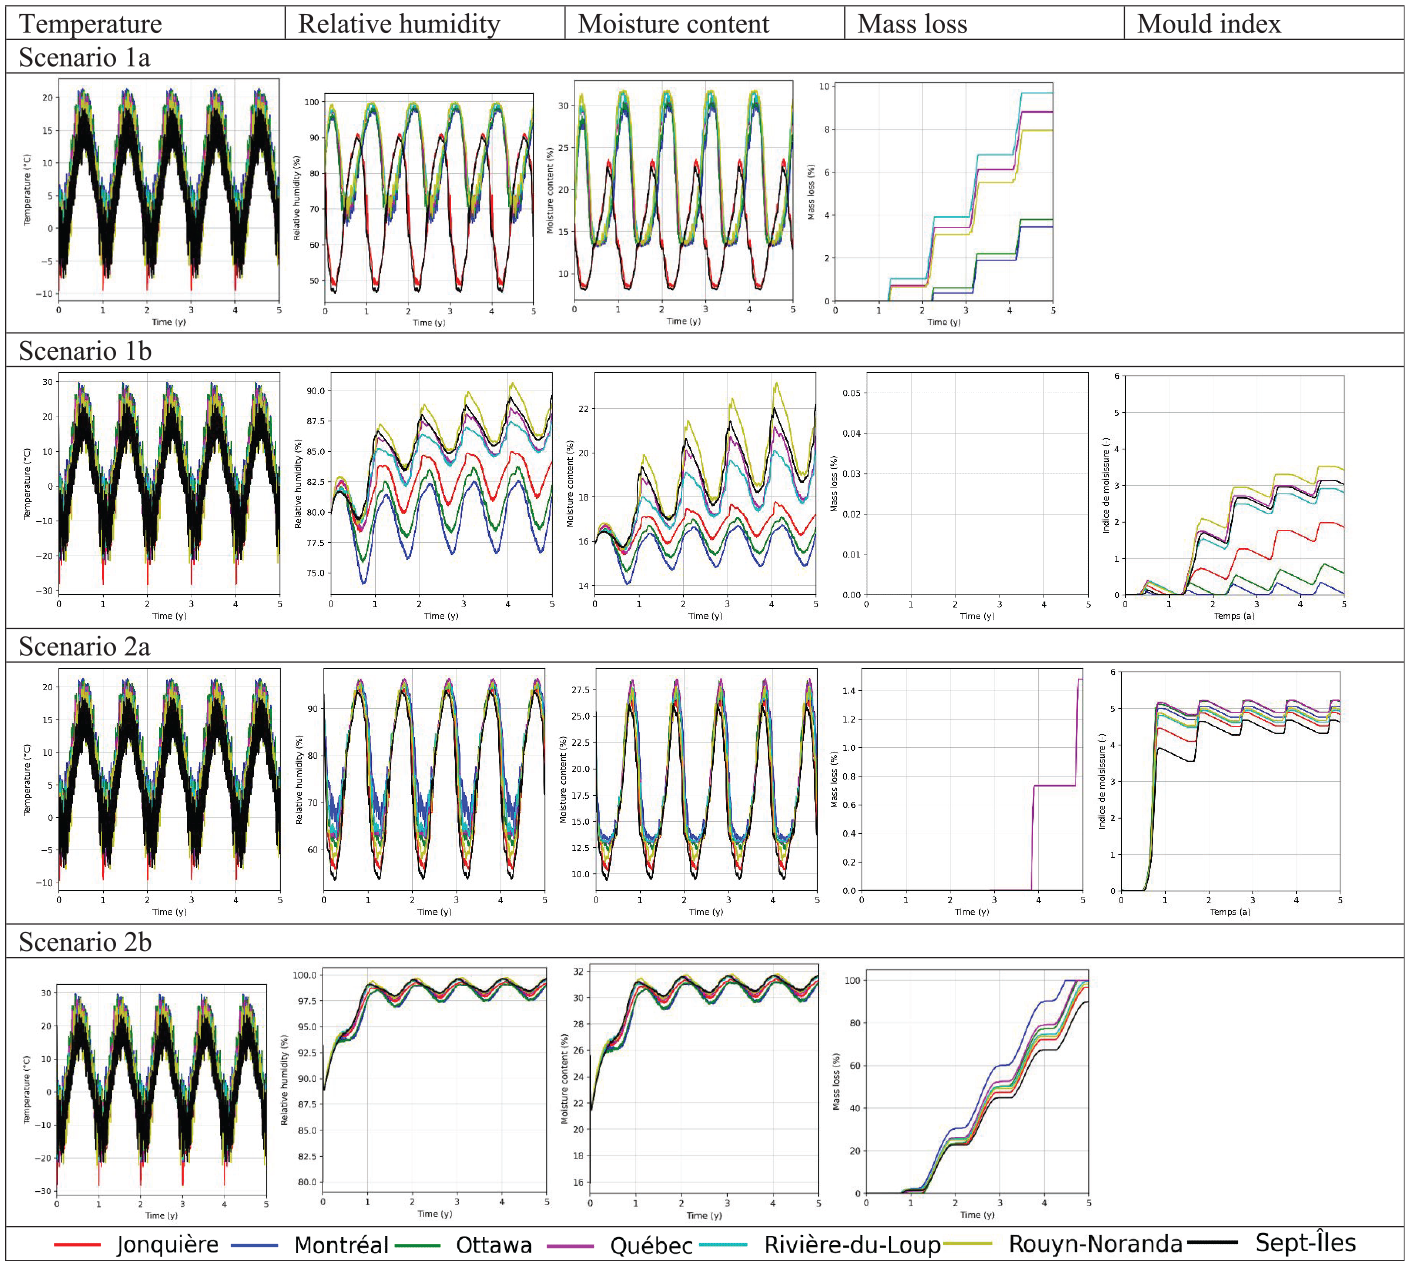
Comparison of temperature, relative humidity, water content, mass loss, and mold index for zone 8 of spruce joist for the 2 scenarios, 2 configurations and 7 cities.
In Scenario 1, maintaining the relative humidity at 80% RH in the crawl space contributes to creating favorable conditions for the degradation of wood components. In Scenario 1a, the interior face of the wood components is the location where biodegradation begins and is at its worst. For both pine and spruce, the highest mass loss is seen for Rivière-du-Loup. The cities of Jonquière and Sept-Îles show no mass loss. More degradation is recorded for pine than spruce in this scenario. Scenario 1b is free from degradation in the five years simulated as polyurethane foam acts as a barrier to water vapor present in the crawl space, preventing excess moisture from being absorbed by wood components, absorption that would be due to high relative humidity in the crawl space. We note that polyurethane foam does not prevent the wood components to be almost directly exposed to outdoor conditions. We see the maximum annual water content continues to increase with each year of simulations, as shown in Figure 7, and it would not be impossible to observe mass loss in the assembly in the future. Figure 8(a) shows the mass loss over time per zone for Scenario 1a for the climate of Rivière-du-Loup. Scenario 1b is not illustrated as no mass loss was measured.
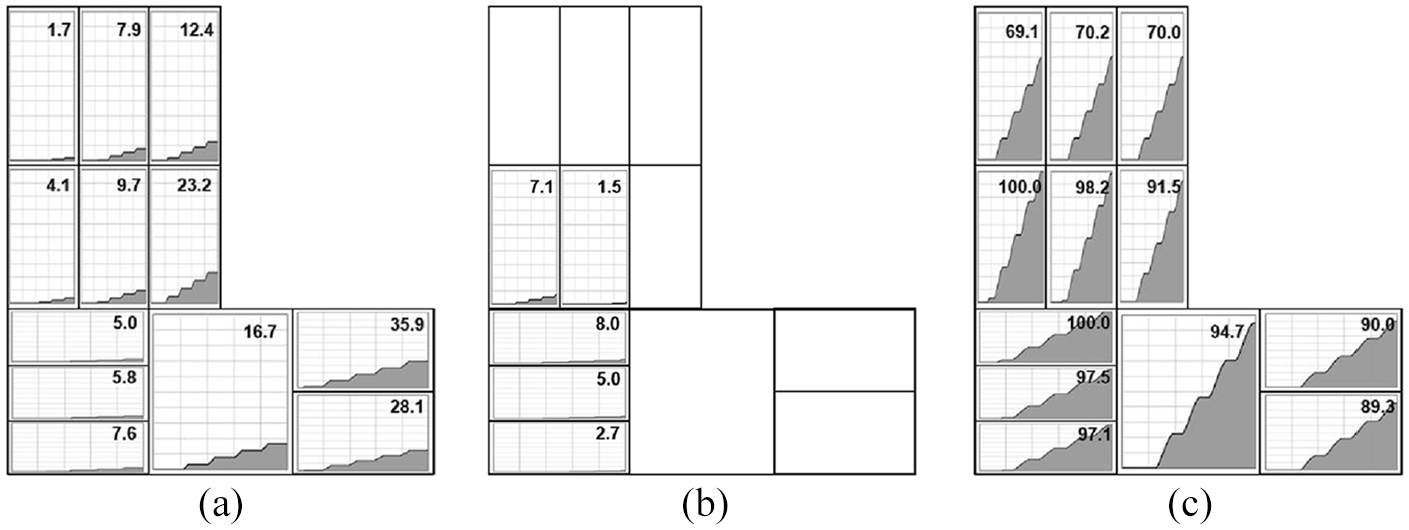
Mass loss in time per zone for (a) Scenario 1a (climate of Rivière-du-Loup), (b) Scenario 2a (climate of Québec), and (c) Scenario 2b (climate of Rouyn-Noranda), for spruce assembly.
In Scenario 2, with account for a water leak, insulated assemblies have a greater and more widespread mass loss than the same assemblies without insulation. This confirms that closed-cell foam insulating a moist wood or a wood component subjected to a moisture source contributes to material degradation by limiting its drying potential and maintaining temperatures favorable to biodegrading agents. For Scenario 2a, the degradation is localized at the water source and remains closer to the exterior side of the wall assembly when noticeable. In Scenario 2b, the greatest mass loss is recorded around the water source and degradation progresses more rapidly in the sill plate than in the joist. According to the simulation results, Jonquière and Sept-Îles appear to be the least susceptible cities to decay for these scenarios. On the contrary, the climates of Québec City, Montréal and Rouyn-Noranda seem more likely to generate favorable conditions to decay in these scenarios. More degradation is recorded for pine than spruce in both cases based on mass loss correlations derived from the work of Viitanen et al. (2010). Figure 8(b) and (c) show the mass loss in time per zone for Scenario 2a for the climate of Québec and Scenario 2b for the climate of Rouyn-Noranda.
Phase 2
To measure the impact of changing wood properties on the hygrothermal performance of assemblies, simulations are carried out for the cities of Montréal and Sept-Îles for the scenario most susceptible to mass loss (Scenario 2b). The stages of wood property changes are based on average mass losses of 3.96% and 13.3% measured in the laboratory. The impact of the change in properties is observable and differs according to the targeted zone of the assembly. For the city of Sept-Îles, zones 1–9 have a higher total mass loss when properties are changed. However, zones 10–12 are less degraded once the wood properties are modified. In every zone, mass loss starts at the same time than in Phase 1. For the city of Montréal, mass loss is generally lower when the wood properties are changed. For zones 1–3 and 7–9, mass loss also starts later when the wood properties are modified.
Phase 3
Hygrothermal simulation tools and mass loss calculations consider degradation by a fungus based on VTT model (Viitanen et al., 2010), model which does not actively contribute to water transport like S. Lacrymans does. For the city of Sept-Îles, mass loss with added water transfer is higher for zones 1–9 than for Phase 1 and 2. For zones 10–12, mass loss for Phase 3 is still a little higher than what is observed for Phase 2 while following the same trend but is lower than what is seen for Phase 1. As for Montréal, mass loss with water transfer follows the same trend as Phase 2 but is a little higher in all zones. While higher than for Phase 2, the values measured are still lower than in Phase 1. The amount of water added would therefore not be sufficient to overcome the drying potential increase resulting from wood degradation in Montréal, as discussed in the previous section. Figure 9 shows the evolution of mass loss and MC for zone 8.
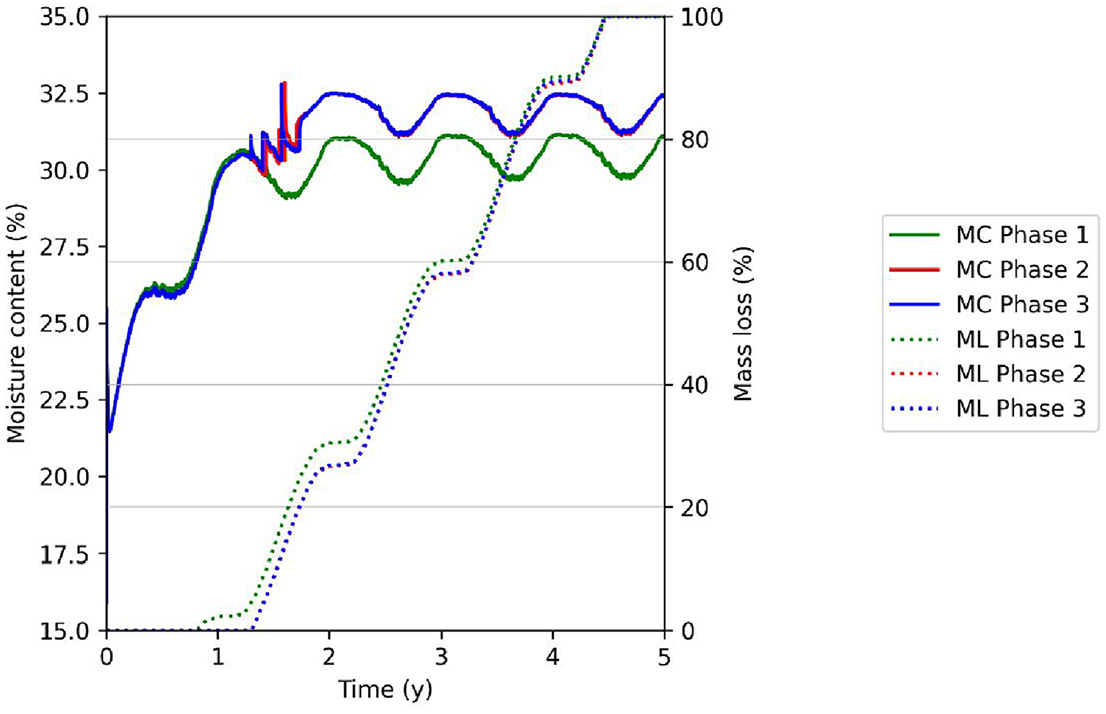
Comparison of mass loss and MC for three simulation phases for spruce assembly for Scenario 2b in Montréal and with changing material properties to reflect biodegradation at 4% and 13.3% mass .
Model sensitivity
To look at the impact of considering wood properties orthotropically, the same scenario is simulated, on one hand, with the anisotropic material transport model to consider different wood properties in radial and longitudinal dimensions (2D) and, on the other hand, using isotropic material properties. Figure 10 shows a comparative example of the impact of this change for Scenario 2b for the city of Montréal in zone 6 of the sill plate.
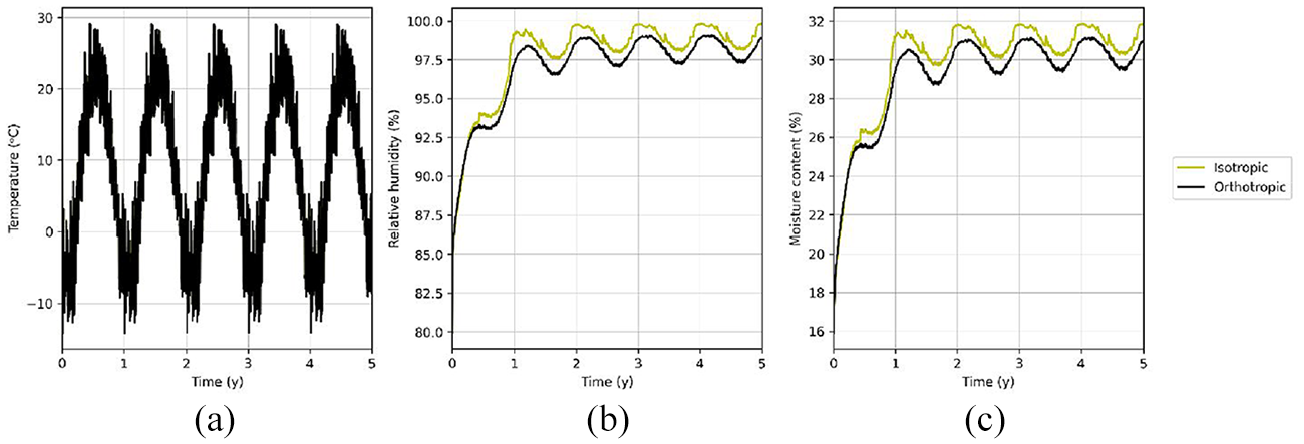
Comparison of the influence of isotropic and orthotropic wood properties on (a) temperature, (b) relative humidity, and (c) moisture content in a section of sill plate, for Scenario 2b for Montréal.
Figure 10 shows that simulation with isotropic of orthotropic material properties has no impact on the temperature in the wood. However, it can be observed that relative humidity and moisture content are generally higher and more variable for the simulation with one-dimensional wood properties than for that where two dimensions are included. These variations validate the importance of characterizing anisotropic materials with anisotropic material properties to obtain more realistic results.
Discussion and conclusion
The growing number of cases of S. lacrymans in Québec has led the provincial government to look for ways of obtaining more scientific knowledge specific to the province environmental conditions and built environment. A better understanding of the impact of wood degradation by S. lacrymans can undoubtedly lead to better prevention or control of the damage caused by the fungus. To arrive at the methodology presented in this paper, we collected samples of sound wood and wood colonized by S. lacrymans across the province to study their physical and mechanical properties. This approach was chosen to observe actual cases of colonization and to discuss with owners the history leading up to their situations. These discussions helped us to understand that S. lacrymans colonization problems are not necessarily linked to negligence on the part of homeowners, contrary to what is dictated in insurance policies.
We performed characterization of the hygric and mechanical properties of the collected samples. An intriguing result of this study showed that, for spruce and maybe also for pine, the water vapor resistance factor was higher for samples degraded by S. lacrymans than for sound samples. In future work, it would be pertinent to measure the water vapor resistance factor in, at least, three different relative humidity pairs, using saline solutions, to have a better portrait of this parameter (Richter and Staněk, 2021). The study showed that Acap values were higher for sound samples and that wcap values seemed to increase along VTT with colonization levels. For spruce samples, wsat values were increasing with the colonization level, but the contrary was true for pine samples. Since porosity increased with wood degradation, it is possible that degradation had a thermal influence on the assembly in the sense that the drying potential seemed to be increasing along with degradation. In effect, a higher porosity could be accompanied with a changed configuration of the pore network in the wood.
Finally, no conclusion could be drawn from pine sorption isotherms, but sorption isotherms were lower for spruce degraded samples than for sound samples.
Regarding the mechanical characterization, results showed that the absence of mass loss does not mean no loss of mechanical strength. However, certain trends have been observed. For spruce samples, both MOE and MOR values seemed to be increasing with density. As for pine MOR values seemed to increase with density, but no correlation was found between MOE values and density. Some level of colonization indicates a risk for decreased mechanical properties.
This project characterized wood damaged at different levels of colonization. Several factors influenced the results: the natural variability of the wood, the number of samples characterized and the unavailability of pre-colonization properties to really compare the change in properties. Also to bear in mind, although the collection of colonized wood specimens in the field enabled us to better observe and understand the environmental conditions in which the fungus develops, it is likely that some of the specimens collected were colonized by more than one fungus. In order to limit the effect of these factors and to limit the likelihood of multiple colonization, wood samples characterized in a sound state could subsequently be colonized with S. lacrymans in controlled conditions and characterized at different levels of colonization. This colonization method could enable more accurate mass loss measurements and the corresponding physical and mechanical tests to be carried out. Further, to simulate the behavior of S. lacrymans more realistically, it could be interesting to investigate the conditions and responses of the fungus to water transport in living and dead states. Such a study could provide a better understanding of water transport by the fungus, and thus contribute to estimating the state of colonization and its level of degradation over time. In this sense, the growth rate of S. lacrymans could be integrated into the models.
In terms of the assessment of the hygrothermal performance of wood-based wall assemblies colonized by S. lacrymans, the project simulations were separated in three phases, including a phase regrouping all seven city climates with two sub scenarios, a high RH crawl space and a continuous water leak in the wall assembly. Simulations have shown which climates in Québec offer the most favorable conditions for decay, namely Montréal, Québec City, Rivière-du-Loup, Rouyn-Noranda, and which are less favorable to decay, that is, Jonquière and Sept-Îles. The project showed that a dry insulated wood assembly was without surprise better protected from biodegrading agents, and that if wet wood components were insulated, the risk of degradation was accentuated. Uninsulated wall assemblies were influenced by both indoor and outdoor climatic conditions. Phase 2 of the simulations showed that degraded wood properties could enhance drying potential in warmer climates but accentuate water retention in colder climates. Finally, Phase 3 showed that the addition of a water source into components, as a surrogate of hyphae-borne moisture transfer in the assemblies, slightly accentuated mass loss compared to Phase 2.
Should this work go on, additional avenues could be explored. First, the simulations were carried out with wood properties in two directions, longitudinal and radial. With an adequate amount of data characterized in the laboratory, it would be interesting to integrate wood properties in the tangential direction into the simulations. In this sense, the simulations were carried out using a two-dimensional computational domain. Performing the simulations in a three-dimensional model could allow us to consider structural elements such as studs and floor joists, which have been neglected in the wall assembly featured in the project. Two insulation scenarios were considered for the project, one with a crawl space fully insulated with polyurethane and one with an uninsulated crawl space. In the future, it may be appropriate to simulate a partially insulated crawl space, for example by placing a layer of insulation only on the foundation wall. Different crawl space ventilation scenarios could also be explored. Furthermore, it would be interesting to run simulations based on optimistic and pessimistic climate projections to see the effect of climate change on the degradation of wood assemblies affected by S. lacrymans.
This paper documented the characterization of wood properties in sound and colonized specimens and succeeded in simulating the spread of biodegradation in wood-frame buildings and, more specifically, investigated this spread considering the impact of S. lacrymans colonization of wood components on the hygrothermal performance of wood-framed wall assemblies. The work presented has the particularity of being two-pronged, combining experimental work and simulations to provide a better understanding of the deterioration caused by the growth of S. lacrymans in wood-framed building assemblies in Québec, under different environmental conditions.
Supplemental Material
sj-docx-1-jen-10.1177_17442591251327742 – Supplemental material for Hygrothermal characterization and performance of wood in assemblies accounting for contamination by Serpula lacrymans
Supplemental material, sj-docx-1-jen-10.1177_17442591251327742 for Hygrothermal characterization and performance of wood in assemblies accounting for contamination by Serpula lacrymans by Camille Roy, Dominique Derome, Caroline Frenette and Anahita Bigtashi in Journal of Building Physics
Footnotes
Declaration of conflicting interests
The author(s) declared no potential conflicts of interest with respect to the research, authorship, and/or publication of this article.
Funding
The author(s) disclosed receipt of the following financial support for the research, authorship, and/or publication of this article: This project was made possible through the support of Mitacs grant no.FR80287, Société d’habitation du Québec, and Merule Quebec. The NSERC Discovery grant of Prof. Derome is acknowledged.
Supplemental material
Supplemental material for this article is available online.
References
Supplementary Material
Please find the following supplemental material available below.
For Open Access articles published under a Creative Commons License, all supplemental material carries the same license as the article it is associated with.
For non-Open Access articles published, all supplemental material carries a non-exclusive license, and permission requests for re-use of supplemental material or any part of supplemental material shall be sent directly to the copyright owner as specified in the copyright notice associated with the article.