
Abstract
The performance and durability of wood-frame building envelopes is affected by long-term moisture transport and its impact. Despite considerable progress in deterministic and prescriptive methodologies aimed at estimating moisture deposition and the consequent risk of mold growth, a consensus in methodology applicable to the analysis of moisture risk in building enclosures is an unfinished agenda. This might partly be caused by uncertainties that exist due to variations in input parameters, model structure, and data scarcity. To address this issue, this study presents a probabilistic risk assessment of building envelope deterioration from moisture accumulation. The proposed methodology integrates the development of meta-models, a full-factorial response surface methodology, and Bayesian analysis. The effectiveness of the proposed approach is demonstrated through a parametric analysis of typical wall assemblies featuring diverse layers and boundary conditions. The findings highlight the influence of input variables and their relative significance on moisture accumulation in the selected climate zones. Additionally, a sensitivity analysis of model parameters and the application of Bayesian analysis in specific contexts are presented, facilitating comparative evaluation of moisture-related risk of building envelopes.
Keywords
Introduction
Moisture causes mechanical, chemical, and biological deteriorations that impair the structural integrity and hygrothermal performance of components. Examples of moisture-induced wall degradations include the growth of mold, rusting of fasteners, swelling and disintegration of cladding, and rotting of stud cavities and other wood-based products. Moreover, an envelope that is overly damp may affect the occupants’ health through development of hazardous organisms.
In current building practices, the evaluation of building performance in the context of moisture response of building envelopes is commonly achieved using building simulations. The modeling allows a high-resolution analysis, and a wider range of simulations can be performed by acquiring data from database, experiments, or field experience. This approach, although providing explicit estimates, is data-intensive, case-sensitive, and computationally expensive. It relies heavily on quantity and quality of input data to provide point estimates as the output.
Given the uncertain nature of the problem, there may exist uncertainties in input data (e.g. data scarcity and broad variance of boundary conditions in real systems), parameters (e.g. different material properties due to inhomogeneity), model structure (e.g. a different approach of heat, air, and moisture transport in the model), and limited knowledge (e.g. number of variables taken into account in modeling and the correlation between them). As such, deterministic approaches possess a limitation in providing information about the degree of uncertainty.
Probabilistic approaches, on the other hand, are able to handle the uncertainty and randomness of physical processes (Madanat et al., 1995). Probabilistic models can be employed when random noise in components is present, and hence incorporate the inherent uncertainty into the process. There are a number of existing studies which applied probabilistic approach in evaluating the performance of building envelopes. Studies examined uncertainties in thermal performance of building envelopes using probabilistic approach were conducted in Pietrzyk (2010); Struck et al. (2009). Sun et al. (2016) developed a probabilistic assessment method for estimating energy performance based on building energy simulation. Pietrzyk and Hagentoft (2008) studied reliability of building performance in terms of failure probability due to air exchange by using reliability analysis. In a more recent study, Pereira et al. (2020) formulated equations for estimating condition degradation of envelopes due to various external conditions (i.e. age, dampness, and direction of façade) by using logistic regression models. The existing probabilistic studies have contributed to mathematical models and improved understanding of hygrothermal performance of building envelopes. Specific to moisture accumulation and moisture-related deterioration, the authors find limited flexible methods for risk analysis that acknowledge the inherent uncertainties in the problem able to offer a basis for comparing different enclosure solutions.
The application of risk assessment to building physics problems is becoming of more wide concern, however, a methodological consensus on long-term moisture management has not been established. In this study, a probabilistic-based approach is developed. The relationship among material and boundary variables is examined by meta-modeling using the Response Surface Methodology (RSM). Subsequently, a Bayesian analysis is used to capture the stochastic interdependence of variables and their degree of influence on the output variable of hygrothermal performance. The RSM technique allows to build surrogate models to estimate the behavior of complex non-linear systems (Sarabia and Ortiz, 2009). García-Cuadrado et al. (2022) adopted this approach for analyzing building energy performance, considering various thermal-comfort factors.
The approach is applied to the assessment of biodeterioration risk from moisture accumulation in typical wood-frame exterior wall assemblies in North America. The examined key variables include material properties, moisture infiltration, and geographic location. The risk assessment that this methodology proposes could support decision-making in the design and construction of buildings. Other than moisture risk, it can be used for the evaluation of various design parameters in building physics, such as energy performance and indoor thermal comfort.
The remainder of the paper is organized as follows. Section 2 to 4 presents the theoretical background of the probabilistic approach. Section 5 describes the methodology and steps of analysis. Section 6 provides results and discussion, including model evaluation and uncertainty analysis. Finally, concluding remarks and further study are given in Section 7.
Probabilistic approach for moisture response of building envelopes
There are three main categories of deterioration modeling in the literatures: deterministic, probabilistic, and artificial intelligence–based methods. Deterministic models are based on the assumption that a component’s future condition state has a direct and constant relationship with time (Ranjith et al., 2013). They are unable to capture the uncertainty and randomness of the physical processes. Most artificial intelligence–based models are data driven and are non-transparent (black-box) in deriving the prediction models. On the other hand, probabilistic models could present the uncertainty of physical process in a transparent way (Madanat et al., 1995).
Among probabilistic approaches, Bayesian analysis is a popular tool that offers a method for reasoning partial beliefs in the presence of uncertainty (Hasman, 1991). Bayesian analysis is regarded as a powerful technique for modeling risks using uncertain data and has been widely utilized for decision support in a range of engineering domains.
Bayesian analysis is usually represented in the form of Bayesian networks (BNs). BNs consists of two main parts: graph theory and probability theory. A directed acyclic graph (DAG) comprises nodes representing random variables with their corresponding states, and conditional probability tables (CPTs) that correspond to the probabilistic causal dependence among the variables (Hasman, 1991). BN can explain how each variable in the DAG is influenced by its parents. Causality in BN is based on the conditional probability theory, known as Bayes’ theorem, which is expressed as follows:
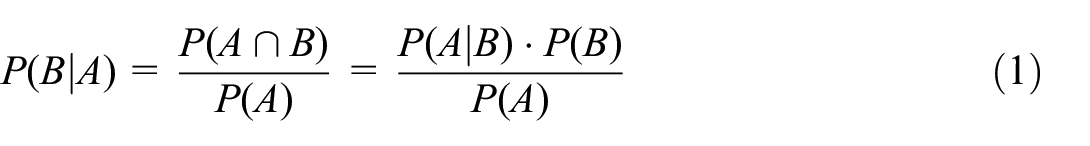
where P(A) (or P(B)) is the probability of A (or B), and P(A|B) (or P(B|A)) is the probability of A (or B), given that B (or A) occurs. When two nodes are connected by an edge, the affecting node is called the parent of the affected or child node (see Figure 1). Child nodes are conditionally dependent on the parent nodes.
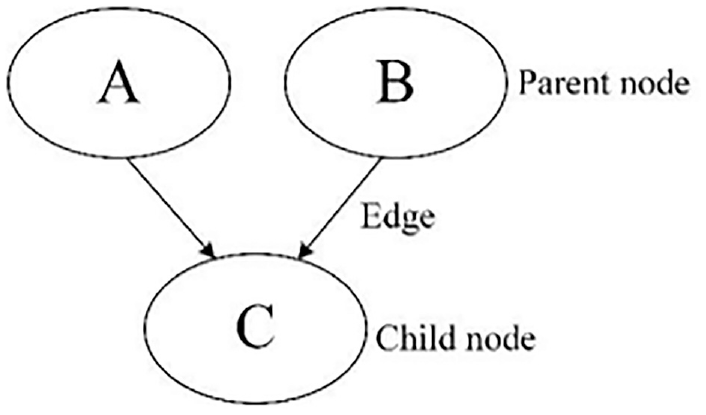
Example of a simple BN.
Building systems are inherently complex and variable, leading to high uncertainties that are exacerbated by limited data availability. To deal with these challenges, Bayesian analysis is deemed to be a suitable approach. Key advantages of Bayesian analysis include their capability to integrate various types of information, their explicit treatment of uncertainty, and their graphical structure. The graphical structure of a BN represents causalities in the modeled system, which increases modeling transparency in comparison to black-box (e.g. machine learning) models, and facilitates communication with stakeholders.
With regard to a building system, the features in Bayesian analysis help integrate variables in the model in a modular fashion. Often, information on some components of the modeled system is already available in the form of empirical and process-based models, which can be translated to conditional probabilities. In this study, model definitions were obtained from regression analysis using a Response Surface Method (RSM). The RSM is a statistical method to explore the relationships between explanatory variables and one or more response variables (Sarabia and Ortiz, 2009). This technique is used to build the surrogate models (which is called meta model). Once the model is compiled, and the parameter distributions are populated, it can be updated by adding evidence (e.g. data or information). As such, Bayesian analysis allows predictive (estimate the effects), diagnostic (estimate the cause) analyses or a combination of both through forward and backward inference.
Bounded probability in Bayesian analysis
A probability distribution is used in Bayesian analysis to quantify uncertainty around parameter δ of a random variable X (Cox, 2006). By employing observations of the variable X, Bayes’ theorem can be used to update parameter uncertainty, a process called marginalization. To do this, a model for the likelihood given values of the parameter δ (the likelihood function) and a model for the uncertainty in the parameter prior to the observation of the variable X (the prior probability) are combined. The posterior probability, indicating parameter uncertainty after marginalization, is expressed as

where P(δ) is the prior probability and P(x | δ) is the likelihood function.
A probability distribution of the parameter could be used to represent the prior probability. This parameter distribution of the parametric prior is called hyperparameter, thus equation (2) can be rewritten into
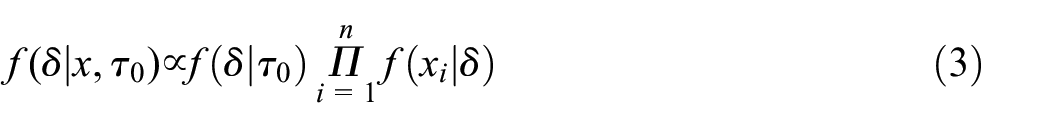
where f represents a probability density function, and τ 0 represents the hyperparameter.
The probability distribution that results from marginalizing a parameter reflects epistemic uncertainty, while aleatory uncertainty is represented by the probability distributions of the assessment variable. In Bayesian analysis, aleatory and epistemic uncertainty are combined and expressed as a single probability distribution of a variable of interest since the distribution of variable X is dependent on the parameter δ distribution.
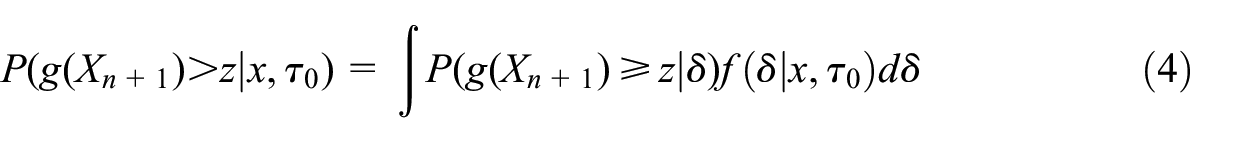
The quantity of interest can be expressed in a cumulative distribution representing the probability of a variable exceeding a certain threshold z. In this relationship, the posterior probability can be expressed as the posterior distribution of the parameter δ times the integral of the variable of interest for a given value of the parameter δ:
Estimation of the analytical solution in equation (4) can be performed by using Monte Carlo simulation. Given random samples θ
1
, …, θ
N
drawn from the posterior distribution f(δ | x, τ
0
), one can estimate the expected value of the quantity of interest. Let
In bounded probability analysis, a set of prior distributions, instead of precise prior distribution, is determined to quantify uncertainty in parameter δ. A probability bound is achieved by maximizing a summary from a distribution, such as a percentile or expectation, across the set of priors. This can be performed either analytically by using conjugate priors or numerically by generating random samples.
Using a set of prior distributions, the upper and lower bound on the estimated probability of surpassing a threshold can be estimated as follows (Troffaes, 2018):
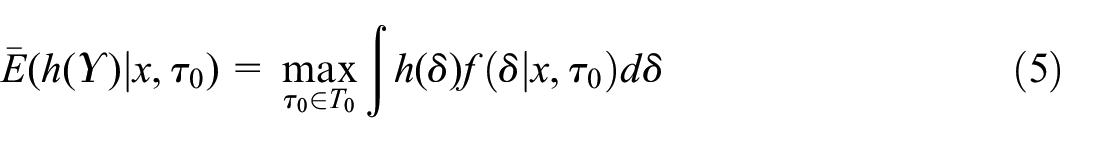
where h(δ) denotes the quantity of interest as a function of parameter δ:

and Θ is the random variable that represents the degree of uncertainty in the parameter δ. As such, the quantity estimate provides uncertainty expressed in terms of probability bounds.
Predictors in building envelope deterioration models related to moisture risk
The deterioration models of wood-framed building envelopes predominately concern moisture-related impacts. For instance, the isopleth model (Smith and Hill, 1982) provides an isopleth graph derived from steady-state experiment. This model relates temperature and water activity conditions to a threshold under which germination had not occurred. The dynamic conditions experienced by fungi in real-world application motivated other metrics such as the decay dose-response for Pinus substrate (Brischke and Rapp, 2008) that relates mold growth to the extent of decay from wood-rotting basidiomycetes. The mold growth in the dose-response model is strongly influenced by climate conditions and hence is coupled to temperature and moisture content. Another category is models characterized by indexes, that correlate a degree of degradation with an index based on empirical observations, such as the relative humidity and temperature (RHT) index and mold index. Table 1 lists the established models of biodeterioration of wood-frame building envelopes.
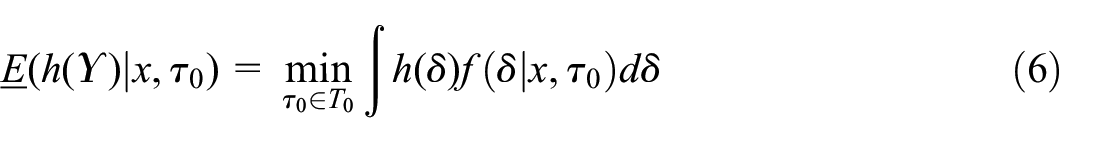
Studies on biodeterioration models of wood-frame building envelope.
Of the established models, the most obvious characteristic is that most models are developed based on steady-state experiments which estimate moisture-related deterioration conditions at an instant or a short time interval. Meanwhile, the long-term moisture management performance of building envelopes is the main concern in building practices regarding durability, and hence should be assessed in a systematic way (Ryan and Bristow, 2023).
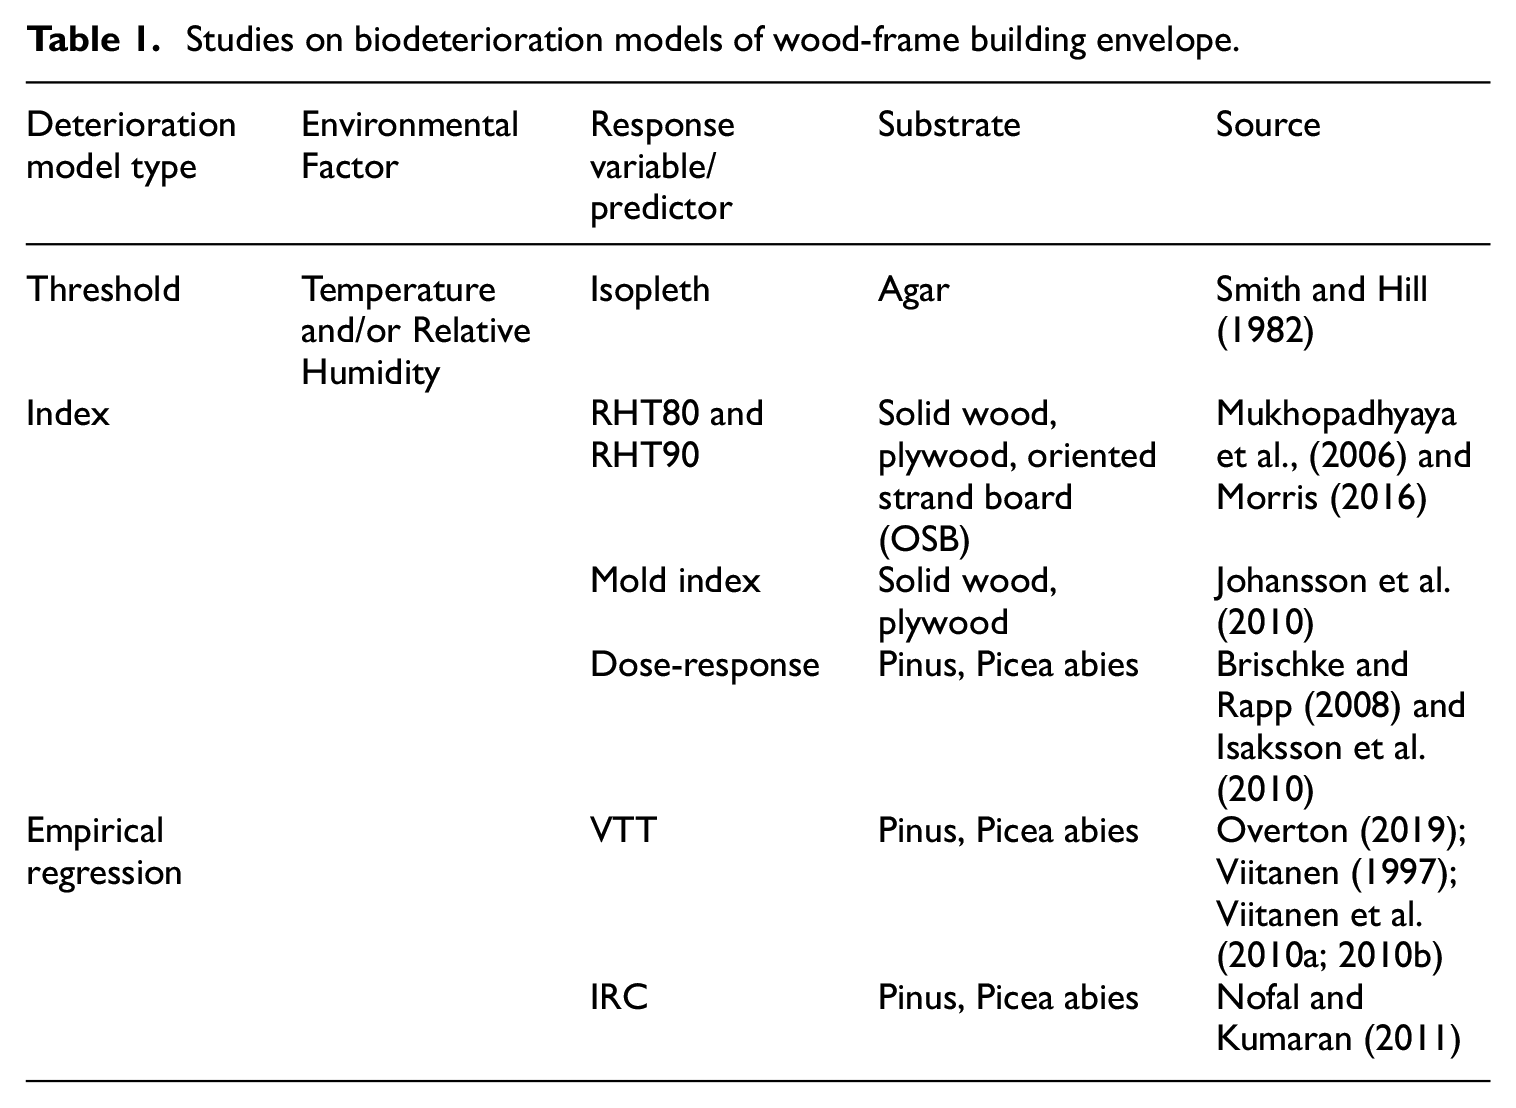
This is in particular what motivates the use of the composite moisture response indicator, RHT, which is derived from relative humidity and temperature data over a time period. The RHT Index (Kumaran et al., 2003; Mukhopadhyaya, 2003; Mukhopadhyaya et al., 2002) is used to quantify and compare the localized hygrothermal response of a part of the wall component (i.e. “region of interest” [ROI]). The ROI is a cross-section of the part of the wall where the hygrothermal response is the most severe and critical for the long-term moisture performance of the wall assembly. The accumulated relative humidity (RH) and temperature (T) at different time steps are the response variables required to obtain the RHT index, as shown in Figure 2. As such, information about how much and how long the moisture accumulated within the component can be acquired.
RHT index.
The generic definition of the RHT index at the “region of focus” is given as the cumulative RHT by the following expression:
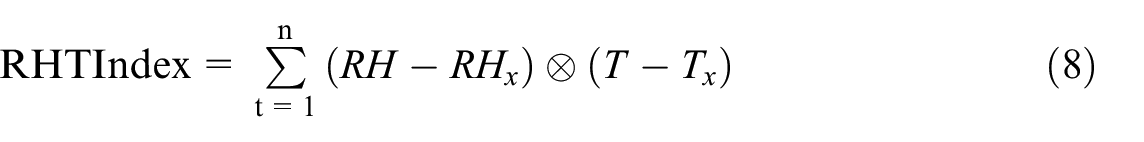
where RH = relative humidity on ROI (%); RH x = threshold RH (%); T = temperature on ROI (°C); T x = threshold temperature (°C); t = time step or interval when RH and T values are recorded. During any time step when either or both RH ≤ RH X and T ≤ T X , the RHT value for that time step is zero.
Materials and methods
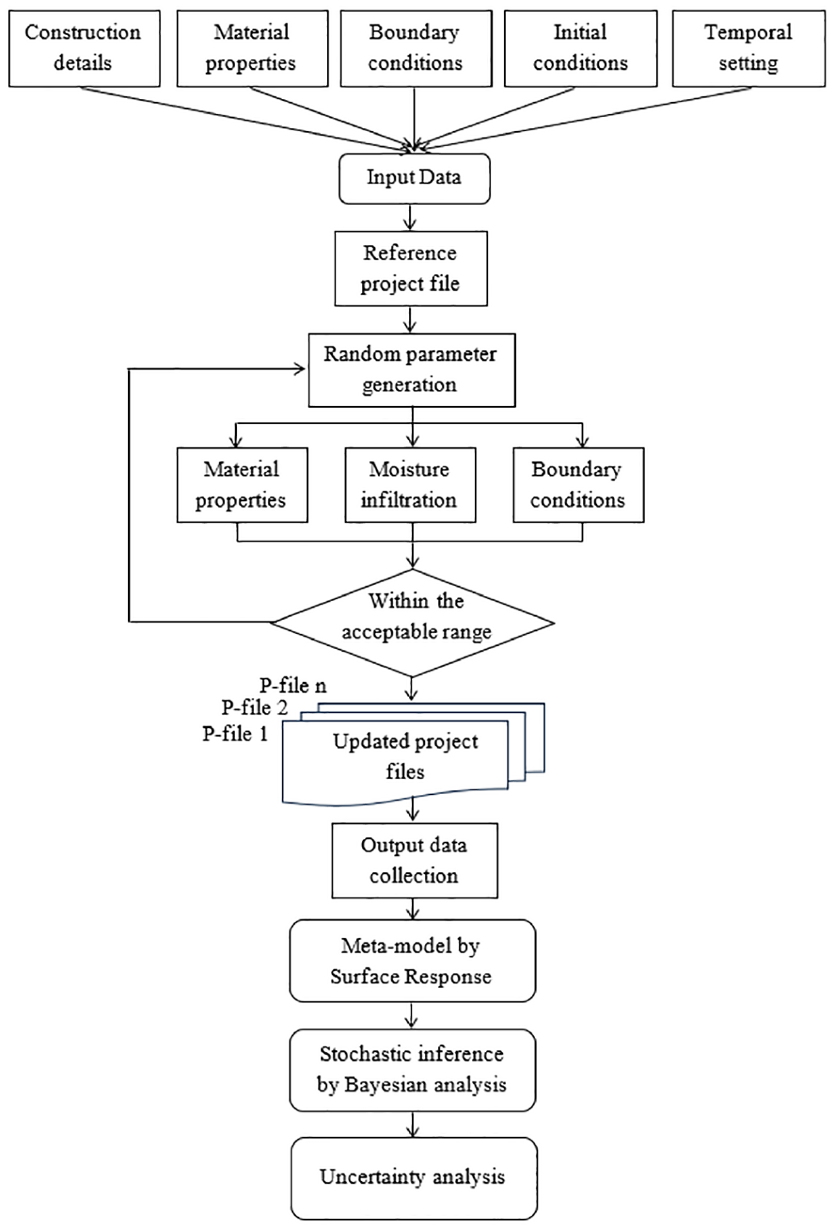
The methodology used to assess the hygrothermal risk of wood-frame exterior wall assemblies is presented in the scheme depicted in Figure 3. The methodology consists of three main parts as indicated by the dashed-line boxes: input data and qualitative analysis; simulation model; and probabilistic analysis. The first part consists of data collection and the identification of affecting factors, along with the causal relationships between them. Data from literature and field experience are collected as inputs for simulation. The outputs of hygrothermal simulations are assessed subsequently to observe the influence of input variables on the response variable and whether it is in the reasonable range of the design criteria. This process is performed iteratively to refine our prior belief and minimize the uncertainty. Using output from simulation stage, the RSM analysis is performed to build the meta model, and continued with probabilistic inference through Bayesian analysis. The outputs resulted from this procedure provides comparative risk probabilities to be used in the decision process. In this study, the output of the probabilistic model is presented in the form of cumulative distribution functions. These outputs communicate the risk from the assessed assembly options, and hence support achieving an optimal moisture performance. The following sections explain in more detail the methodology being applied in each part of the risk assessment framework.
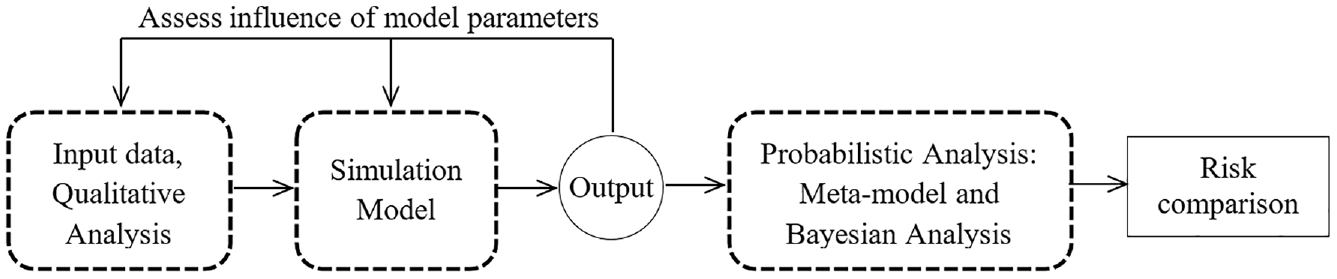
Methodology of risk assessment.
Input data and qualitative analysis
Qualitative analysis
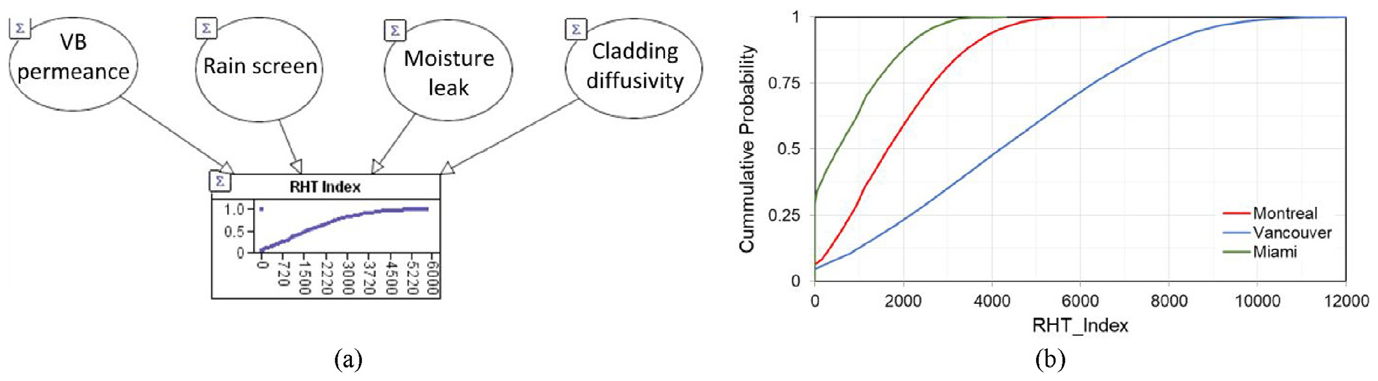
This step determines the relevant variables being considered in the study, including the physical processes associated with each variable affecting moisture response of an assembly are analyzed. In Pallin (2012), the variables responsible for the hygrothermal behavior were previously examined with a specific purpose of the effect of layer properties on the energy performance. Based on the study, important processes in moisture problems are driven by two mechanisms: wind-driven rain and undercooling. Pallin (2012) indicates that vapor barrier properties, the rain screen, moisture leakage due to vapor infiltration, and diffusivity of the cladding material are highly significant for moisture diffusion, liquid water intake, and undercooling processes. Accordingly, the following input variables are investigated in this study: vapor barrier permeance; use of rain screen layer; presence of moisture leakage; and cladding material diffusivity.
A causal diagram is a useful tool for displaying qualitatively the relationships between variables that affect the risk under study (Ackermann and Alexander, 2016). Figure 4 presents the causal map implemented in this study. It resembles the influence diagram in BN approach and hence is used in the BN analysis. From the graph, the consequence of the physical process is the mold growth owing to moisture accumulation. The coexistence of substrates, suitable temperature (T), and relative humidity (RH) levels are the mechanisms that cause this event. Depending on the drying capacity and the amount of moisture intake, humidity, and temperature favorable for mold growth, the accumulated moisture dynamically changes over time. Considering the two primary mechanisms that can contribute to RH and T are undercooling and water infiltration, both of which are linked to the driving forces listed at the parent nodes of causal diagram. In this case, the RHT index (Mukhopadhyaya, 2003) is deemed to be suitable to be selected as a predictor of the model which represent mold growth risk due to moisture accumulation (Figure 4).
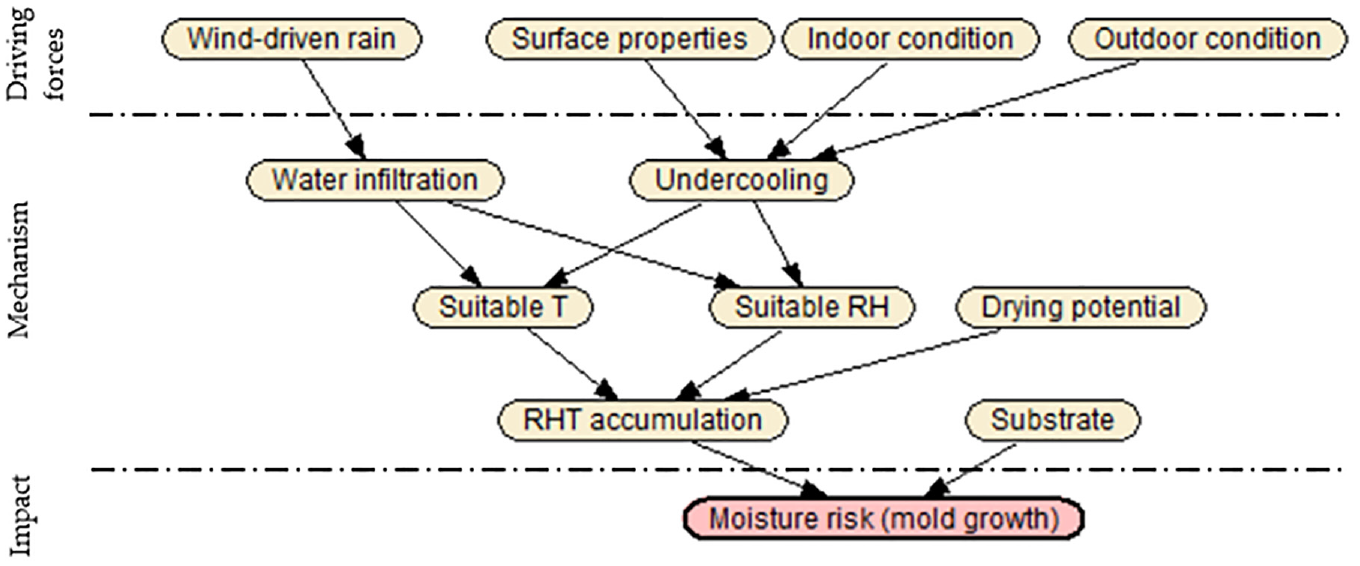
Causal diagram for moisture risk adopted in this study.
Data collection
The model presented in this section is an extension of previous work by Ryan and Bristow (2024). We implemented data from the study for probabilistic analysis in this paper. The following parts describe in more detail data used in the modeling process.
Wall construction details and material properties
Basic wall construction details of this study are shown in Figure 5. Brick veneer and regular stucco are the two cladding types applied in the model. The configurations of the wood-frame structure are based on the reference model in Lstiburek (2002). The initial moisture content of each wall component was assumed to be equivalent to the assigned typical built-in moisture, corresponding to the water content in the component derived from the database of the respective materials (Fraunhofer IBP, 2022). Likewise, the initial temperature across the entire cross-section of the wall was assumed to be equal to the built-in temperature at 20°C. A total exposure duration of 3 years (2022–2025) was used for the simulation. The exposure duration for each year began on October 1st and ended on September 30th. This duration is deemed to be sufficient considering cyclic pattern of the moisture transport and accumulation during wetting and drying seasons (Mukhopadhyaya et al., 2006).
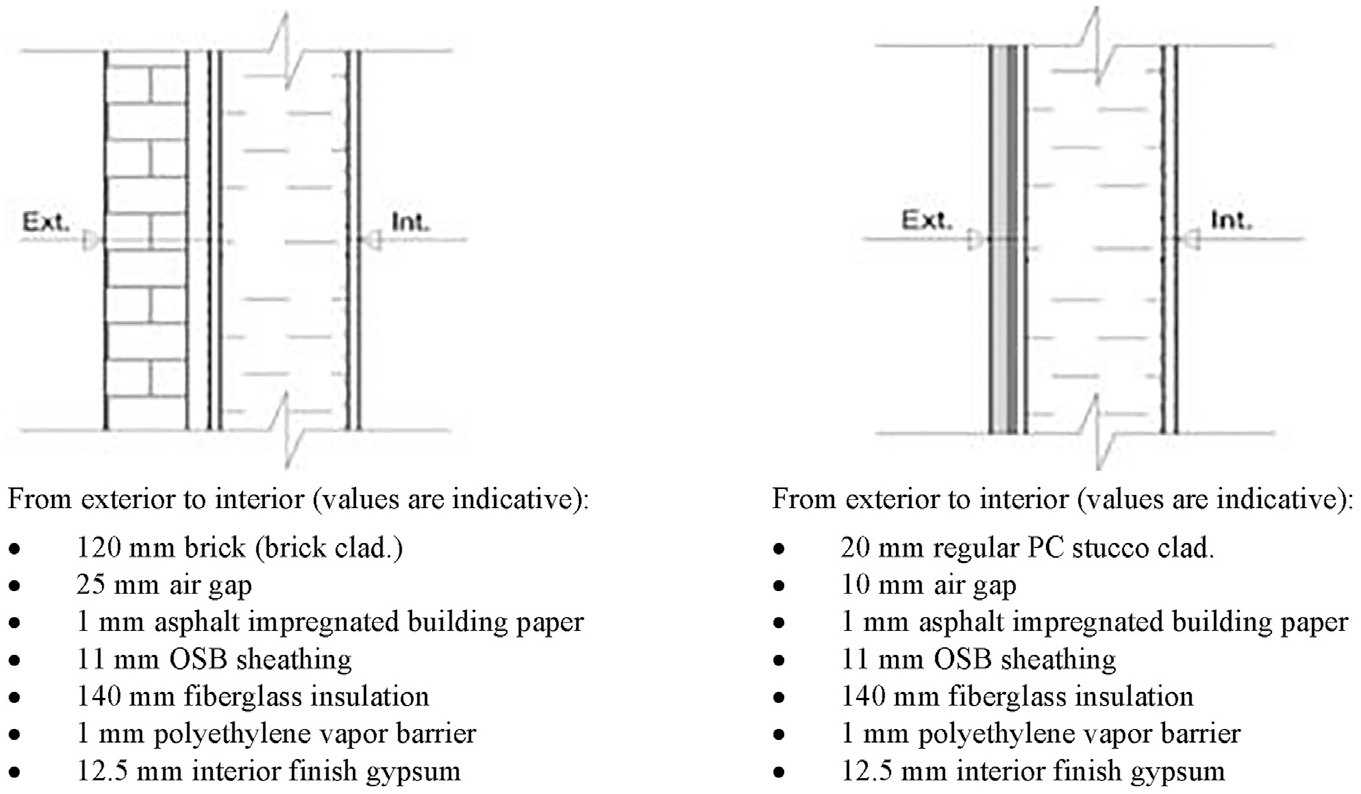
Basic wall construction details.
Geographical location
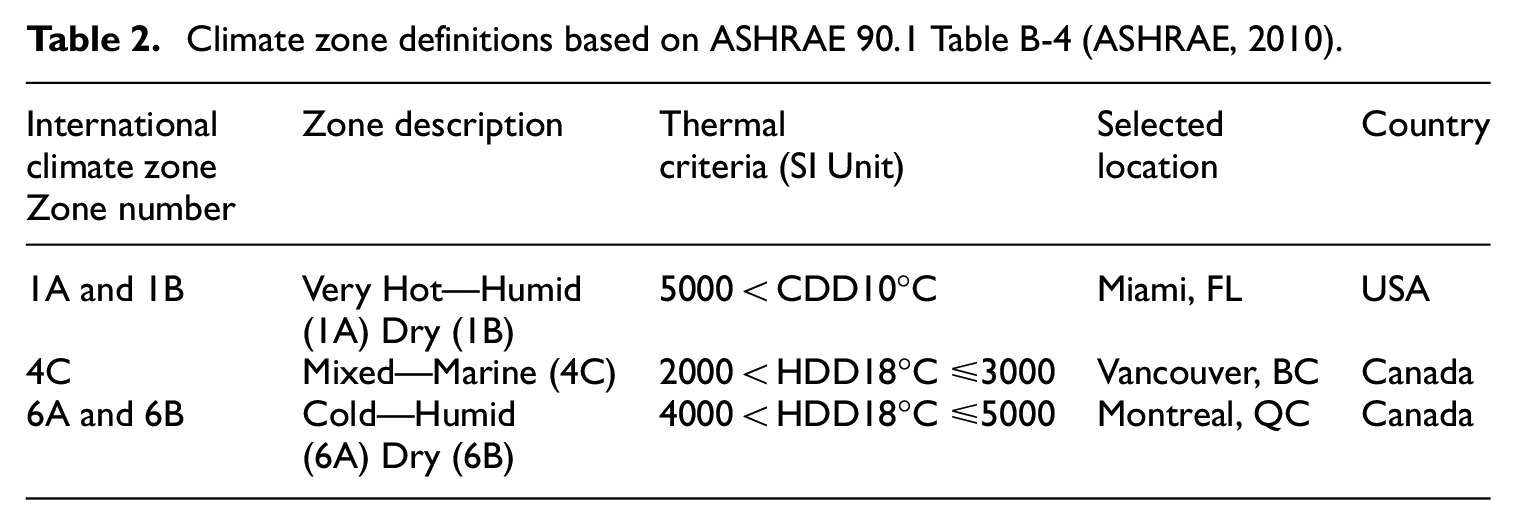
Durability of building enclosures is influenced by a variety of factors, including material properties and their complex interaction with heat, air, and moisture flows (Lepage et al., 2019). This interplay is mainly influenced by weather conditions where the assemblies are located. In the context of climate change, adaptation, and sustainability, the National Building Code (NBC) Canada has already taken into consideration climate resiliency for design of new buildings and assessment of the existing ones. For example, the guidelines in NBC are arranged according to climate zones, with more strict guidelines recommended in areas with higher climate pressure in a given location. In relation to this, the ASHRAE climate zones were adopted by the National Energy Code for Buildings (NECB). In this work, three cities in North America are selected according to their differing climate characteristics. Miami, Vancouver, and Montreal are selected to represent major classifications in ASHRAE 90-1 climate zone (ASHRAE, 2010): very hot humid; mixed marine; and cold humid, respectively (see Table 2).
Climate zone definitions based on ASHRAE 90.1 Table B-4 (ASHRAE, 2010).
In addition, we anticipate that climate change and its effects on climatic loads—such as humidity, precipitation, and temperature—will alter the rate of deterioration and durability of building components. As such, the effect of non-stationary climatic condition should be taken into account (Ryan and Bristow, 2024). To deal with climate change and climate variability, the NRC in partnership with Environment and Climate Change Canada is updating weather data used in the NBC. The use of future climate projections is necessary in understanding the impact on deterioration potential to building enclosures in the future. This is one of the objectives of our future research.
Simulation model
The simulations were performed using WUFI® Pro V6.6, a coupled heat, air, and moisture transient hygrothermal simulation program. Transient hygrothermal simulations mainly serve two purposes: first, to perform preliminary design analysis of the proposed envelopes; and second, to investigate in detail the hygrothermal behavior of existing building envelopes. In this study, the first purpose is achieved through the use of meta-models that define the relationship between explanatory variables and response variable in the physical process of moisture transport mechanism.
Based on the qualitative analysis described in section “Input data and qualitative analysis”’, simulations were performed by varying four major variables of the wall assembly properties, that is, vapor barrier, rain screen, moisture leakage, and exterior cladding properties. For each variable, a set of parameter values was assigned with refer to the literature. A total of 144 simulation points were conducted at this stage. Table 3 shows parametric variations for the model simulations.
Parametric variations considered in this study (for Quebec location).
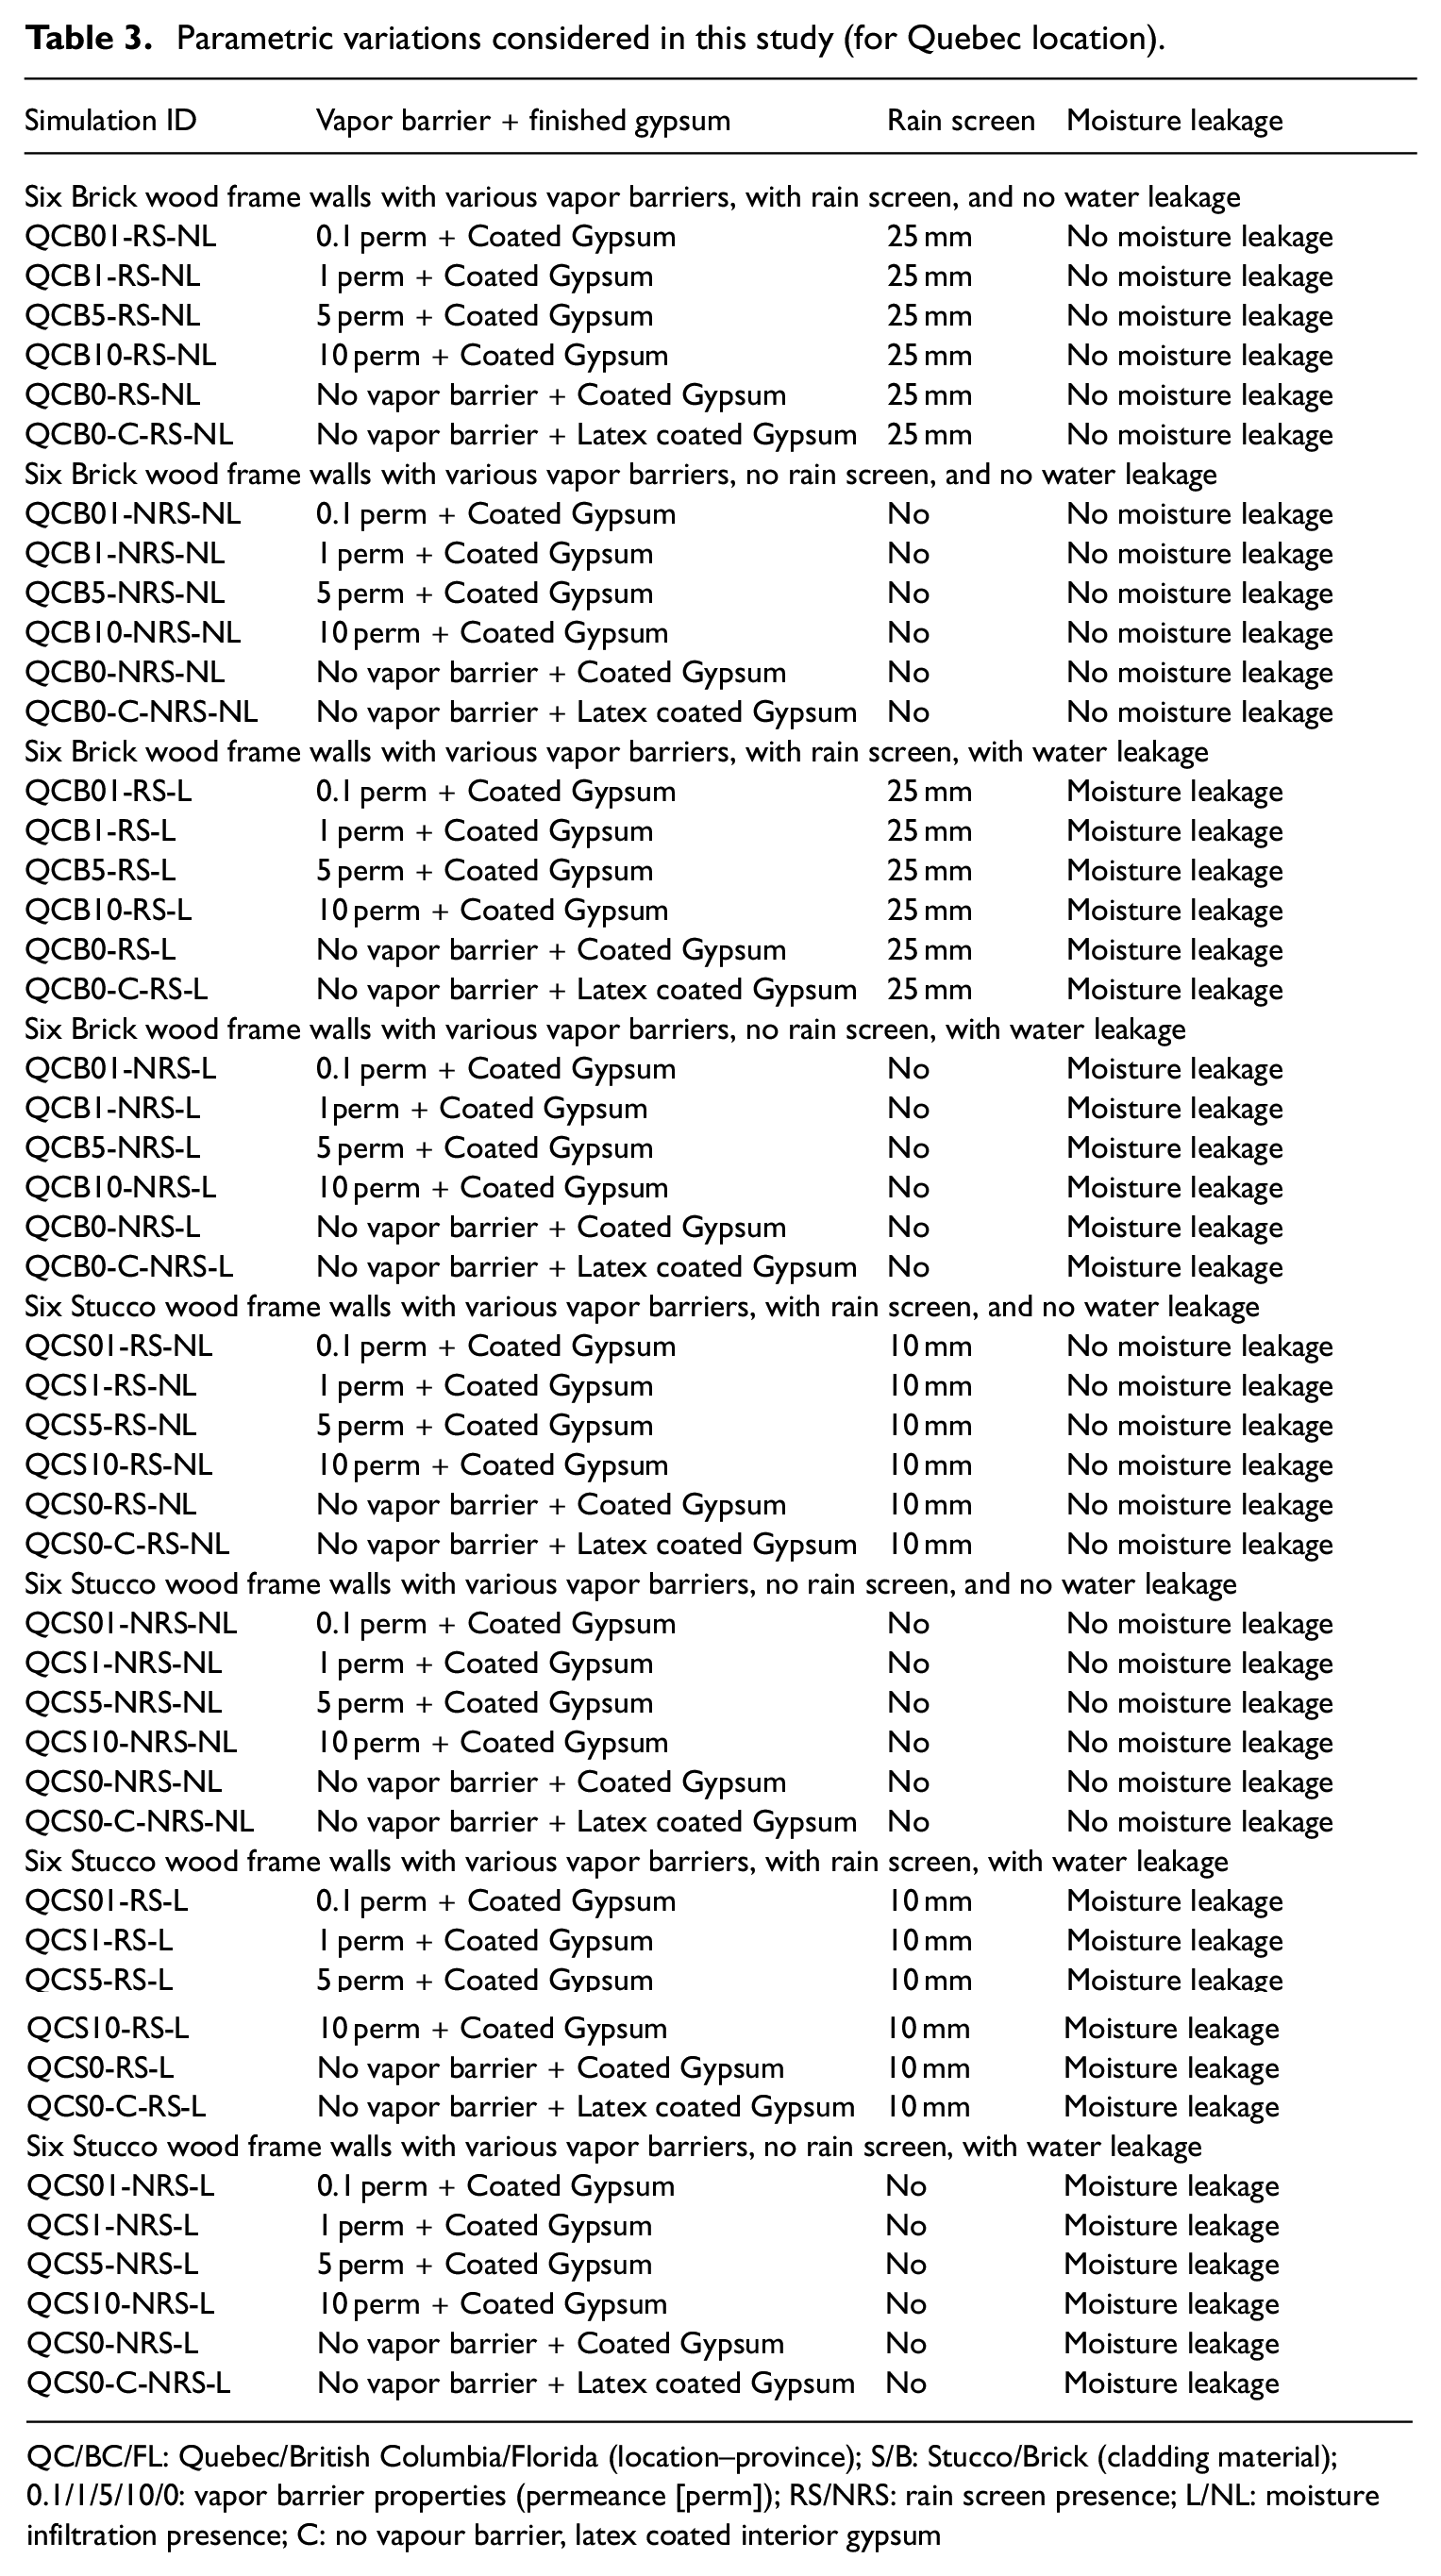
QC/BC/FL: Quebec/British Columbia/Florida (location–province); S/B: Stucco/Brick (cladding material); 0.1/1/5/10/0: vapor barrier properties (permeance [perm]); RS/NRS: rain screen presence; L/NL: moisture infiltration presence; C: no vapour barrier, latex coated interior gypsum
Meta model and probabilistic analysis
Given the uncertain nature of the data variability and randomness, a probabilistic risk assessment is performed. In this section, the Response Surface methodology (RSM) is adopted to create the meta-models and Bayesian analysis to perform stochastic inference. The methodology steps can be found in Figure 6.
Flow chart of the probabilistic analysis part presented in Figure 3.
Theoretical models that relate certain variables to a response are frequently either unavailable or extremely complex. In this instance, empirical methods could be used to gather data regarding the relationship between the factors and the response (Sarabia and Ortiz, 2009). The Response surface methodology (RSM) is a statistical technique that includes optimization procedures to analyze factorial variables in an experimental problem by empirical models. The method performs an analysis of variance (ANOVA) and factorial technique to model the response. Three-dimensional response surface is generated for observing the response variable at its optimal level. Stat-Ease360 (Stat-Ease, 2023) was used to perform the computation and subsequent regression analysis to determine the parameters that provided the best fit. A three-level full-factorial design was used for this purpose. A full factorial design was adopted due to its simplicity in statistically filtering out the significant parameters and interactions between parameters. The results from the parametric study are followed by subsequent analyses that investigate the characteristics of these parameters. This analysis allows for study of the effect of each factor in a model as well as the effects of interactions between factors in a model on the response variable.
Utilizing the results from full factorial design, the interaction between the variables considered in the model could be defined, including the vapor barrier permeance, rain screen gap, moisture leakage, cladding material diffusion resistance factor, and their impact on the response variable, that is, the RHT index. With four independent variables and three levels, experimental points were specified for the RSM analysis.
Multiple regressions utilizing the least-squares regression methodology were used to analyze the results from the full factorial design to fit the following second-order equations:
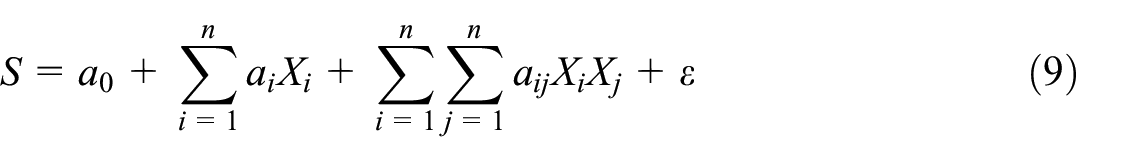
where S represents the response variable; a 0 , a i , and a ij are regression coefficients; and X i and X j are independent variables.
The meta-models were then fed as conditional probability functions into the Bayesian model to propagate the stochastic inference of the response variable. As such, the meta-model is used to generalize a large number of required simulations, reducing the amount of time needed for the entire study. In this case, the BN is able to capture causal relations between nodes, thus handling dependencies between the components of a large system and allowing scenario analysis. Additionally, different types of data can be used in the inference process. Detailed steps of the probabilistic process are shown in the flow chart depicted in Figure 6.
Results and discussion
Simulation model
To quantify the risk of mold growth from moisture accumulation, the RHT90 index (Mukhopadhyaya et al., 2006) is used. With regard to the deposition of moisture on the surface of the region of interest, the RHT index corresponds to the undercooling and moisture infiltration mechanism (Figure 4). This transient metric is able to quantify cumulative of hourly RH and T above the specified threshold, and hence giving a sense of “how much” and “how long” moisture accumulated within the envelope. In this study, equation (8) uses threshold values of RH X = 90% and T X = 0°C, and a time interval of one hour. The threshold values were selected based on recommendation from the International Energy Agency (IEA), considered as a critical threshold for mold onset (ASHRAE, 2021). The region of interest is the sheathing board facing the stud cavity. For simulation details, see Ryan and Bristow (2024).
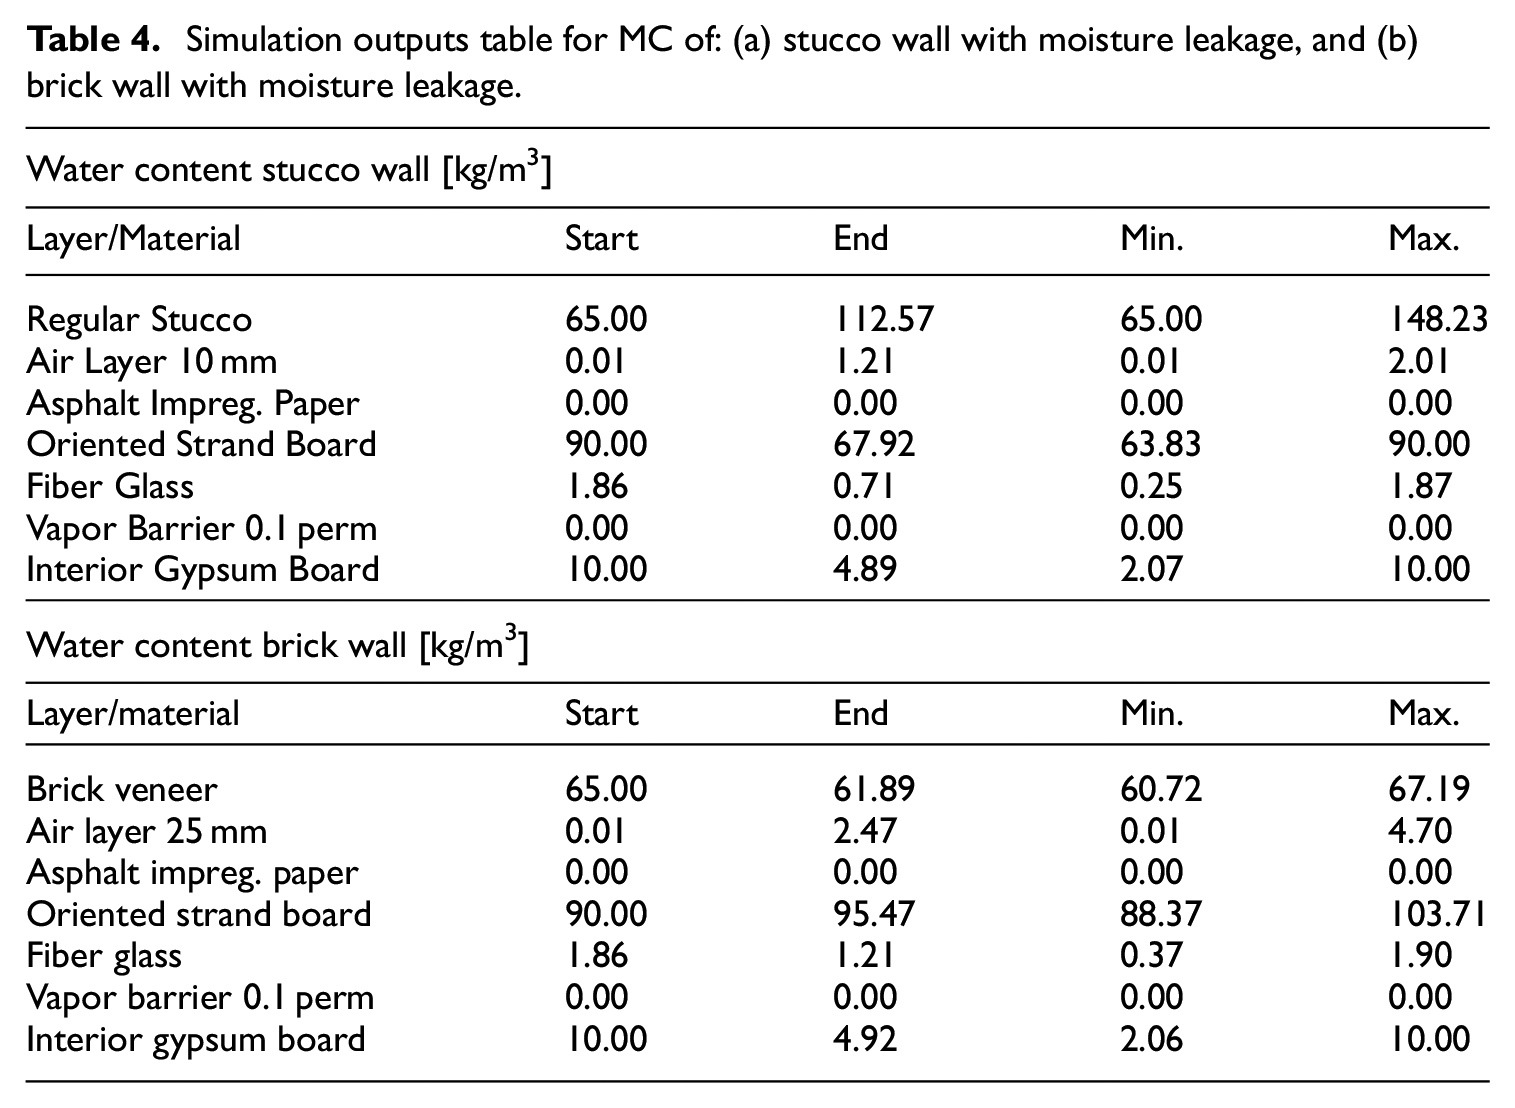
Figure 7 shows the example of temperature (°C), relative humidity (%), and moisture content (kg/m3) on each wall layer at a time point. The instantaneous response shown in Figure 7 would make it difficult for decision makers to evaluate the mold onset potential, especially if the number of envelope solutions being assessed is large and diverse. Table 4 shows the moisture content for each layer at the beginning and end of the analysis period. As shown in the table, the sheathing OSB board is the internal layer of the wall assembly with the highest moisture load. This observation underlies the selection of sheathing board facing the stud cavity as the measured layer (ROI) where severe moisture responses occur.
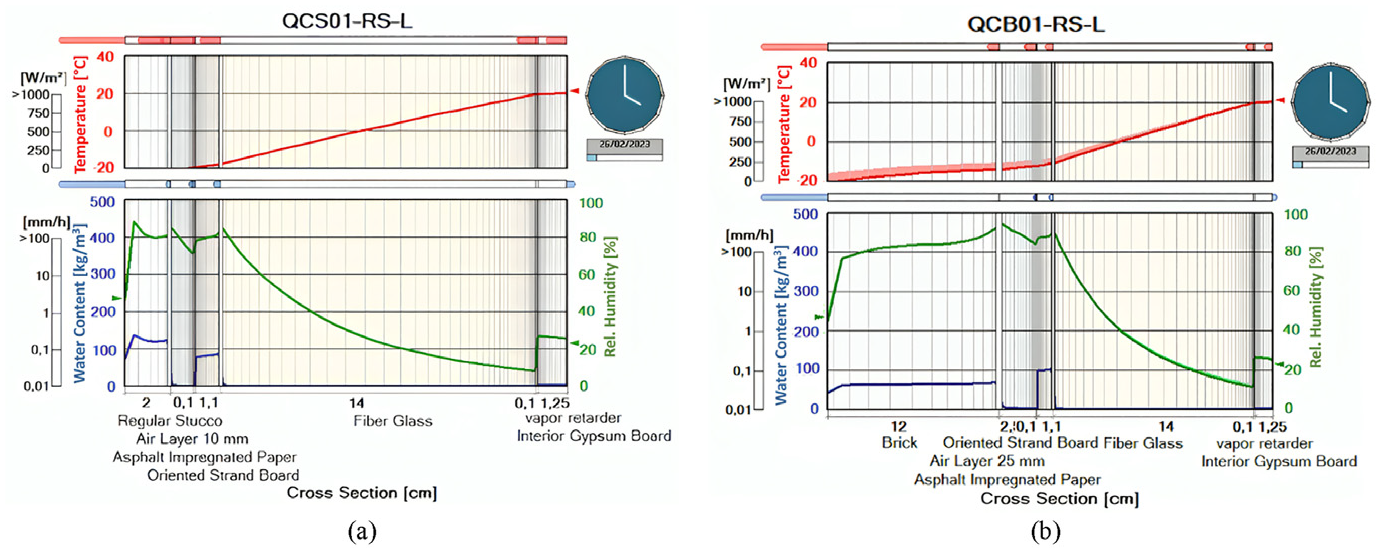
Simulation outputs—graph of T, RH, and MC across wall cross-section at a time point (heating season): (a) stucco wall with moisture leakage, and (b) brick wall with moisture leakage.
Simulation outputs table for MC of: (a) stucco wall with moisture leakage, and (b) brick wall with moisture leakage.
Meta-model using design experiments
The Response Surface Methodology (RSM) is used in this study to build the meta models. The method would find the parameters that provide the best fit using certain design approach. Several design approaches are available for this purpose, with the most prevalent being the full factorial design, the central composite design, and Box Behnken design. This study employed full factorial design to investigate comprehensively the relational effect of the independent variables on moisture response (i.e. the RHT index). The vapor permeance (X1), rain screen gap (X2), moisture leakage (X3), and cladding diffusivity (X4) were computed as independent variables to determine the most optimum response variable.
The outcomes derived from the RSM experimental design are assessed through multiple regressions, employing the least squares regression technique. This was utilized to model second-order equations for all dependent variables as per equation (9). Among the linear, polynomial, and quadratic model, the reduced 2FI (two factor interaction) model was found to be significant based on the F-value, Akaike Information Criterion (AIC), and Bayesian Information Criterion (BIC) as the metrics that measure the trade-off between the goodness of fit and the number of variables included in the model. The regression of variable coefficients from the analysis are shown in Table 5. Figure 8 presents the goodness of fit of the models.
Variable coefficient regression for the three ASHRAE climate zones.
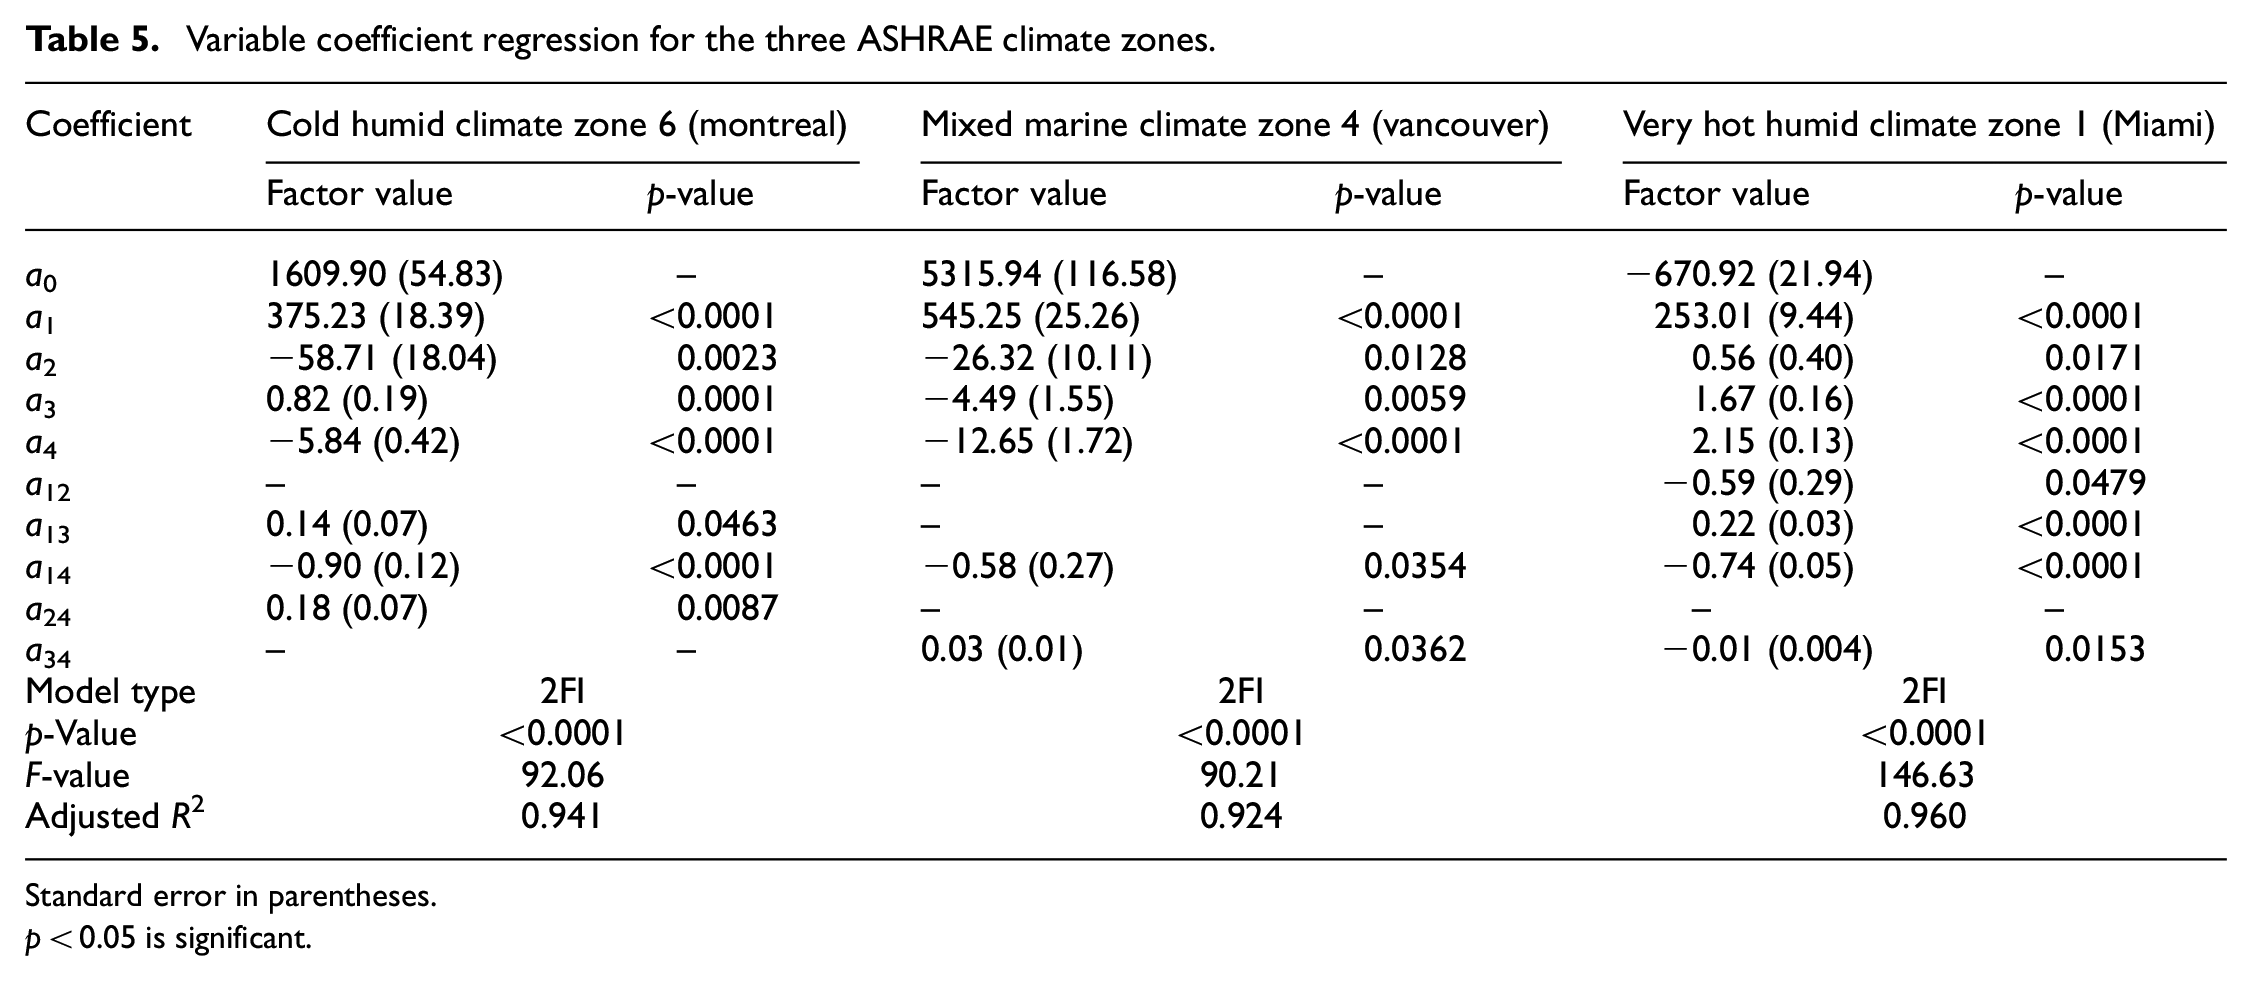
Standard error in parentheses.
p < 0.05 is significant.
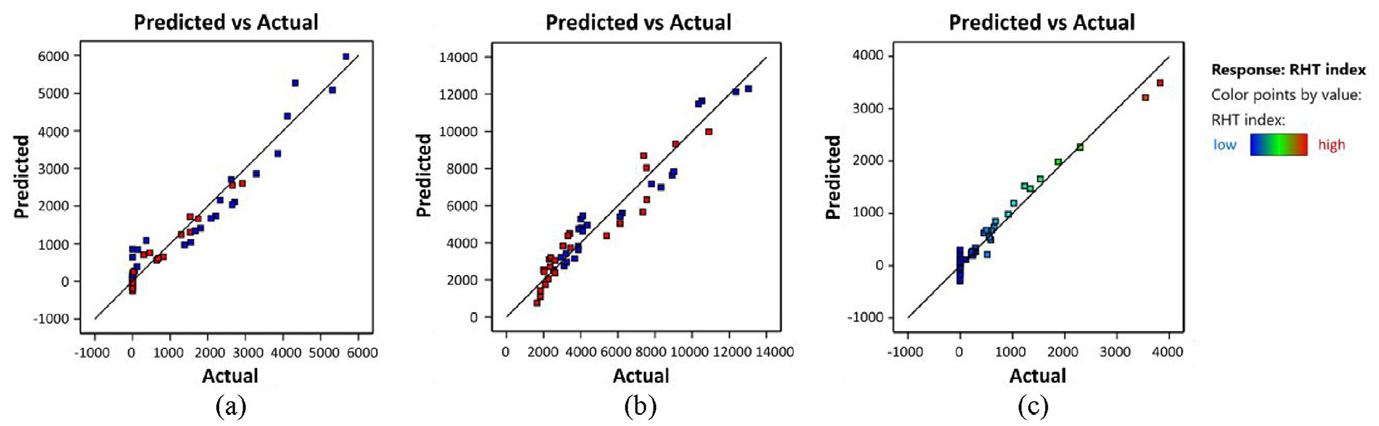
Correlation between predicted with the meta-model and results of the simulation for RHT index for (a) ASHRAE Climate Zone 6 (Montreal); (b) ASHRAE Climate Zone 4 (Vancouver); and (c) AHSRAE Climate Zone 1 (Miami).
This study divides the meta-model based on ASHRAE climate zones of Zone 1, Zone 4, and Zone 6 (see Table 2), represented respectively by the city of Miami, Vancouver, and Montreal. The findings showed that all model regression coefficients are significant with F-value > F-crit and p-value <0.005. The reliability of the methodology heavily relies on the inclusion of data with good quality. A thorough comprehension of the statistical distributions of input parameters and the acceptability of risk criteria would enhance the applicability of the method, making it more accessible at the designer level and providing resources for optimizing solutions.
In the development of the meta-model there exists some limitations, mainly related to the limited data for specific locations. As such, the case study presented in this paper is intended to demonstrate the implementation of the proposed method for risk assessment purposes of building envelopes based on the reference model. Hence, focus of this analysis is given limitedly to the effect of the four independent variables on the moisture response. Extended study with more data and scenarios is suggested.
Stochastic inference using Bayesian analysis
Using the causal map shown in Figure 4 and outputs from the meta-models, Bayesian analysis was performed to quantify probability of occurrence of different values of the RHT. Only variables considered in the meta-model were incorporated into the BN model, which included variables X 1 to X 4 as parent nodes and the variable RHT index as child node (also target node). The conditional probability distribution of a child node is computed based on the regression model given by the previous analysis, and the quantification of the priors was performed with Monte Carlo random sampling. Uniform distributions were considered for all stochastic variables where all options fall within the parameter range with equal weight. To obtain more accurate distributions, the estimated value of each parameter can be updated using new information or evidence. For example, Wang et al. (2021) suggest Gaussian distribution for certain variables, such as moisture leakage source and water absorption coefficient of cladding material.
The purpose of the sampling procedure is to enable the observation of a dependent variables’ performance based on the behavior of independent variables that include uncertainty. Special discussion about uncertainty is presented in Section “Uncertainty Analysis”. The fundamentals of Monte Carlo simulations involve generating random values independently, in accordance with a specified probability distribution. The Markov Chain Monte Carlo (MCMC) sampling technique was used in the randomization process. Using this technique, the predicted variables are generated to approximate the cumulative frequency of the quantity of interest. For each Monte Carlo run, samples with 1000 iterations of the relevant parameters were performed.
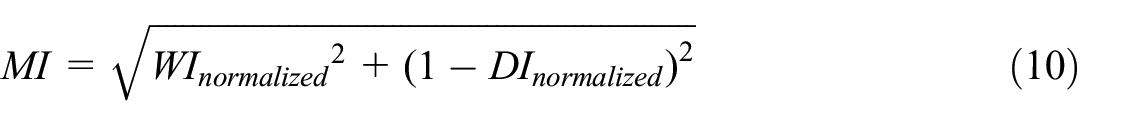
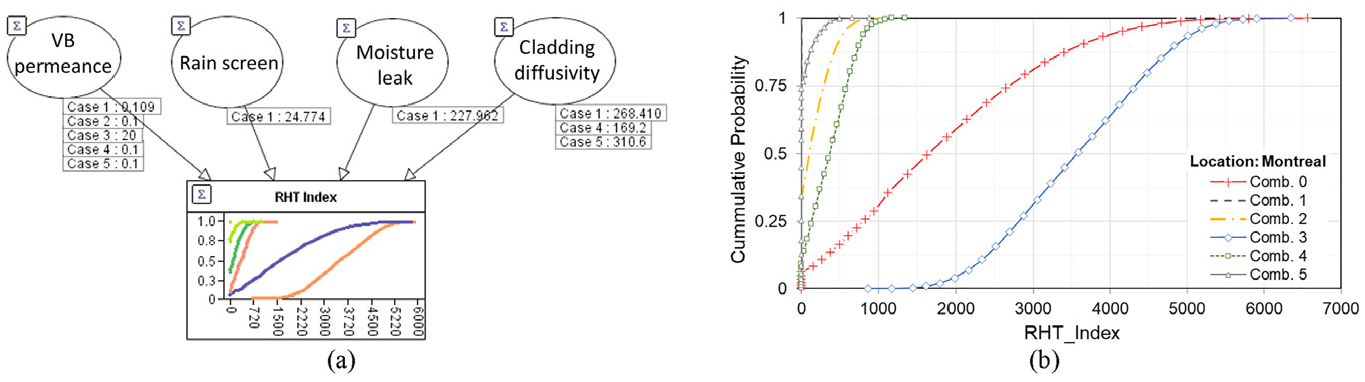
Figure 9(a) shows the BN model for the analysis. Using the junction tree algorithm, the BN allows for the arithmetic operation of a continuous variable, resulting in an inference of continuous variable in the target node. The cumulative distribution of moisture risk at different locations is shown in Figure 9(b).
(a) BN model inference for moisture risk assessment; (b) Cumulative frequency of RHT for models in different locations: Montreal, Vancouver, and Miami.
Located in southeastern Canada, Montreal is classified as a humid continental climate based on the Köppen classification. Its climate is characterized by warm humid summers and cold winters. Vancouver is a coastal city located in the southwest corner of Canada. It has a moderate oceanic mixed climate based on the Köppen classification and is characterized as one of the warmest cities in Canada. The climate of Miami is categorized as tropical monsoon, with long, warm summers, hot, and muggy winters. Their geographical features and current climate data are shown in Table 6. Here, the moisture index (MI) characterizes moisture load of any geographic location. This index is derived from wetting potential (WI) and drying potential (DI), where DI is based on probable yearly evaporation and WI is based on annual rainfall, defined through the following equation (Cornick et al., 2002):
Annual climate averages of Montreal, Vancouver, and Miami (Meteonorm, 2023).
Lat: latitude; Lon: longitude; H: elevation; T: temperature; RH: relative humidity; MI: moisture index; Rain: precipitation; Wind: wind speed.
The results shown in Figure 9(b) are in line with those expected in relation to the moisture load in the respective region. The higher the RHT, the greater the moisture risk. Vancouver has the highest moisture risk, corresponding to its climate conditions. This pattern is likewise reported by Defo and Lacasse (2021) which use the mold growth index as the predictor. The mold growth index is high in all climate change scenarios compared to the other cities in Canada. Experiences have shown that moisture problems and related building envelope deterioration are more likely to be found in wood-frame wall construction in British Columbia. In 1998, the Commission of Inquiry of the Government of the Province of British Columbia conducted an inquiry into the quality of the condominium construction in BC. As part of dispute resolution, the appointed Commission reviewed the adequacy of protection and accountability for faulty condominium construction and determined the factors contributing to faulty construction, in which moisture problems, such as mold growth in building envelopes, were of major concern (Barrett, 1998). Thus, the finding confirms the high moisture load in Vancouver.
Miami, on the other hand, shows the lowest moisture load in the studied exterior walls. Despite having relatively high Moisture Index (MI = 1.08) similar to Vancouver (MI = 1.09), the moisture response in Miami shows considerably low RHT index in the cumulative frequency graph. Ryan and Bristow (2024) discussed this behavior and pointed to the smaller fluctuations in exterior RH and T as the favorable factor in drying capacity of the exterior walls. This finding of nonlinear relationship between RHT and MI might be a consideration in the adoption of MI in design standards for buildings in Canada (Jeong and Cannon, 2020).
In Montreal, moisture risk lies in between the risks in Vancouver and Miami. Montreal is located in the Atlantic coast of Canada, benefitting from the influence of continental climate. It is characterized by strong seasonality with relatively short warm and humid summers. The results highlight the need to carefully selected the predictor in the assessment of long-term moisture response of building envelopes.
Considering the aim of the proposed method as a tool for comparative risk assessment, the probabilistic model is applied to a set of combination scenarios. While dealing with data scarcity during this exploratory phase of the work, the Bayesian approach can enable the application of updating to prior distribution and scenario analysis in the long run. The combinations or what-if analyses for Bayesian inference is presented in Table 7 with the following scheme:
Combination 0 is set as the baseline, where data were fed from the meta-model phase,
Combination 1 is the most optimum value for each parameter provided by backward inference propagation,
For each combination, an inference propagation generates a probability distribution for the values of the response variable,
Each combination has a wall configuration designated at a particular city with defined range of parameters for the variation of each stochastic variable.
Parameter combinations for Bayesian inference.
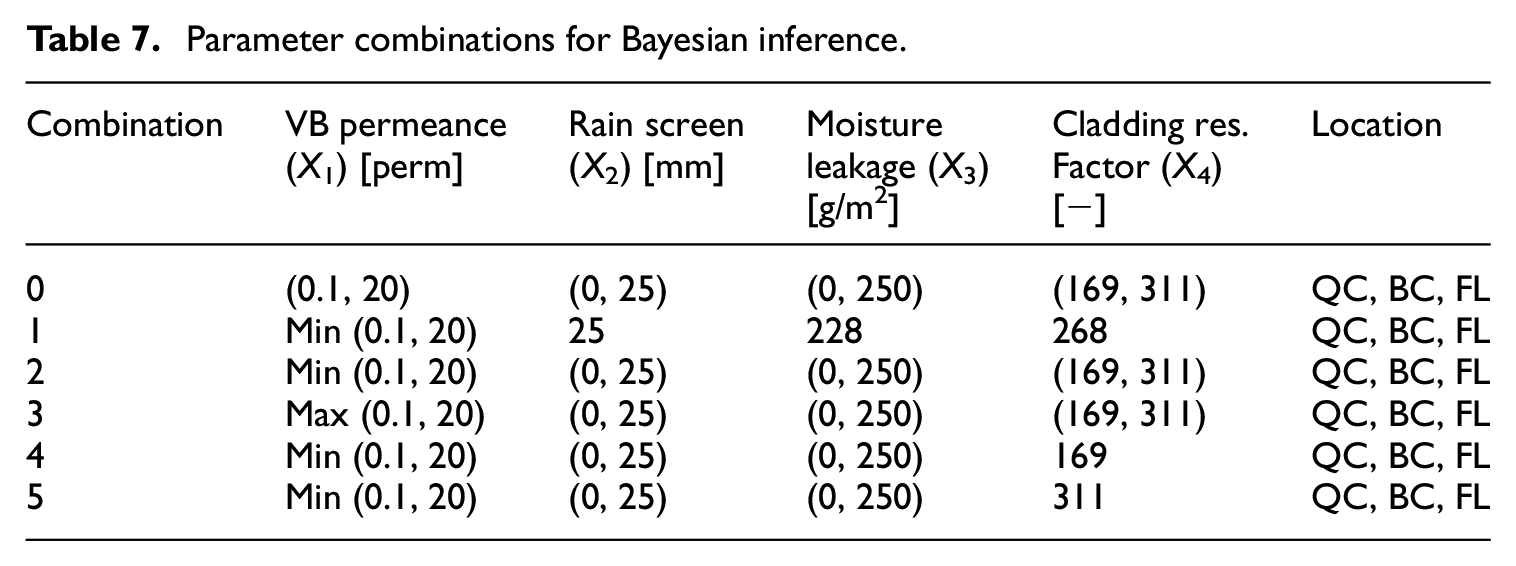
Figure 10(a) shows the Bayesian model for the combination scenario implementation of wall assemblies. The corresponding cumulative distributions are shown in Figure 10(b). The same analysis was performed for models in Vancouver and Miami (Figure 11).
(a) Bayesian inference model for combination 0–5; (b) cumulative frequency for combination 0–5 location Montreal.
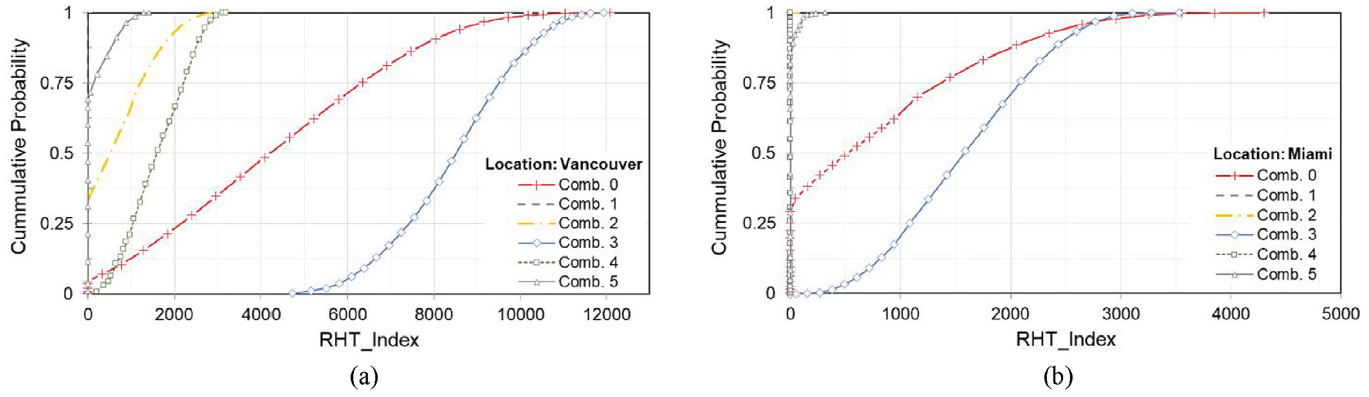
Cumulative frequency for scenarios 0–5: (a) location Vancouver; (b) location Miami.
Figure 10 and 11 show the cumulative distributions for combination 0–5. Combination 0 is from the meta-model, which is our prior belief. Taking the advantage of Bayesian analysis, we update the priors with hard evidence presented in Table 7, denoted as Comb. 1 to 5. Combination 3 exhibits the worst moisture risk, given the highest RHT probability for all climate zones. Meanwhile the most optimal combination is shown by combination 1, giving zero RHT for all climate zones.
For all locations, the walls with high vapor barrier (VB) permeance (i.e. 20 perm) displayed a noticeably higher occurrence probability of the relevant RHT value than that of the other combinations, indicating an increased moisture risk. The same conclusion can be drawn for walls with a low diffusion resistance factor of the cladding. However, the effect was not as strong as that in the VB cases. In summary, walls with combined low permeance of the VB and high diffusion resistance of cladding displayed the most optimum moisture response. With regard to the location, the results in Miami show less sensitivity to material property variations, except for the model with a high permeance of 20 perm.
The overall trend for the performance of different configurations is in agreement with the results of experimental tests presented in Hutcheon (1989). However, the study by Hutcheon (1989) focused only on the effect of the vapor barrier. From Figures 10 and 11, the cumulative distributions show a high correlation between VB permeance and diffusion resistance of the cladding. Nonetheless, it is expected that the effect of interaction decreases in region where RH and T amplitude variability is low, such as in Miami.
In addition, BN modeling allows for sensitivity analysis of the involved variables. The result of sensitivity analysis of the proposed BN model is shown in Figure 12. The impact of the other parameters on the result of the target node can be determined by setting the expected value of the target node. From the figure of the tornado graph, it is clear that vapor barrier permeance and cladding diffusion properties are the most influencing parameters to the target node, that is, RHT index. This result could be helpful to guide future research to focus on variables that have important impact to the quantity of interest. Moreover, the result in the BN sensitivity analysis corresponds to the result from the study conducted by Mukhopadhyaya et al. (2006).
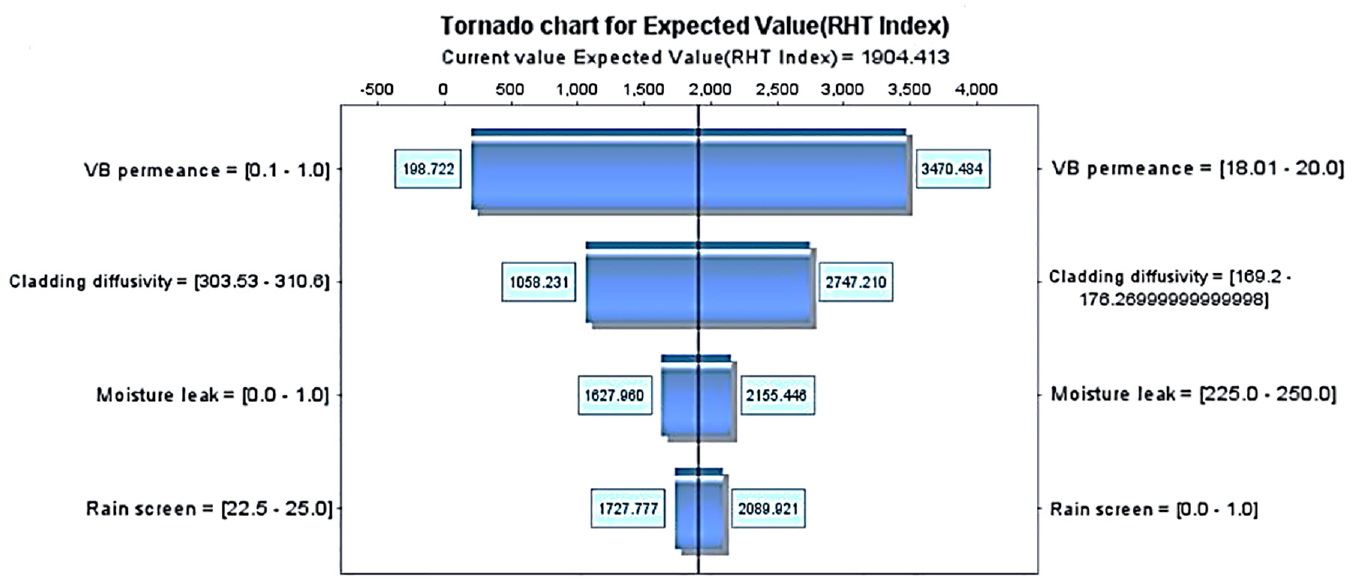
Sensitivity analysis of BN model.
Uncertainty analysis
In risk assessment for decision-making, the use of probability (stochastic) approaches, either precise or bounded probability, is useful in indicating uncertainty in the quantity of interest, and hence enhances transparency in the assessment process (Raices Cruz et al., 2022). Information about uncertainty is necessary given the limitations in knowledge and the models that represent a real system, whether it is due to data scarcity or lack of information in expert judgment (Viseh and Bristow, 2023). As a result, scientific risk assessment should always include uncertainty. Depending on the model used, the sources and magnitude of uncertainty may vary.
This section aims to characterize the uncertainty presented in the assessment, including aleatory (i.e. inherent randomness, heterogeneity, or variability) and epistemic uncertainty (i.e. limitations of knowledge), and to evaluate the combined uncertainty on the quantities of interest to support the conclusion of the assessment. The use of Bayesian analysis for quantifying uncertainty is extensively discussed in Raices Cruz et al. (2022), and its method is adopted in this paper.
In a Bayesian approach, a prior refers to a probability distribution, determined by expert judgment or scarce data, which encapsulates uncertainty regarding the parameters. The integration of the data involves defining a probabilistic model across potential observations under various parameter values, enabling the calculation of likelihood. By applying the Bayes rule to combine prior information with the likelihood derived from data, updates are made to the uncertainty surrounding the parameters.
In Bayesian analysis, a single probability distribution represents a mixture of aleatory and epistemic uncertainty in the distribution for a posterior value of a variable (Gelman, 2014). An assessment variable is characterized or represented as a two-dimensional probability distribution to show the contribution of epistemic uncertainty in connection to aleatory uncertainty. A two-dimensional distribution is made up of the variable’s CDFs, with samples are taken from probability distributions of model variables.
In situations where obtaining an analytical solution is difficult, Monte Carlo simulation is a helpful tool for estimation (Vose, 1996). The quantity of interest is estimated using this method in two steps. First, we take the prior distribution, which describes epistemic uncertainty, and use it to randomly generate parameters. Second, we sample from the model reflecting aleatory uncertainty and create values on the assessment variable conditional on the generated parameters. This two-step process, known as two-stage Monte Carlo simulation, is utilized to distinguish between aleatory and epistemic uncertainty (Vose, 1996). Figure 13 shows the representation of uncertainty of the assessment output using robust Bayesian analysis. By maximizing a summary from a distribution over the set of priors, one can establish bounds on a probability. The area shaded grey indicates the epistemic uncertainty of the variable of interest while the black curves show the estimated distribution.
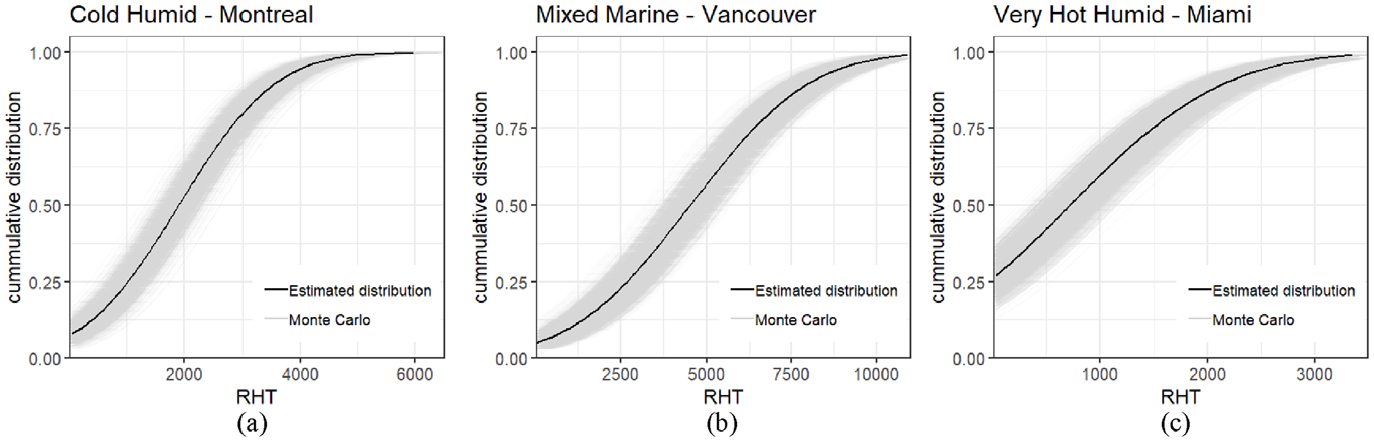
Representation of uncertainty in the assessment output using robust Bayesian analysis. Uncertainty of variable is characterized by a shaded distribution quantified using Monte Carlo for (a) Montreal; (b) Vancouver; and (c) Miami.
Another way to quantify the uncertainty is by probability bounds analysis. Uncertainty resulting from imprecision or ambiguity in the specification of distinct priors is represented by distribution intervals. Figure 14 shows the upper and lower bounds of the cumulative probability of the variable which represent the epistemic and aleatory uncertainty of the assessment output. When modeling is performed properly, the distribution of the estimates would always lie within the lower and upper bounds of the probabilities that characterize uncertainty in the quantity of interest. Compared to robust Bayesian analysis, probability bounds analysis provides a more conservative assessment of uncertainty.
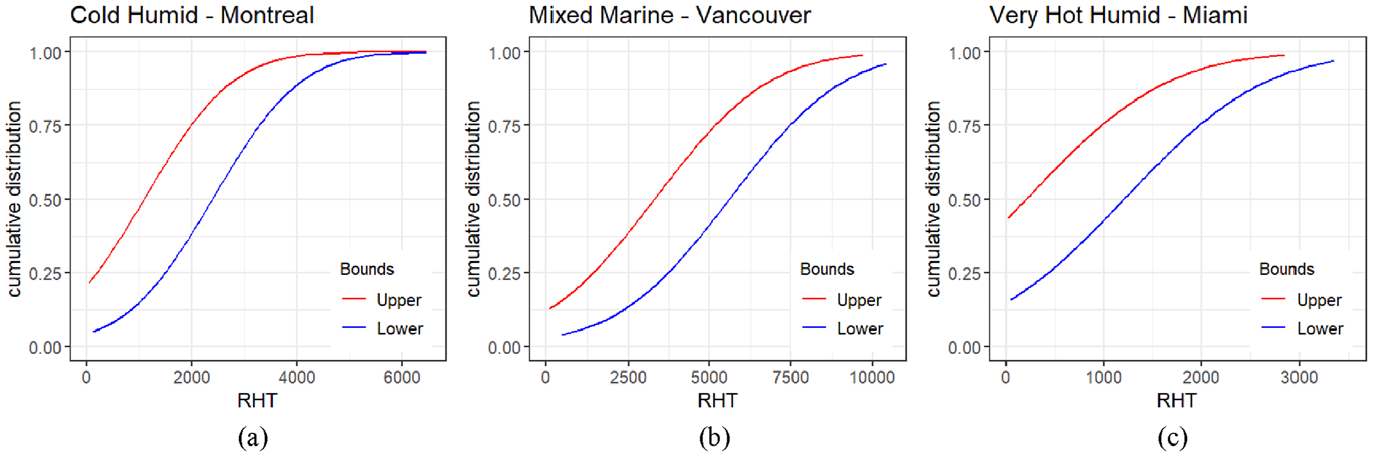
Representation of uncertainty in the assessment output using probability bounds analysis. Uncertainty is characterized by the lower (blue) and upper bounds (red) for probabilities for uncertainty quantification in the cumulative distribution for (a) Montreal; (b) Vancouver; and (c) Miami
The results from this analysis could help decision maker to understand the uncertainty of the assessment outputs, and hence improve the transparency of the results. A quantitative expression, such as “we have a range of confidence at 38%–75% that the RHT index for a Comb. 0 exterior wall in Montreal is at least 2000,” could be drawn from the assessment. The range of certainty in this bounds analysis might affect decision-making compared to there being precise probability.
Conclusions
This study is motivated by the lack of consensus on how to quantify the moisture risk of building envelopes considering uncertainty. The exterior wall deterioration induced by moisture accumulation was studied using a probabilistic risk assessment methodology. To account for the uncertainty in the considered factors, it is crucial to define the assessment in a probabilistic fashion. The ability to compare the risks associated with various configurations and the impact of random input factors is made possible by a quantitative study utilizing the Bayesian analysis. The created meta-model is fed into the Bayesian model to define the conditional probability functions of the variables.
The quantity and quality of the data input to the model have a significant impact on the reliability of the method. Concerning this issue, application of the BNs allows model updating by improving the statistical distributions of variables with new data or information and for considering uncertainty in multiple ways. Forward and backward inference propagation support the implementation of the scenario and what-if assessment. This methodology offers a way for designers to compare different risks owned by a wide range of solutions based on the available knowledge and acceptance of risk criteria. In addition, the uncertainty analysis using robust Bayesian analysis would provide information about the uncertainty in the assessment output.
The case study demonstrates the applicability of the methodology of localized analysis to support decision-making. The probabilistic risk assessment of the wood-frame exterior wall assemblies was as follows:
A causal map was used to pinpoint the mechanisms causing moisture risk in the exterior wall.
As parameter criteria for a comparative risk assessment, the RHT index was used, given that it accounts for temporal behavior of RH and T accumulation in the critical zone within a wall assembly.
Moisture infiltration was taken into account in addition to the undercooling mechanism, which as shown from the analysis is readily correlated with moisture-induced wall degradation.
The calculation of dynamic moisture transport in the building envelope is complex and uncertain, without absolute values for failure definition. Hence, the strategy of scenario and risk comparison was pursued in this study.
The results are valid only with the wall systems and/or materials and assumptions used in this study and should be evaluated for other wall systems or materials.
The findings show the expected patterns as given in the cumulative distributions. Moreover, the methodology can be applied for the risk assessment of building envelopes in preliminary design and decision-making, where prior knowledge is lacking.
This study advocates for setting a critical threshold for the RHT index to expand the method’s application beyond limited use solely for comparative purposes. Further work may include acquiring more data on probability distributions of variables. This can cover the limitation possessed by the case study where limited input data were assessed. The model could be extended for other climate zones, and moreover, the inclusion of climate variables into the meta-model would improve the robustness and applicability of the proposed method in the assessment process.
Footnotes
Declaration of conflicting interests
The author(s) declared no potential conflicts of interest with respect to the research, authorship, and/or publication of this article.
Funding
The author(s) disclosed receipt of the following financial support for the research, authorship, and/or publication of this article: This work was supported by a research grant from the Building Owners and Managers Association of British Columbia (BOMA BC), Canada.