
Abstract
Excess moisture in concrete structures is a major problem in building industry. It is claimed that degradation of the finishing materials of concrete slabs is the largest source of volatile organic compound in the building stock in the Nordic countries. Considering concrete wall panels, the choice of the insulation material influences concrete drying considerably and causes a risk for moisture accumulation on the interior surface, if vapor tight finishing materials are used or if finishing materials are installed prematurely. Mineral wool insulation, which has predominately been used in Finland, is a vapor open material. However, vapor tight plastic foam insulation materials are nowadays more commonplace. Here we show that the overall rate of drying of the concrete panel with a vapor open insulation material is higher in comparison to the concrete panel with vapor tight insulation materials. However, relative humidity distribution near the inner surface of the concrete panel at the end of the drying phase is almost identical irrespective of the insulation material and the water vapor resistance of the interior surface material has a greater impact on the relative humidity level on the inner concrete surface. Moisture behavior of concrete panel walls is studied under a certain building schedule in Finnish environment and building conditions by numerical simulation. The model for drying of concrete is calibrated based on laboratory measurements. According to our study, self-desiccation and changing diffusivity due to the hydration process of the concrete cannot be ignored when evaluating the moisture behavior of the concrete wall panel structure with a low water binder ratio (w/b < 0.5). Measurements indicate that the early age humidity drop is by up to 10 percentage points.
Keywords
Introduction
Precast concrete wall panels are widely used in Finnish building industry and mineral wools (MWs) have been the most commonly used insulation materials in wall systems including rockwool (RW) and glasswool (GW). An example of the structure is presented in Figure 1. Presently, plastic foam (PF) insulation materials such as expanded polystyrene (EPS) and polyurethane (PU) or polyisocyanurate (PIR) are more frequently used. PF and especially PU/PIR is preferred for its thermal resistance and good availability on the market. The increased use of PFs might result from the public opinion that MWs are more sensitive to wetting and damaging during the building process when exposed to the weather. Moisture safety is also in the contractors’ interest as mold problems and wet building sites have been under public eyes in Finland in the recent years. In this study, relative humidity distribution in concrete—and especially the drying ability of building moisture of the concrete wall panel structure—is examined.
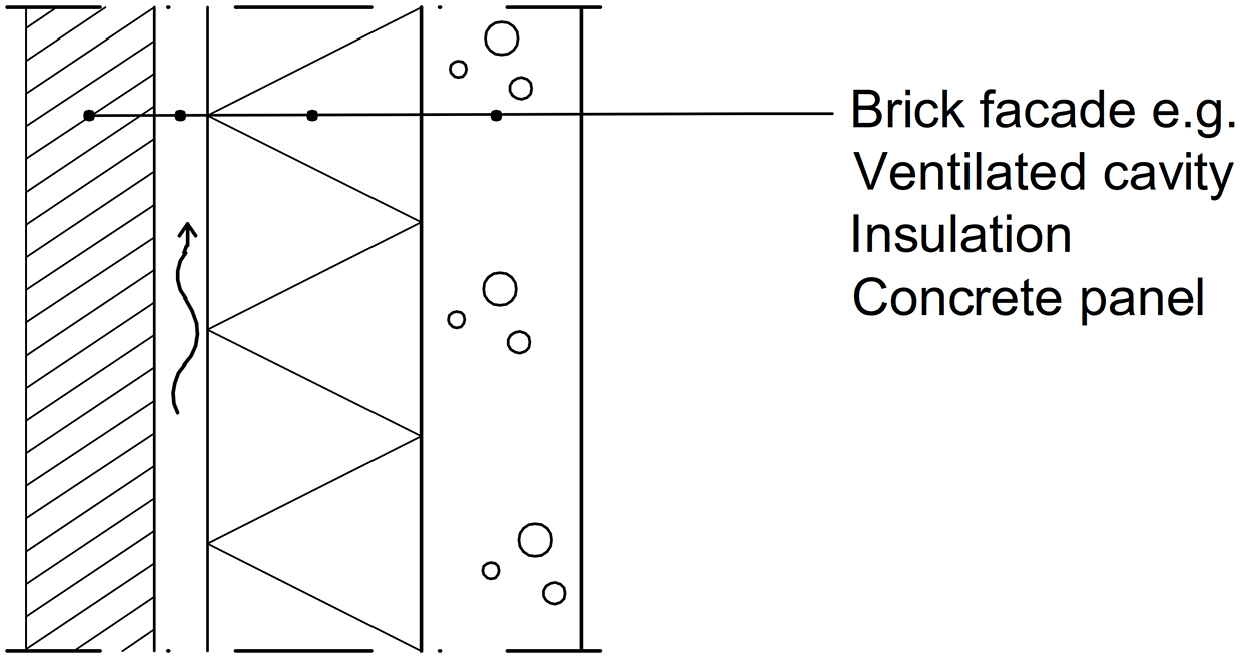
Interior concrete panel wall with exterior insulation.
In concrete panel walls, insulation is installed on the exterior surface of the panel. For this reason, drying of the concrete panel occurs either to interior or to both interior and exterior sides depending on moisture transfer properties of the insulation material. In the Finnish climate, average moisture flow is from interior to outside. In the average cold winter months, the outdoor partial vapor pressure is approximately 320 Pa at −5°C and 80%RH while the indoor partial pressure is 994 Pa at 21°C and 40%RH. Therefore, the Finnish climate provides a significant drying potential for the building envelope. MW is water and moisture permeable and in addition MWs in use are hydrophobic so that short-term water absorption is low compared to hydrophilic MW (Jerman and Cerny, 2012; Papadopoulos, 2005; Dop, Paroc Cortex; Dop, FF-PIR; Dop, FF-EPS; Dop, RKL-31). An advantage of the high moisture permeability of MW is that an MW insulated concrete panel dries to both sides whereas one with PF insulation essentially dries to interior. Thus, the choice of the insulation material influences concrete drying considerably and causes a risk for moisture accumulation on the interior surface, if vapor tight finishing materials are used or if finishing materials are installed prematurely.
Moisture in concrete is a result from internal mixing water and external building moisture. Initial water in concrete mix (w0) is the sum of evaporable water (we) and water necessary for hydration (wn) which is dependent on the amount of binder (b) and the ultimate degree of hydration (αu). If an empirical equation wn = 0.253 ×αu×b (Mills, 1966) is used and w/b is constant, we is directly proportional to the amount of water w0 so that we=w0(1 − 0.253αu)/(w/b), where w/b is the water binder ratio. After mixing and casting the concrete, hydration causes self-desiccation. Depending on the concrete grades and mainly on the w/b ratio, the initial moisture drop is around 2–10 RH percentage points being greater with lower w/b ratios (Ding et al., 2019; Persson, 2000, 2001). Thus, the initial moisture state of the panel is predominantly dependent on the w/b ratio and the amount of mixing water.
The external moisture load is highly dependent on the climate and the practice of moisture safety procedures on the building site. Precast wall panels are usually cast and insulated indoors and rain protected before installation. After installation, panels are exposed to the outdoor climate and the amount of gained building moisture depends on the weather. The exterior surface of a pre-insulated wall panel is not exposed to wind-driven rain; however, the panels frequently absorb moisture from rainwater leaks in some parts of the building before the envelope is water tight.
As pointed out earlier, the insulation material properties determine, as one significant factor, the drying and the moisture profile in the concrete panel. The difference in moisture profiles after the drying phase of PF and MW insulated structures is demonstrated in Figure 2. With PF insulation, there is some moisture accumulation expected on the exterior side of the concrete panel whereas the MW insulated panel is drying to both sides due to vapor open insulation.
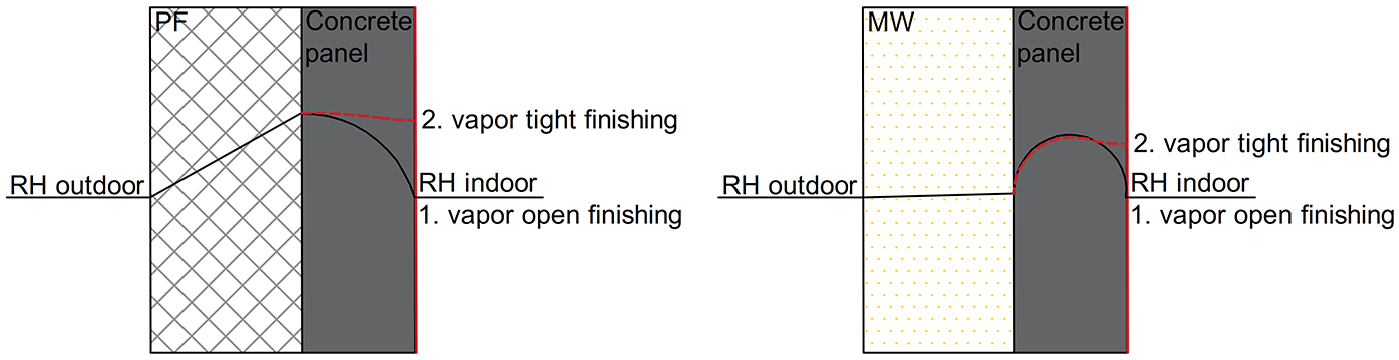
Schematic drawings of moisture profiles with PF (a) and MW (b) insulated concrete panel. Moisture profile in concrete at the end of the drying phase (1). If vapor tight surface material is installed, moisture level on the interior surface of the concrete panel increases (2) whereas with vapor open finishing material, moisture level decreases in time.
The risk for mold growth between insulation and concrete is negligible regardless of the insulation material. Viitanen (2004) showed that insulation materials in direct contact to concrete tolerate high relative humidity levels for months (>97%RH–98%RH) if there is no biodegradable compound such as saw dust between material layers. Regarding the indoor air quality aspect, it should also be considered if a part of the structure is in direct contact with interior or if there is a possibility for air leakages to interior (Viitanen et al., 2015). In that perspective, exterior insulation of the concrete wall is not the most critical part when drying of the concrete wall panel is considered. On the contrary, it has been shown that finishing materials with inadequately dried concrete structures have caused indoor air problems (Björk et al., 2003; Sjöberg and Ramnäs, 2007). Björk et al. (2003) showed that alkalinity in the humid concrete could cause degradation on some of the components in the adhesive or the carpet, and based on Sjöberg and Ramnäs (2007), the largest source of volatile organic compound in the building stock in the Nordic countries is flooring systems (polyvinyl chloride or linoleum) attached to a substrate of moisture damage or insufficiently dried concrete.
This study investigates the sufficient relative humidity level for concrete wall panels before installing the finishing material layer. Normally, moisture measurements are performed to ensure sufficient drying. When drying occurs only to interior, the evaluated relative humidity is measured at a critical depth (A) 40% in concrete and if drying is to both directions, the critical depth is at 20% in concrete (ASTM Standard F2170; RT 14-10984, 2010). Installation of the finishing material can be done if relative humidity is lower than the maximum value specified by the manufacturer. The criterion does not consider the water vapor resistance of the finishing material. A presumption for relative humidity beneath the finishing material after the installation is below or at most the relative humidity level measured at the critical depth (A) before installation. If finishing is permeable, for example, normal latex paint, the relative humidity profile will not change significantly after installation. However, if finishing is vapor tight such as some water proofing materials, moisture will accumulate beneath the finishing material and may cause degradation of the finishing material if the concrete panel has not dried sufficiently. Thus, the water vapor resistance of the finishing material has to be taken into consideration when examining the moisture performance of the structure.
According to Ojanen (2017), vapor open thermal insulation allows significantly faster drying of the inner concrete panel than more vapor tight thermal insulation. In the study, a WUFI 6.0 simulation model was employed, which did not consider the effect of self-desiccation and which has significant influence on the initial relative humidity level in concrete panels with relatively low w/b < 0.5. We are studying moisture behavior of the concrete structure including concrete hydration and the effect of hydration process on diffusivity in a simulation model based on previous studies (Di Luzio and Cusatis, 2009; Hernandez-Bautista et al., 2016; Sekki and Karvinen, 2017). The aim of this study is to evaluate relative humidity distribution in the concrete panel wall with different external thermal insulation materials and interior finishing materials by simulation based on practical schedule and climate conditions of the building site.
Materials and methods
Numerical hydration and moisture transport model
Moisture transport
Heat and moisture transport in building materials is governed by a system of two partial differential equations for the energy and mass balance. The hydration process is described by heat source and moisture sink terms in equations (1) and (2). In our formulation, relative humidity ϕ is the moisture potential


where T is the temperature (K), ρ is the density (kg/m3), Cp is the specific heat(J/kgK), t is the time (s), k is the thermal conductivity (W/mK), Lv is the latent heat of evaporation (J/kg), δp is the water vapor permeability (s), psat is the saturation pressure (Pa), Q is the heat source (J/kg), ξ = dw/dϕ is the moisture storage capacity (kg/m3), w is the water content (kg/m3), Dw is the liquid water diffusion coefficient (m2/s), and S is the moisture source or sink (kg/m3s).
The heat generation rate and the evaporable water sink due to hydration reactions for concrete are obtained from


where Hu (J/m3) is the ultimate enthalpy of hydration, α (–) is the degree of hydration, ρs (kg/m3) is the density of solids, wn (kg/kg) is the non-evaporable water necessary for hydration, and Mf,cem (–) is the mass fraction of cement.
The degree of hydration α(te) and the equivalent age te are solved from ordinary differential equations (ODEs)


where Eh is the activation energy (J/mol), R is the gas constant of water (J/molK), Tr is the reference temperature (K), β is the hydration shape parameter (–), τ is the hydration time parameter (s), and αu is the ultimate degree of hydration. The function βRH(ϕ) = (1 + (a−aϕ)b)−1 limits the degree of hydration based on relative humidity (Di Luzio and Cusatis, 2009). Constant values a = 5.5 and b = 4 were adopted from Di Luzio and Cusatis (2009). The maturity equation parameters β and τ in equation (3) are calibrated by comparing to measured relative humidity values. The ultimate degree of hydration was solved from αu = (1.031 ×w/b)/(0.194 +w/b) based on Mills (1966).
Material properties of concrete
Sorption
The hysteresis phenomenon was not modeled. The degree of hydration and relative humidity dependent water content are obtained from Di Luzio and Cusatis (2009)

in which


where kvg and g1 are the model parameters. Concrete mix properties utilized are the amount of cement and water c and w0 (kg/m3). The model parameters kvg and g1 were calibrated based on a laboratory sorption test at fully hydrated state.
Liquid water diffusivity
For the liquid water diffusion coefficient Dw, an S-shaped curve proposed by Bazant and Najjar (1971) was employed

where α0, ϕc, and n are the model parameters.
Since the pore structure of concrete changes during hydration and moisture diffusivity decreases significantly, we employed a degree of hydration dependent water diffusivity with chemical affinity analogy proposed by Di Luzio and Cusatis (2009) so that D(α) at fully hydrated concrete is D1

where D1 is the diffusivity at full saturation for fully hydrated concrete, and Dα is the diffusivity factor at the initial state of hydration. The diffusivity can be calibrated based on experimental data. The parameters D1, Dα, and η1 are calibrated by fitting the simulation results to the relative humidity measurement data.
Vapor permeability
Vapor transport decreases considerably compared to dry state since the pores fill with moisture and permeability is zero at full saturation (Baroghel-Bouny, 2007; Chen et al., 2012). However, the liquid water diffusivity is dominant near saturation, and therefore, a constant vapor permeability is employed based on laboratory tests.
Experimental data
Studied structures
Concrete panel wall structures with three insulation materials (MW, EPS, and PIR) were studied. The thickness of the concrete panel was 150 mm. Insulation materials and thicknesses were as follows:
MW: Paroc Cortex One, 205 mm.
EPS: FF-EPS 60S, 200 mm.
PIR: FF-PIR PLK (with plastic foils on surfaces), 150 mm.
The insulation material thickness was chosen so that the U-value met the target range of 0.14–0.16 W/m2K.
Materials
Concrete
The concrete grade used in relative humidity measurement tests was factory blended C40/50 rapid-hardening concrete. The binders used were rapid-hardening Portland cement CEM I 52.5 R and CEM II/B-M42.5. The free water binder ratio was 0.475 and a plasticizer was used to lower the water usage. The maximum coarse aggregate size was 16 mm.
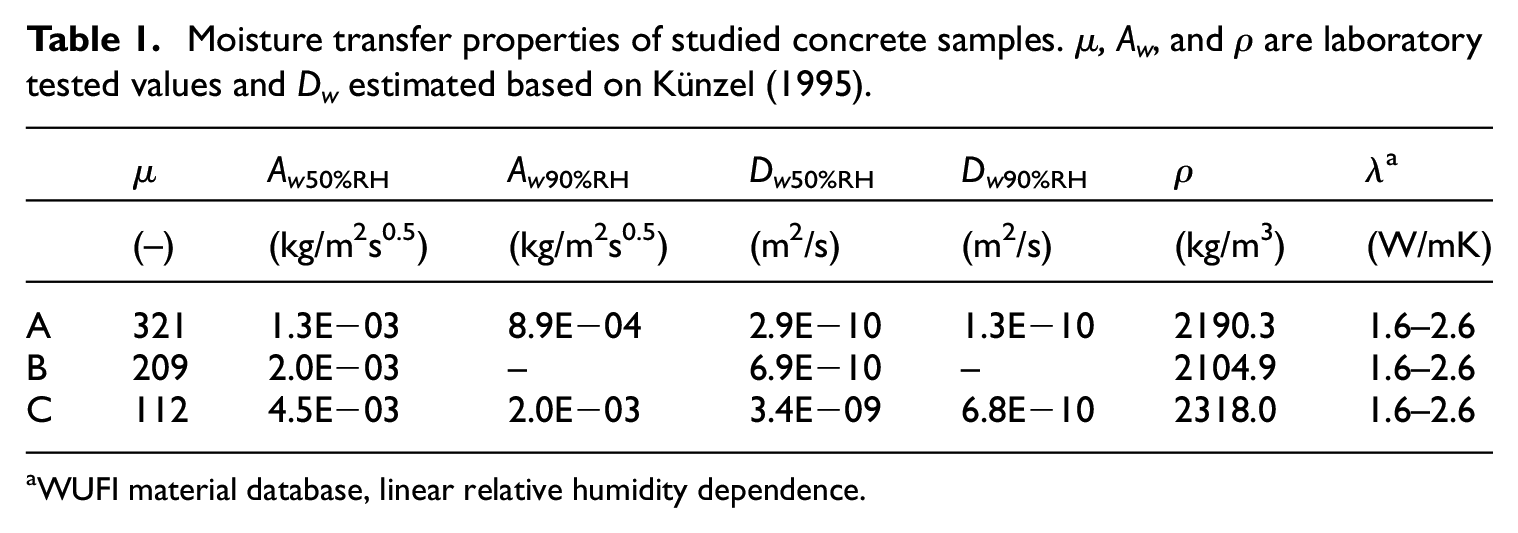
Moisture transfer properties were tested for three different factory blended C40/50 concrete panels (Table 1). Samples A and B were cast in factory and sample C in laboratory. The moisture isotherm (sorption and desorption), water sorption coefficient, and vapor permeability were determined in a separate study in Vinha et al. (2019). An estimation for diffusivity at full saturation is calculated from D1 = 3.8(Aw/wmax)2 (Künzel, 1995) on the basis of laboratory measurements for water sorption coefficient Aw. There are differences when comparing factory casted test pieces and laboratory casted ones. Concrete C is more permeable to water vapor and liquid water.
Moisture transfer properties of studied concrete samples. µ, Aw, and ρ are laboratory tested values and Dw estimated based on Künzel (1995).
WUFI material database, linear relative humidity dependence.
Fib Bulletin No. 65 (2010) proposes an estimation for diffusivity at full saturation D1.fib = 10−8/(fcm− 8). For the tested concrete grade C40/50 with fcm = 50 MPa, an estimation is D1.fib = 2.4E−10 (m2/s). The calculated diffusivities are mainly in the same range and can be used as initial values for calibrating the model.
The results of the laboratory tests for sorption isotherms and vacuum saturation test are shown in Figure 3. The average sorption curve at fully hydrated state is modeled using equation (7).
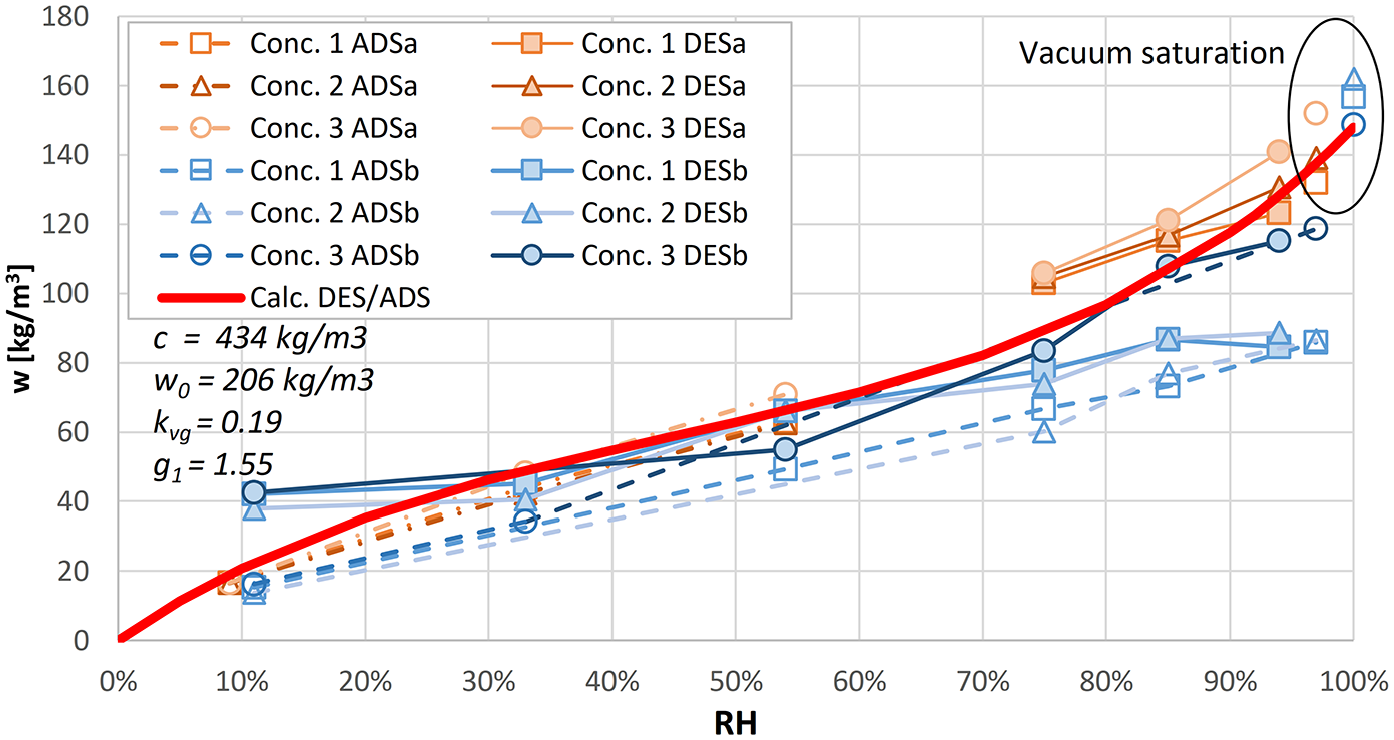
Measured desorption/adsorption, vacuum saturation, and modeled average sorption curve.
Insulation materials
Material properties of PFs and MW for moisture transfer are listed in Table 2. Water vapor permeability differs widely; MW is vapor open and PFs are vapor tight. There is no significant difference in water absorption even if the pore system of the MW is open and PFs are more closed. Material properties of insulation materials used in simulations are listed in Table 3.
Thermal and moisture transfer properties for insulation materials (Dop: Paroc Cortex; Dop: FF-PIR; Dop: FF-EPS; Dop: RKL-31).
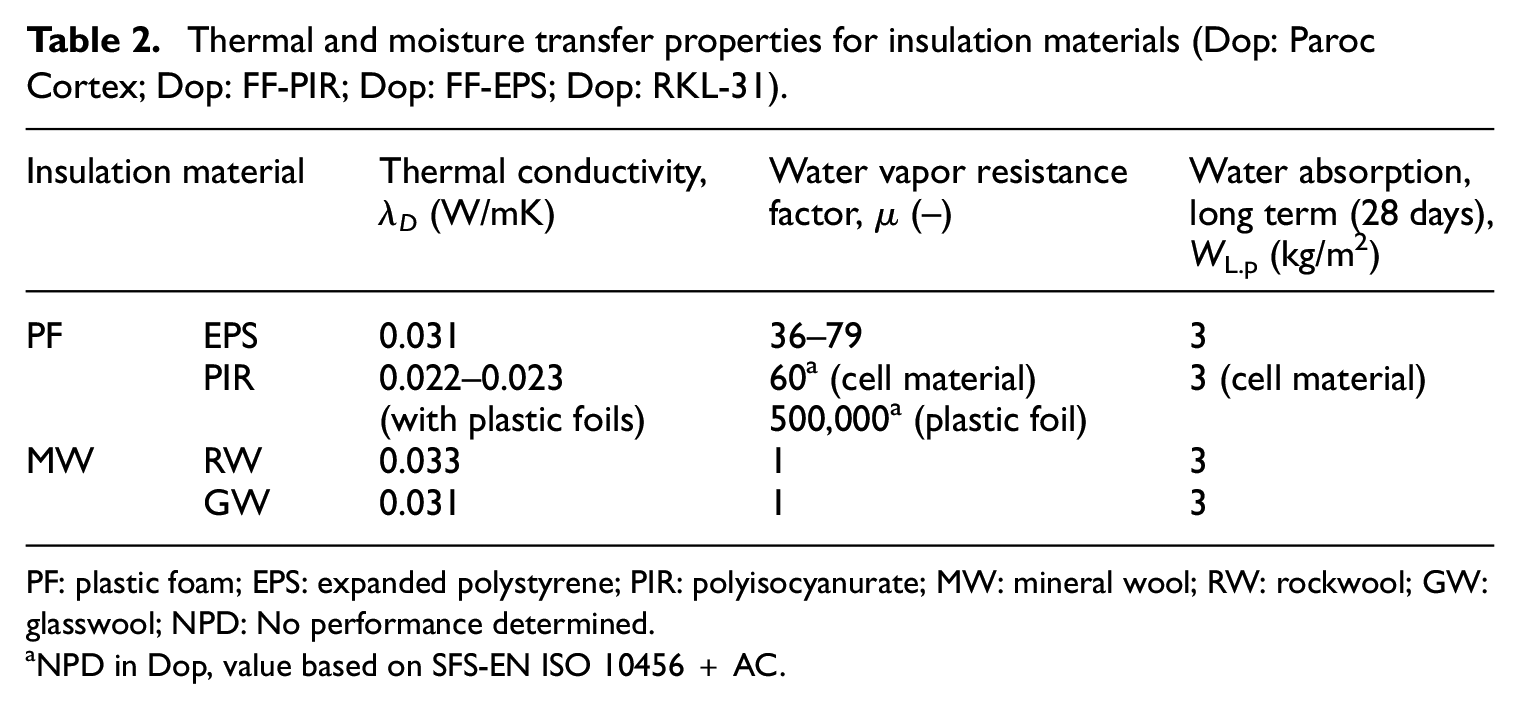
PF: plastic foam; EPS: expanded polystyrene; PIR: polyisocyanurate; MW: mineral wool; RW: rockwool; GW: glasswool; NPD: No performance determined.
NPD in Dop, value based on SFS-EN ISO 10456 + AC.
Thermal and moisture transfer properties for insulation materials.
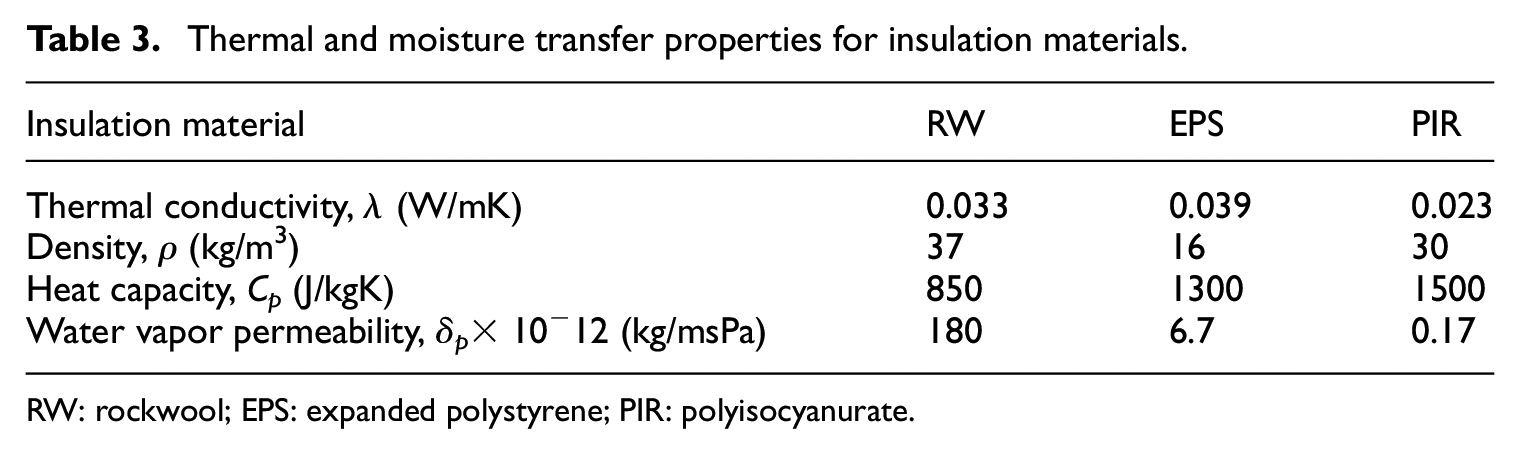
RW: rockwool; EPS: expanded polystyrene; PIR: polyisocyanurate.
Exterior materials
The modeled structure in building phase corresponds to the structure of Figure 1 with 120 mm lime-silica brick exterior and 40 mm ventilated air layer. Material properties of exterior materials used in simulations are listed in Table 4.
Material properties of exterior materials.
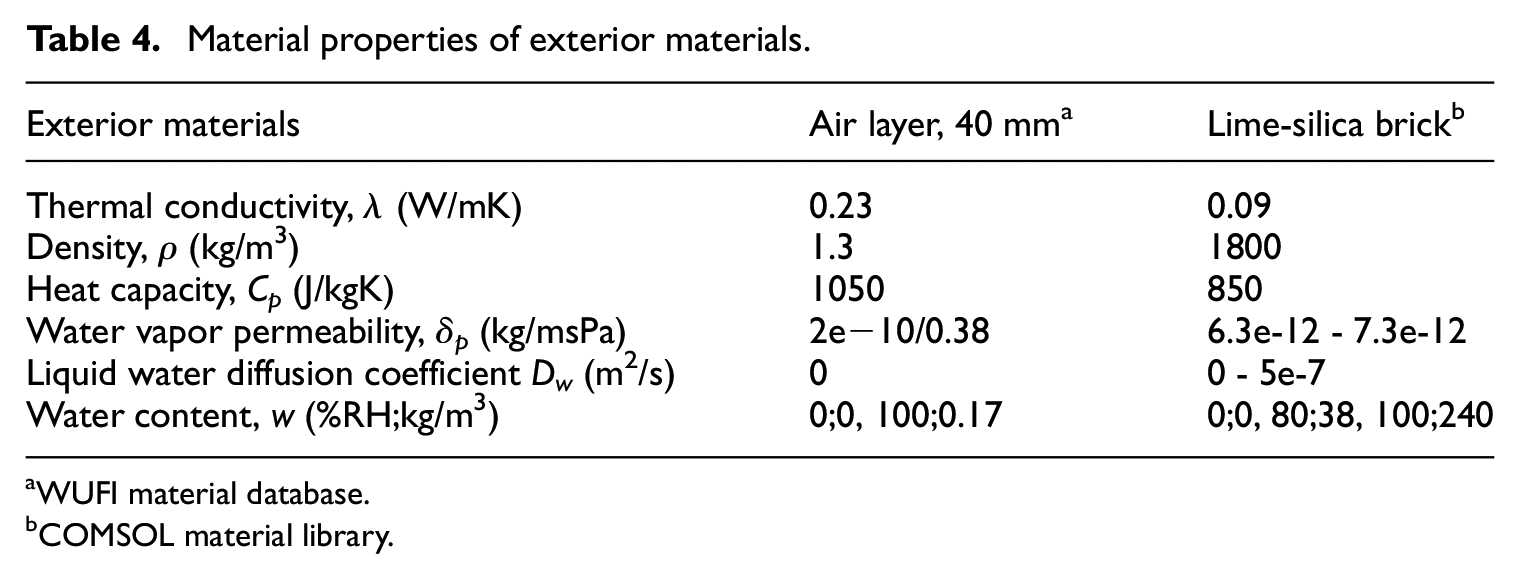
WUFI material database.
COMSOL material library.
Air change rate (ACH (s−1)) for ventilation was deployed as additional heat (QACH) and moisture (SACH) sources described as follows


where Te is the exterior temperature (K) and ϕe is the exterior relative humidity. Rw is the gas constant of water vapor and is 461.52 (J/kgK). The average value of ACH in the ventilated cavities differs considerably, from <10 up to 1000 depending on structure (Falk and Sandin, 2013; Langmans and Roels, 2015). A conservative estimation of ACH 20 h−1 (constant) was used in simulations.
Surface materials
Because of the large time scale, the laboratory studies did not include testing of the effect of water vapor resistance of the finishing materials on the water distribution of the concrete wall panel. For the simulations, the properties of the most typical wall finishing materials were chosen. Typical water vapor resistance values for water proofing materials are sd = 6 m for liquid applied product and for nowadays less often used plastic wallpaper for wet areas sd = 100 m. Paint finishings were excluded because of very low water vapor resistance which in turn has a minor effect on the relative humidity distribution.
The internal finishing material layer is not modeled in the simulation model. The surface equivalent vapor diffusion thickness is for an uncoated surface sd.si = 0.008 m based on (SFS-EN 15026). The effect of the finishing material was modeled via the surface moisture transfer coefficient βsi (s/m) so that
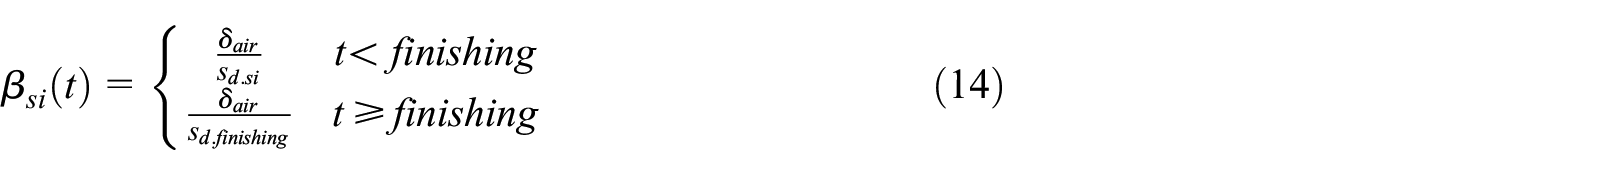
where δair is the vapor permeability of still air (kg/msPa).
Samples and moisture measurements
The objective was to determine the relative humidity distribution of the concrete panel during a selected drying period. Grade C concrete was used for samples (Table 1). Samples were cured and conditioned of steady 21°C and 50%RH conditions. Relative humidity was measured with the borehole method which is widely used in construction sites in the Nordic countries. The method is described in ASTM Standard F2170 – 18. Vaisala HMP110 probes were applied and calibrated using four different saturated aqueous solutions in the chamber at 20°C to achieve the desired relative humidity (K2SO4: 97.6%RH, KCl: 85.1%RH, NaBr: 58.7%RH, and MgCl2: 33.1%RH).
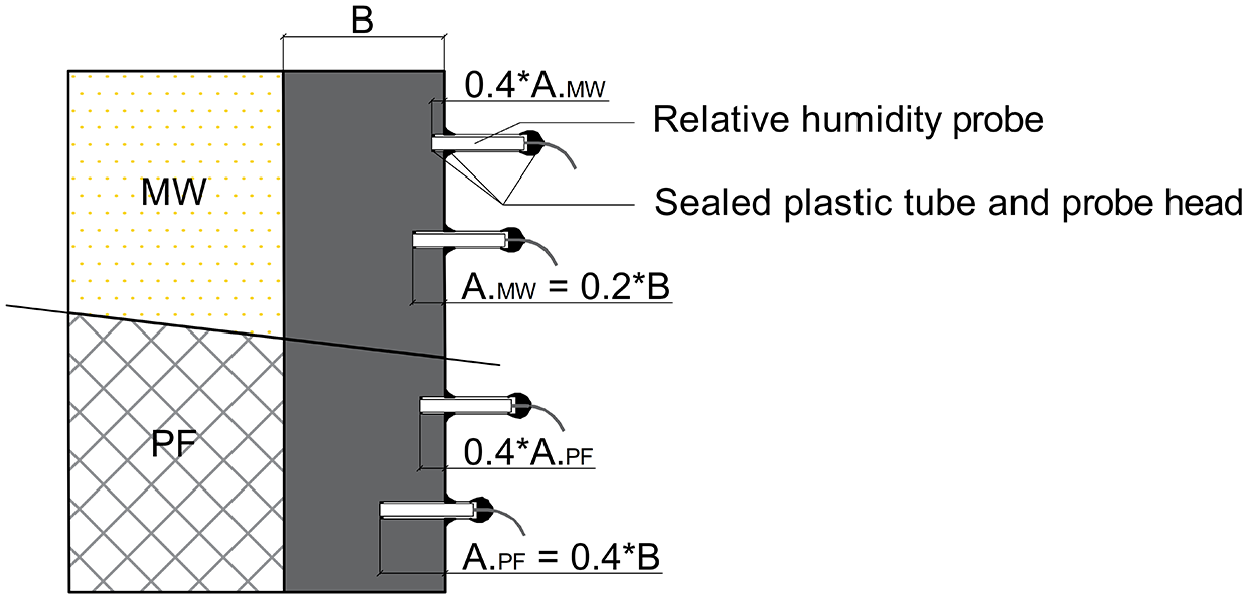
A test piece is illustrated in Figure 4, in which the comparative measuring method is shown, using measuring tubes installed before casting the concrete. A study which compares the measuring methods (Vinha et al., 2019) showed that results with the borehole method are more consistent and therefore was chosen as a reference for the simulations. Figure 5 illustrates the borehole method measuring in the concrete wall panel.
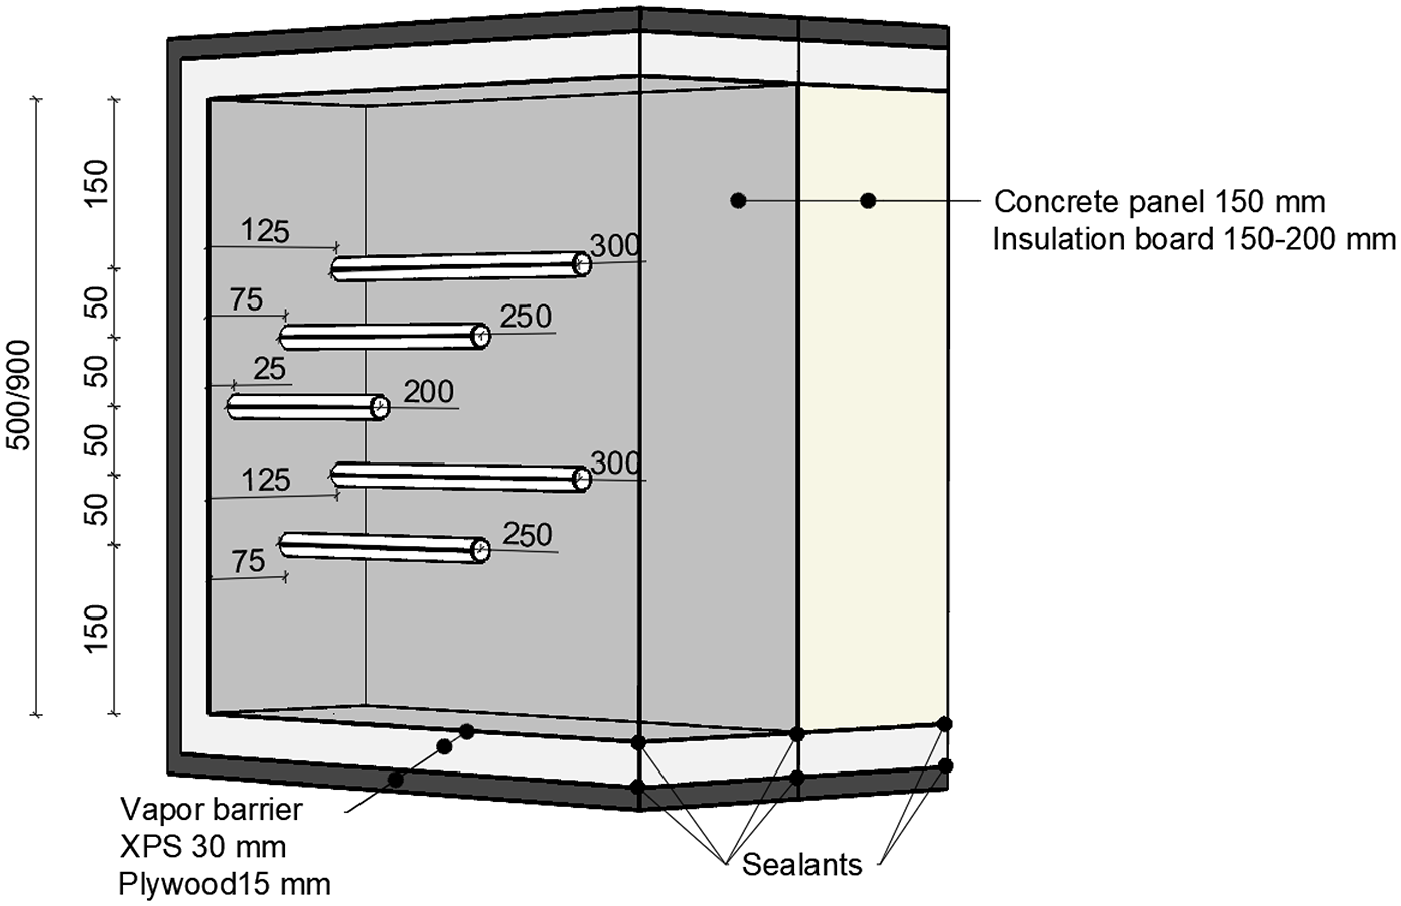
Structure of samples and placement of measuring tubes.
Borehole measurements in concrete wall panel.
Measurement depths for the test pieces were selected in order to determine the relative humidity distribution over the test specimen, the depths being 125, 75, and 25 mm from the free surface. Simulation results are evaluated at the critical measuring depth (A) and at the secondary depth 0.4*A based on the Finnish guidance (RT 14-10984, 2010) for indicating moisture condition of the concrete structure before applying the finishing material. For the MW insulated structure which dries in two directions A = 20% in concrete and for the PF structure where drying occurs only in one direction A = 40%. For sensitive finishing materials such as most plastic floorings, the critical relative humidity values are 85%RH in depth A and 75%RH in depth 0.4*A.
Building phase simulation
The concrete hydration and moisture transport model governed by equations (1) and (2) was utilized for simulating relative humidity in precast concrete panels during building phases from casting the concrete to finishing the interior walls and the use of the building. The total simulation time was 720 days. Geometry changes during building phase were not taken into account. The modeled structure corresponds to the one of Figure 1 with 120 mm lime-silica brick exterior and 40 mm ventilated air layer. Insulation layer thickness was 200 mm for MW and EPS and 150 mm for PIR. The thickness of the concrete panel was 150 mm. The simulations were performed using a commercial finite element method (FEM)–based software COMSOL Multiphysics 5.4. The built-in physics interface heat and moisture transport solves equations (1) and (2) and equations (5) and (6) were modeled using the domain ODEs and differential algebraic equations (DAEs) physics interface. The selected building type was a four-story apartment building. A conservative schedule (C1–C3) for humid and drying periods was estimated based on a contractor interview. Comparative simulations with finishing materials (S1, S2) were carried out. Examined cases are shown in Table 5.
Simulation cases of the building phase simulation.
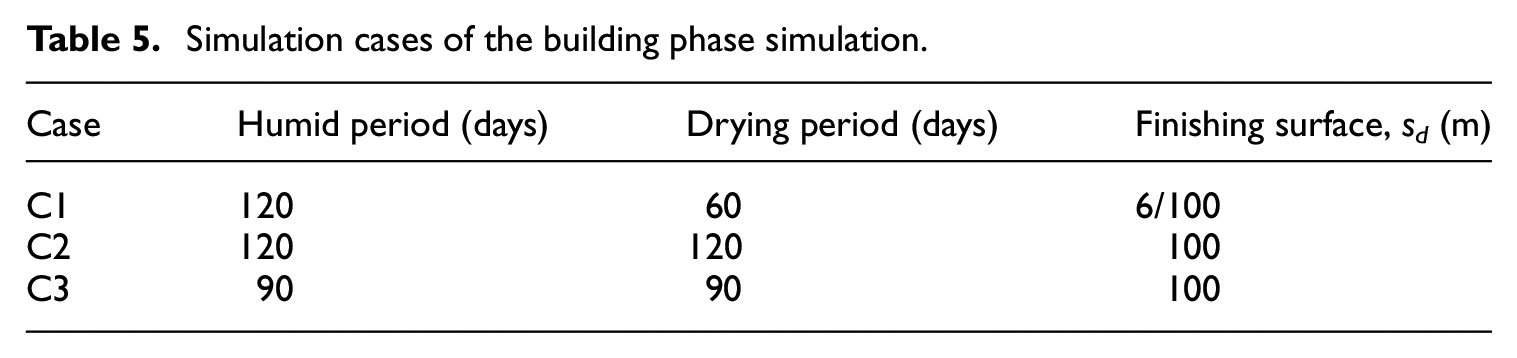
A test year for building simulations (Vantaa, 2007) was utilized for the exterior boundary condition Ruosteenoja K et al. (2013). The calculation was set to start on 1 September since the autumn is the most critical period considering the drying potential. The drying period had constant conditions of 20°C and 60%RH. The temperature conditions in the use period were constant 20°C while relative humidity was varying based on the Finnish guidelines (RIL 107-2012, 2012) in which the internal moisture excess is in relation to the exterior temperature (Figure 6). The effect of driving rain and solar radiation was included because of their importance to the moisture load and moisture transfer in the exterior part of the wall. Wetting of the interior parts of the structure was excluded as it was assumed that panels are protected from rain during the building phase. Exterior and interior boundary conditions in studied cases are shown in Figures 7 to 10.
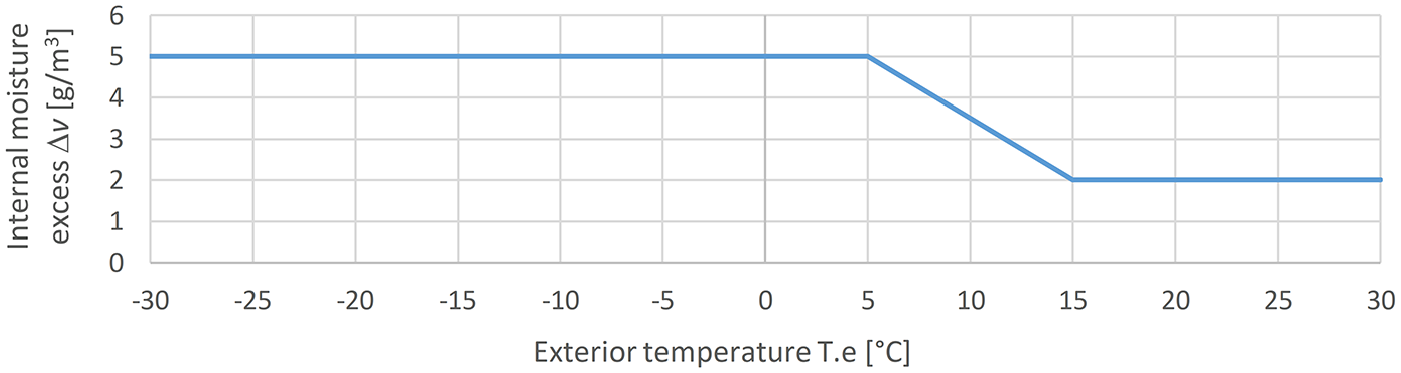
Internal moisture excess based on the Finnish guidelines (RIL 107-2012, 2012).
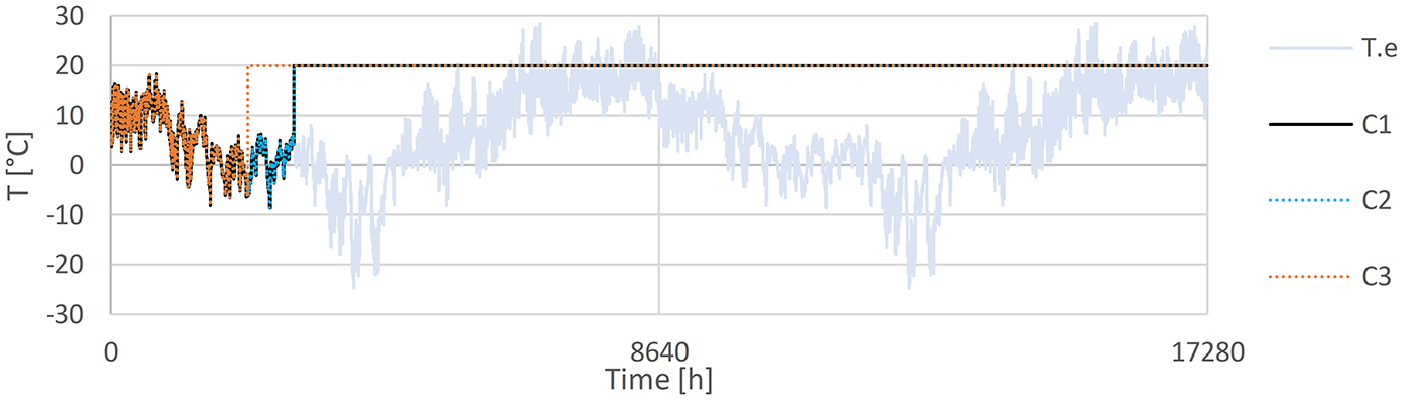
Exterior temperature (Te) and interior boundary temperatures in studied cases (C1–C3). In all cases, the initial phase is at ambient air temperature. Drying and use phases are constant.
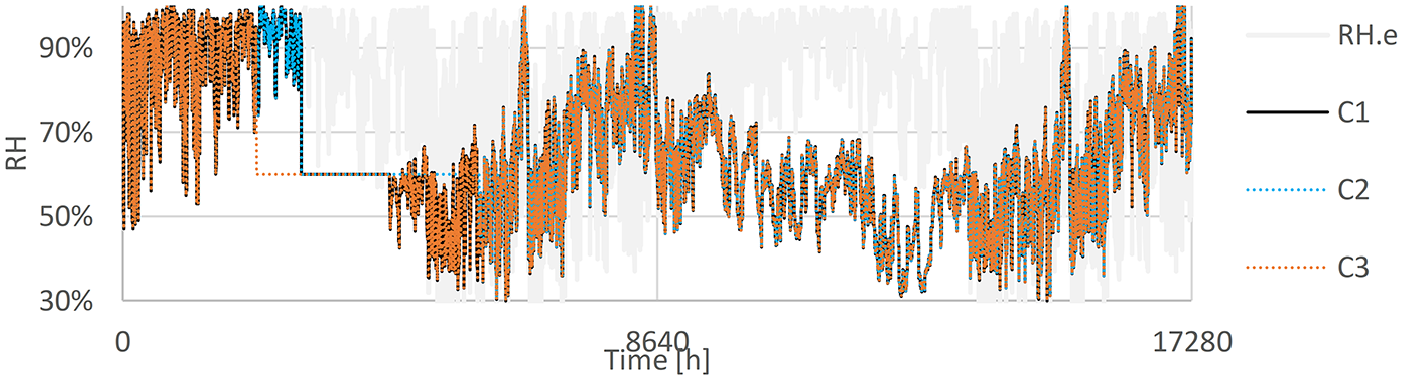
Exterior relative humidity (RHe) and interior boundary relative humidity in studied cases (C1–C3). In all cases, the initial phase is at ambient air relative humidity. Drying phase is constant after which relative humidity in use phase is varying.
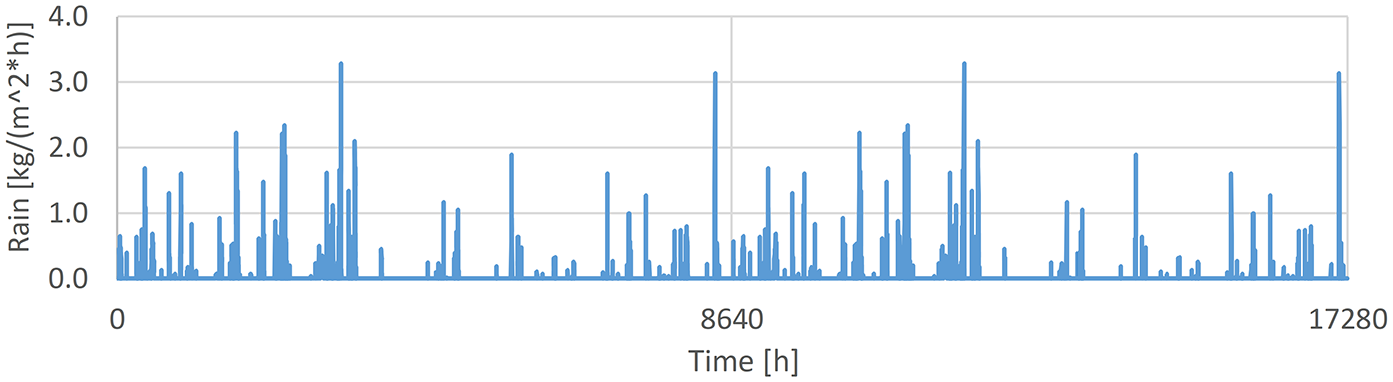
Exterior boundary rain intensity on southern facade.
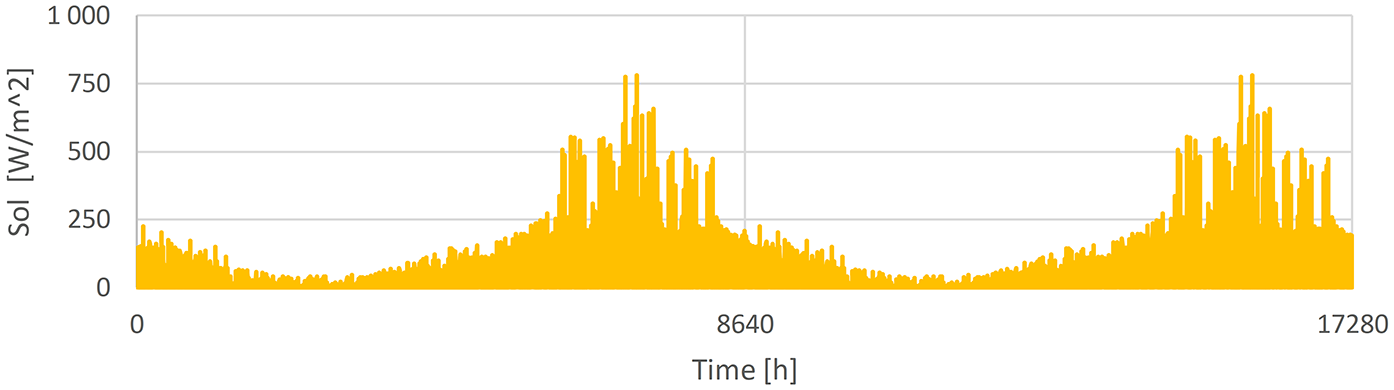
Exterior solar radiation on southern facade.
Critical relative humidity measuring depths are examined before applying the finishing material to ensure whether the criteria for finishing based on the Finnish guidance are met (A = 85%RH and 0.4*A = 75%RH). However, finishing is installed based on a schedule irrespective of the current relative humidity level. The effect of water vapor resistance of the finishing and insulation material is studied by evaluating the relative humidity level development under the finishing material.
A one-dimensional (1D) simulation model consisting of 58 elements with quadratic shape functions was found to give sufficiently accurate results (Mesh 1). The results of the mesh independency study are shown in Figure 11 (30-day study in case C1 with PIR insulation). Mesh 1 gives a maximum difference of 0.11 percentage points in relative humidity compared to a model with 116 elements. The maximum time step was set to 1 h to meet the boundary condition variations; however, the results were saved in fewer intervals to restrict the disk space taken by the model file. The CPU time for one simulation was approximately 3 h with a laptop computer equipped with an Intel(R) Core(TM) i7-7700HQ CPU, 2.80 GHz and 32 GB of memory.
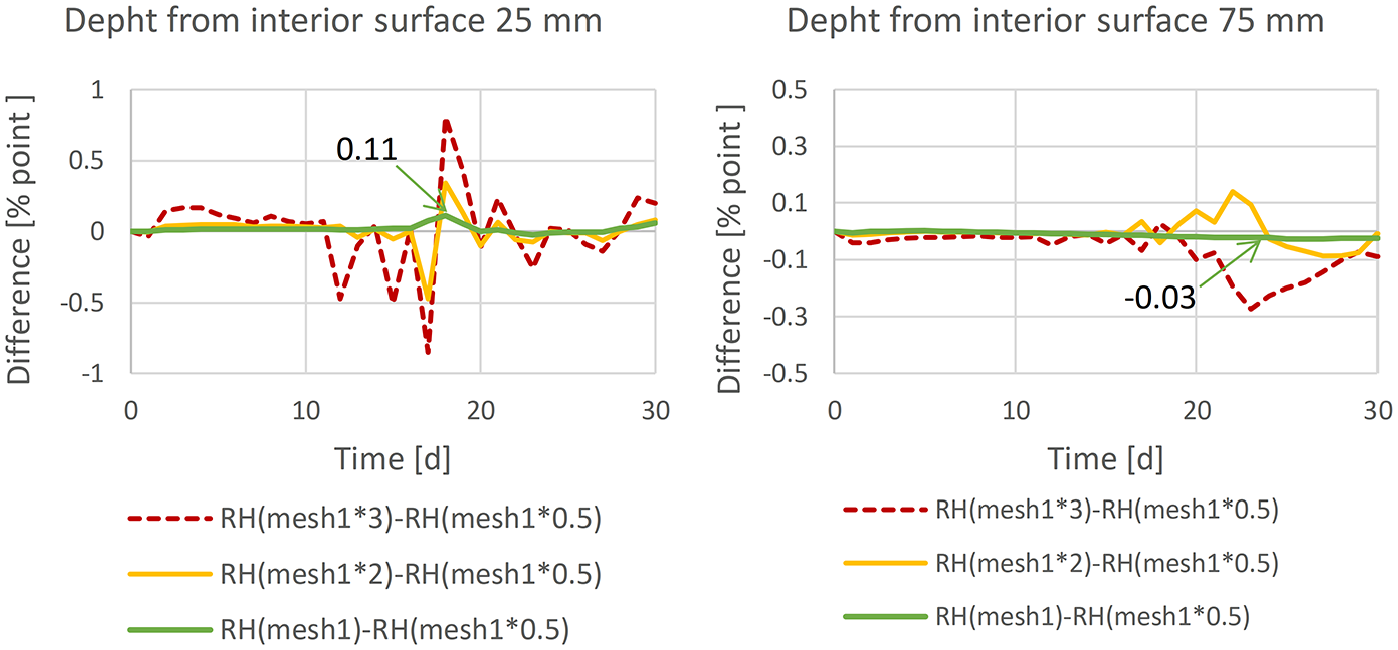
Mesh independency study (30-day study in case C1 with PIR insulation). Difference in simulated relative humidities with different meshes was studied in two depths from interior surface of the concrete panel.
Results
Model calibration
Calibration was executed with the trial and error approach. Results of model calibration are shown in Figure 12. As pointed out in Figure 2, the moisture distribution is different when comparing RW and PF insulated structures. In both cases, drying is faster near the interior surface; however, in the case with RW also the measuring point near the exterior is drying equally fast compared to the interior surface. Based on the measurements, there are no significant differences between EPS and PIR in drying.
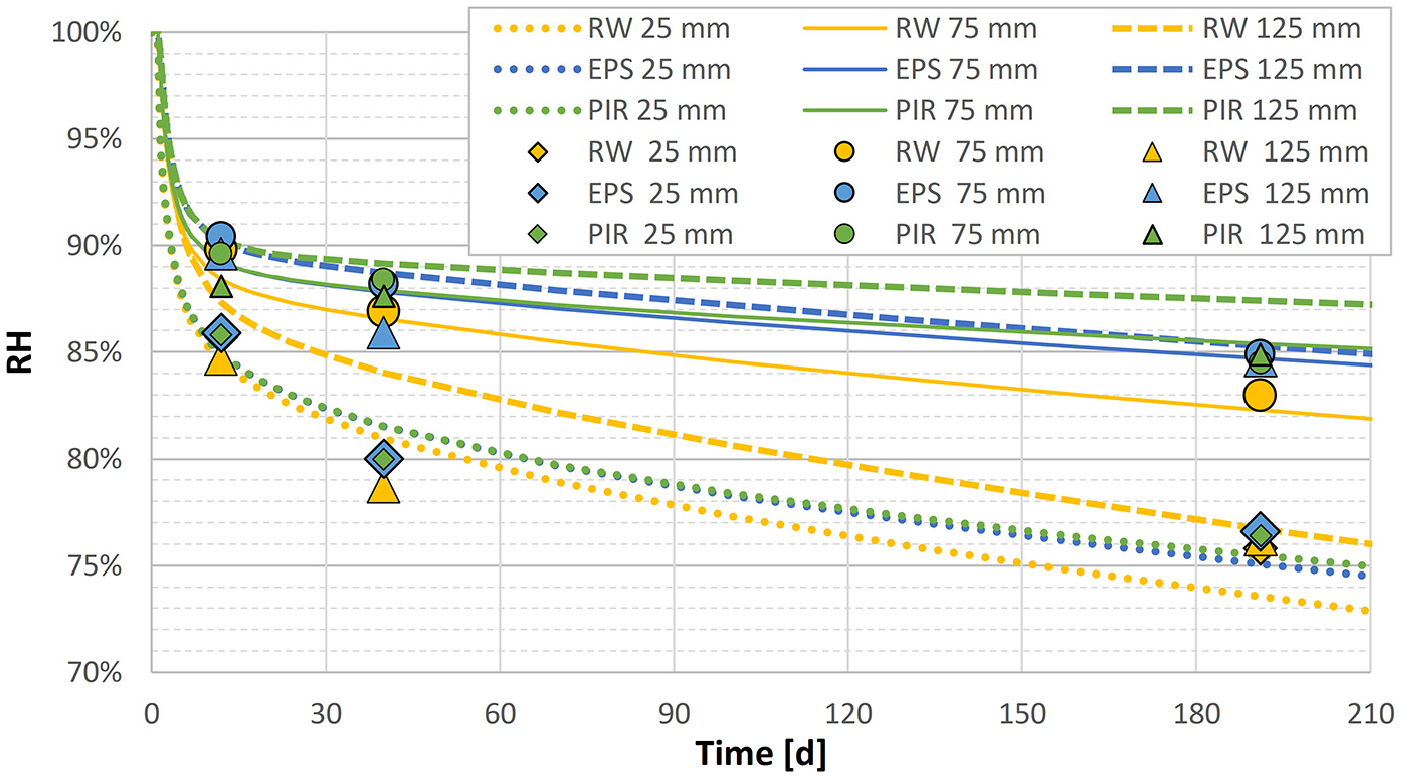
Relative humidity development in measured depths.
On the basis of measurements, the relative humidity drop is rapid in the beginning; however, rate of drying decelerates after 40 days. The relative humidity drop is around 20 percentage points near the surface and 10–15 percentage points at measurement points located deeper. In the interval 40–191 days, the relative humidity drop is only 2–4 percentage points. Since the relative humidity drop in low w/b concrete at the early drying stage is due to self-desiccation, we also performed a simulation with sealed boundaries. The relative humidity drop due to self-desiccation is shown in Figure 13.
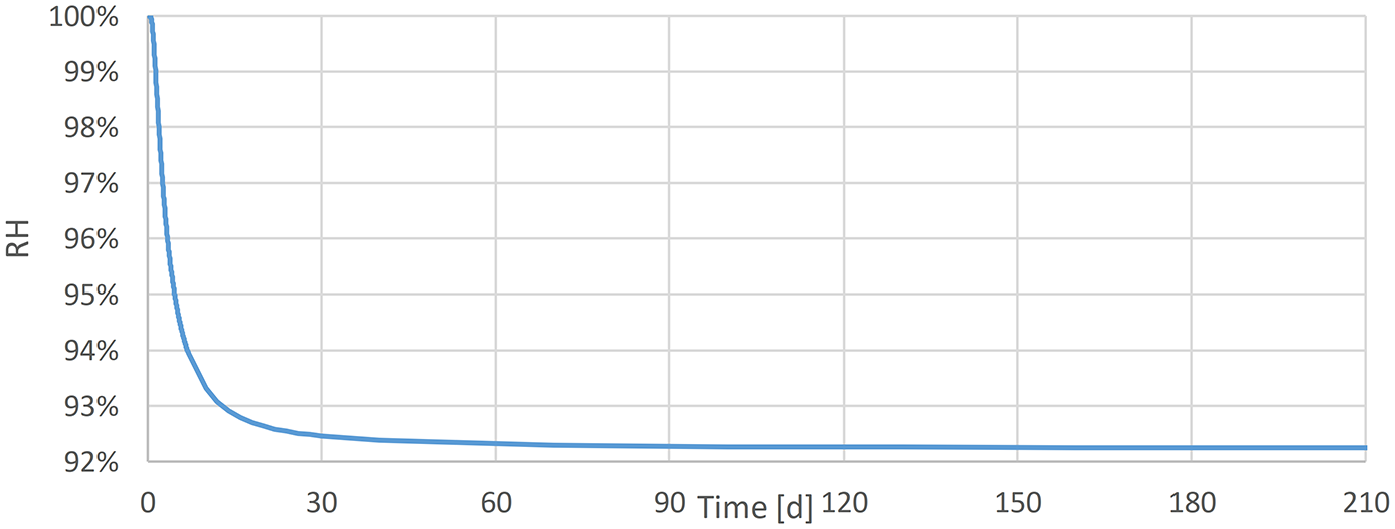
Simulated relative humidity drop due to self-desiccation (sealed boundaries).
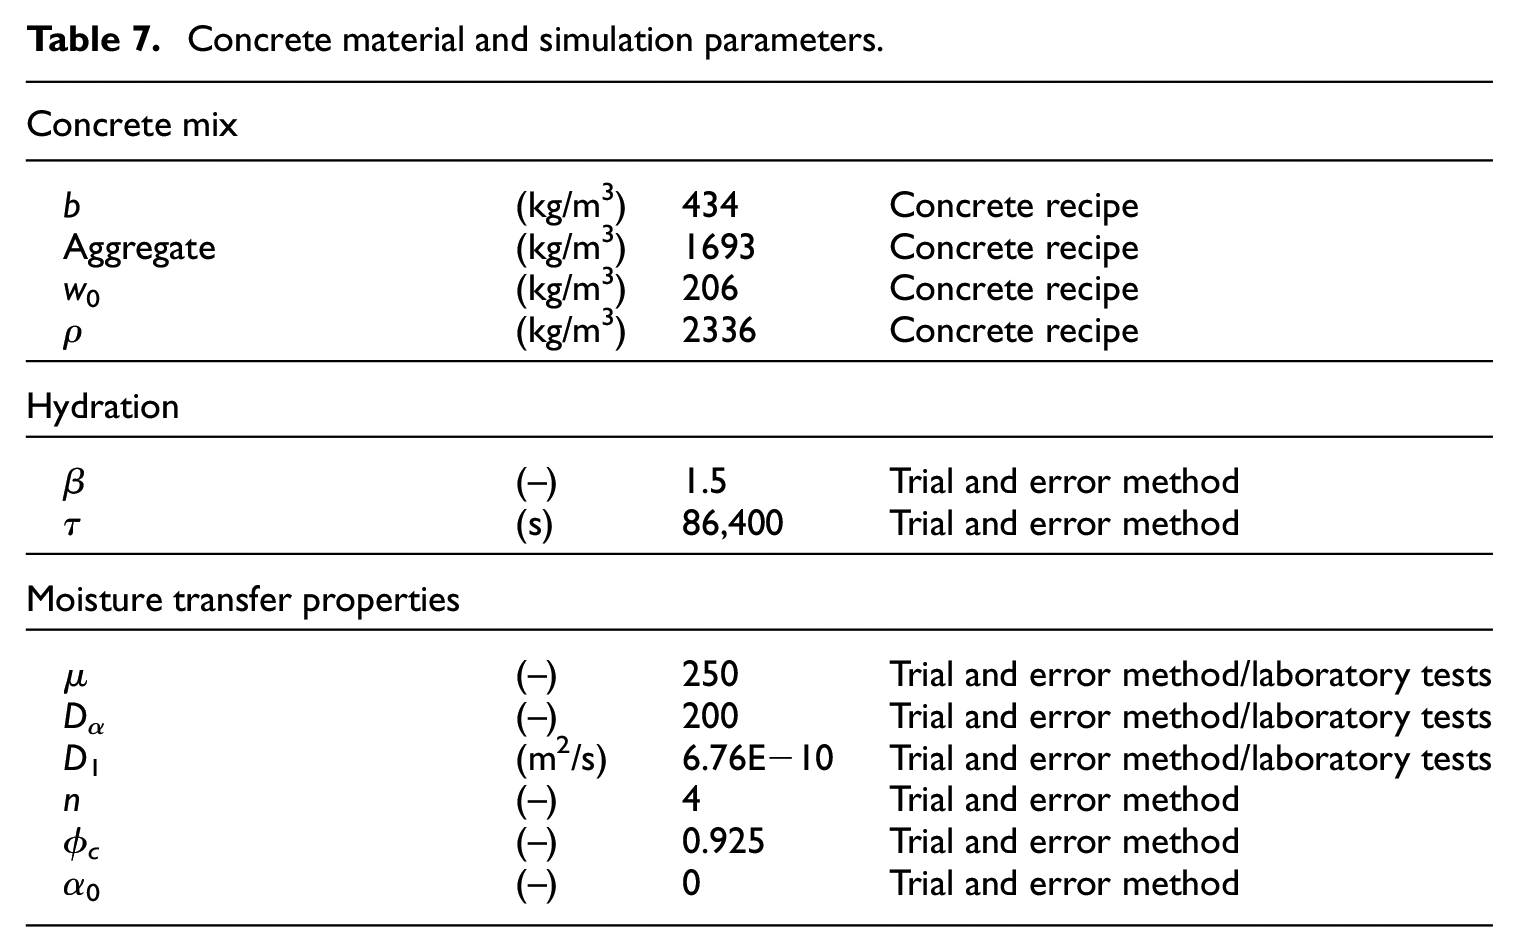
A comparison between measured and simulated values is presented in Table 6 and the estimated model and material parameters are illustrated in Table 7. The greatest error is in the RW insulated case, where the deviation rather refers to the moisture properties of RW than the material model of concrete. However, the accuracy as a whole may be considered sufficient and we deem that the error is acceptable by considering the complexity of the material properties of concrete.
Comparison between measured and simulated relative humidity.
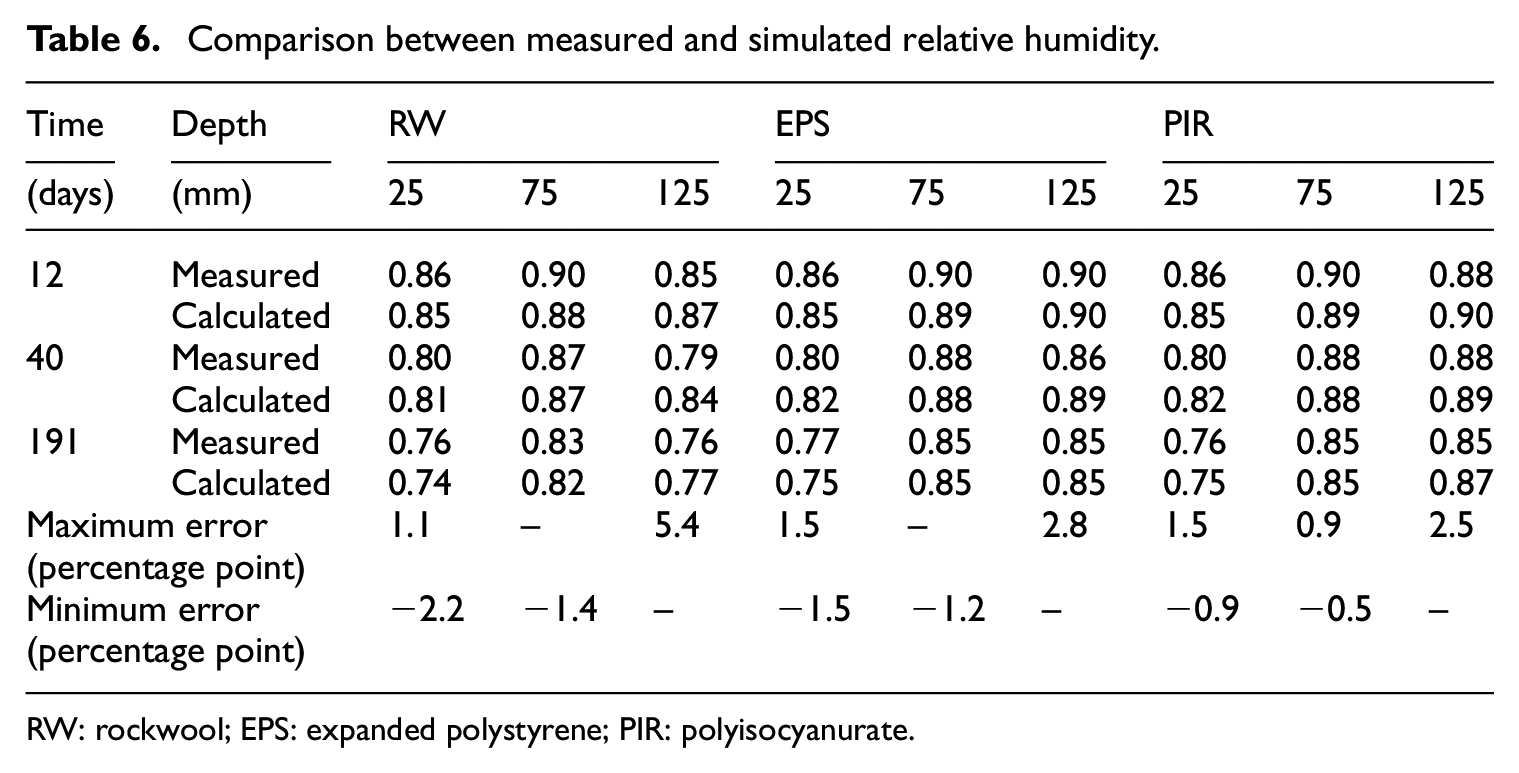
RW: rockwool; EPS: expanded polystyrene; PIR: polyisocyanurate.
Concrete material and simulation parameters.
Building phase simulation
Relative humidity in critical depths and relative humidity distribution
Based on the simulation in case C1, the relative humidity level in critical depths differs between RW and PF insulated concrete panels (Figure 14). In the beginning, self-desiccation causes a rapid drop in relative humidity. By comparing with Figure 13, we can see that also drying due to moisture transfer decreases relative humidity especially near the interior surface. After the most effective phase of hydration (0–15 days), the moisture flux boundary condition causes wetting of the concrete panel. The drying phase starts at 120 days and lasts for 60 days. The drying rate is greatest within the first 30 days.
Relative humidity development at critical depths of the building and drying phase.
The relative humidity distribution in the concrete panel with studied insulation materials before installing the finishing material is shown in Figure 15. The relative humidity distributions on the interior side of the concrete panels are similar regardless of the insulation material. Differences on the exterior side of the panels are yet notable between RW and PIR and even between EPS and PIR. As expected based on differences in vapor permeability, RW dries faster to exterior compared to EPS and PIR. With EPS, there is a decline in relative humidity toward the exterior, but with PIR, there is a slight rise in relative humidity. The moisture flux to the exterior outward is greater than the moisture flow through the PIR.
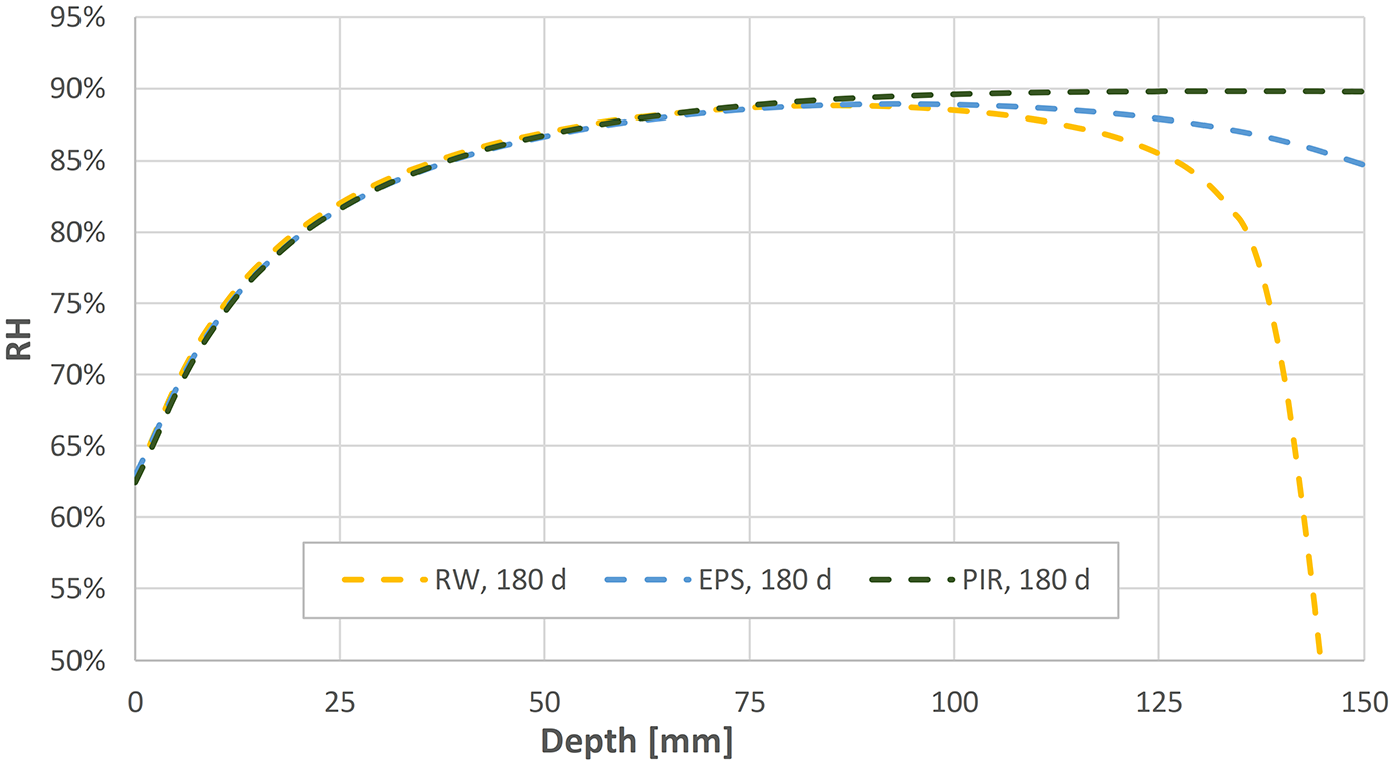
Relative humidity distribution in concrete panel with studied insulation materials before installing the finishing material at 180 days.
After installation of the finishing material, the relative humidity level on the concrete surface was evaluated (Figure 16). In case S1, the relative humidity level decreases after the initial steep rise, the lowest relative humidity value being reached with RW insulation. However, the relative humidity rises again toward the end of the simulation period. Changes after the initial rise are due to the varying interior relative humidity boundary condition (Figure 8). In case S2, there is only a minor decrease with RW and a slight increase with PIR insulation. With a more vapor tight surface in case S2, the effect of the change in the interior boundary condition is negligible.
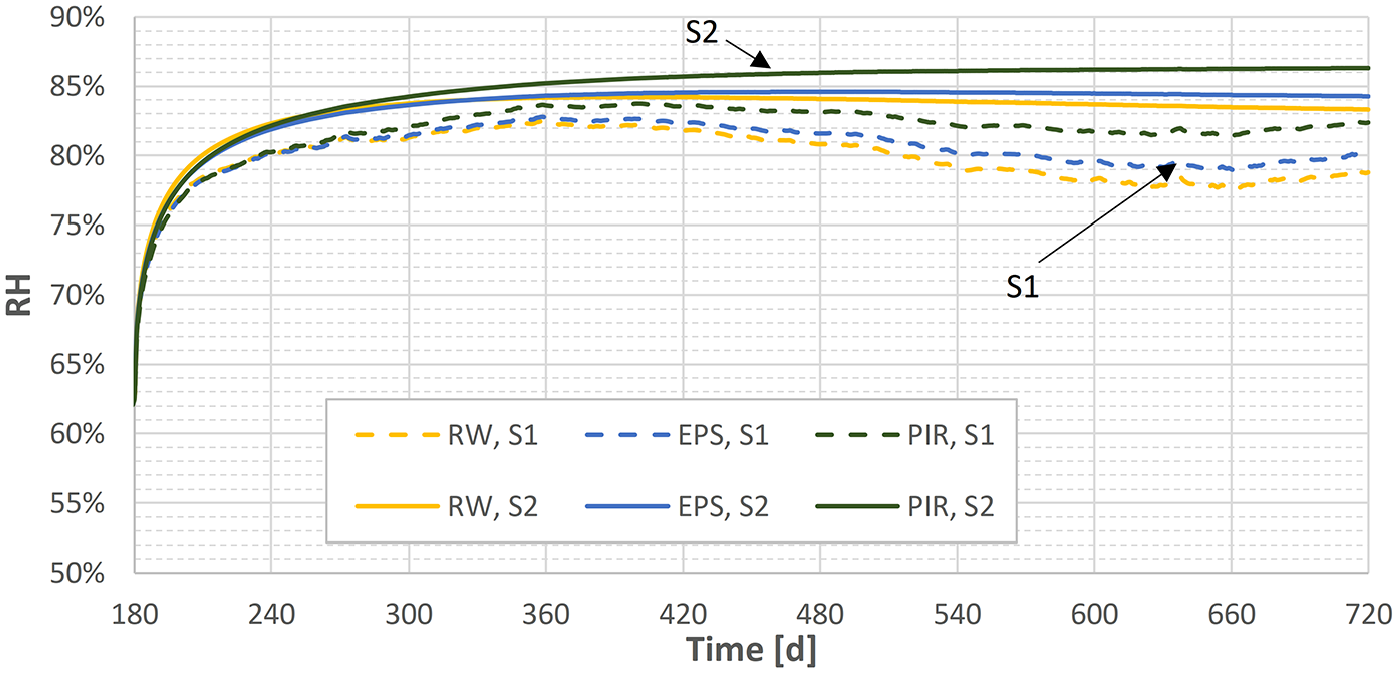
Relative humidity development on the concrete surface after applying the surface material.
The relative humidity distribution analysis (Figure 17) reveals that the relative humidity profile is flat toward the interior surface in case of S2 implying that no drying to interior occurs, whereas in case S1, there is a significant decline in the relative humidity level toward interior indicating drying of the concrete panel to the interior. The distribution toward the exterior shows the role of the insulation material. A history of the exterior relative humidity changes can be seen in relative humidity profile of the RW insulation. Even if the humid exterior boundary causes wetting part of the time, drying toward exterior through vapor permeable insulation material is predominant. The relative humidity is higher with lower permeability PF insulation materials. At 720 days, the difference in results between EPS and PIR can be seen more clearly. With EPS, there is a notable decline in relative humidity toward the exterior, but with PIR, there is a slight rise in RH.
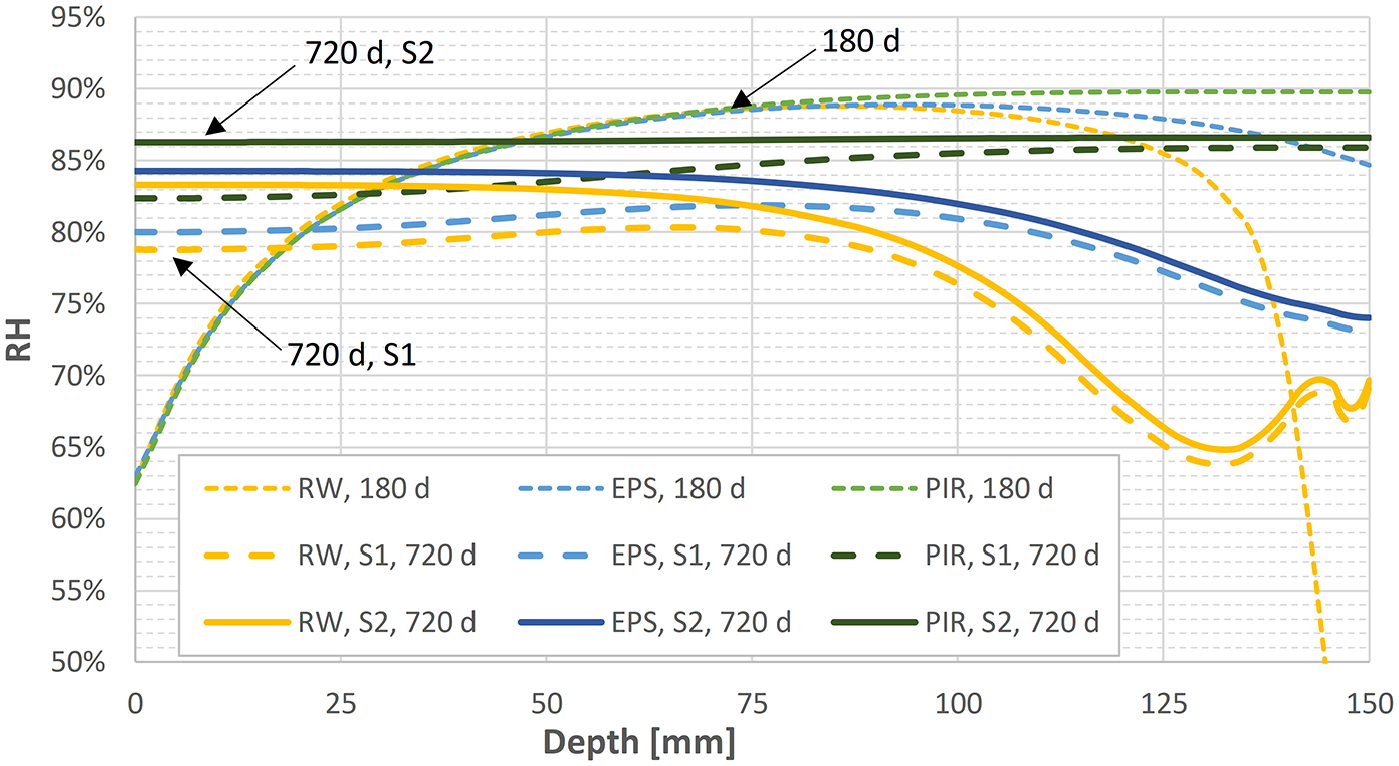
Relative humidity distribution in concrete panel before installing the surface material (180 days) and 540 days after installation (720 days).
Effect of schedule and conditions
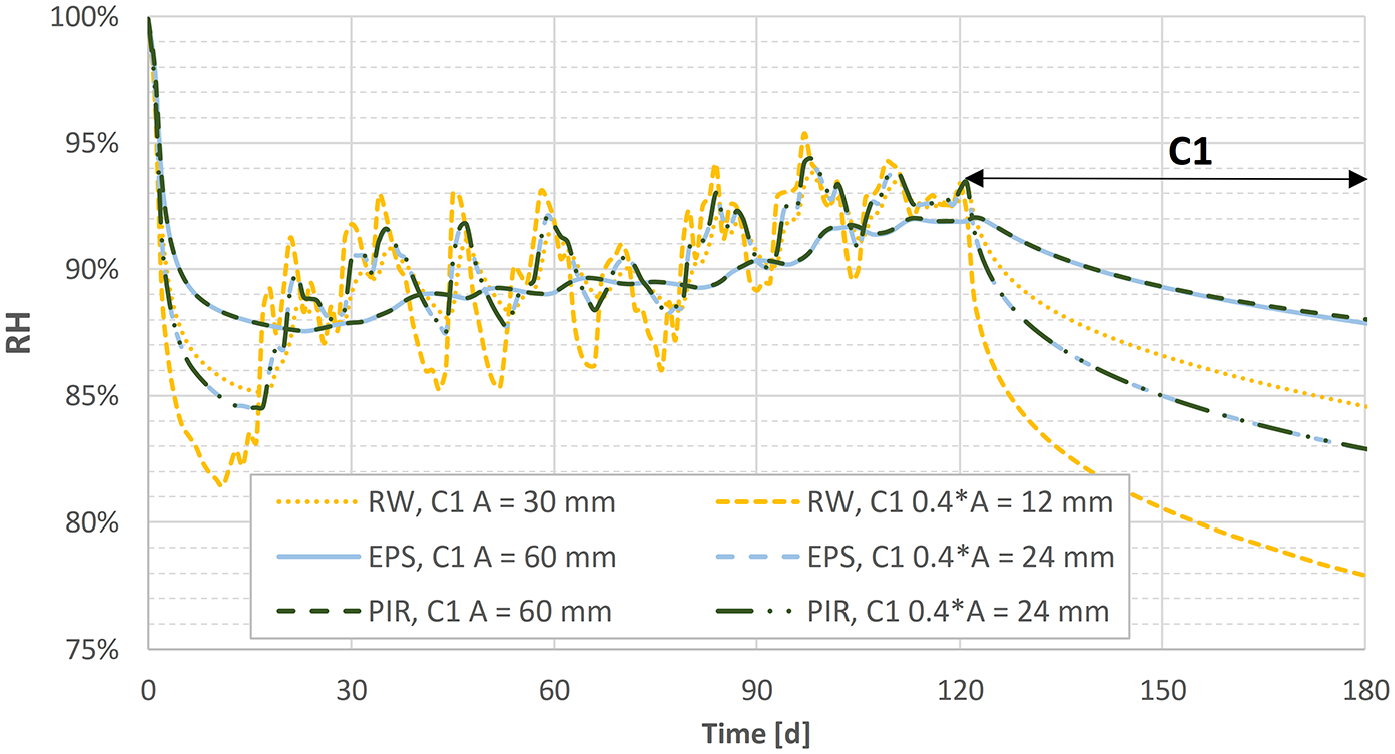
The relative humidity distribution cases C1–C3 in concrete panel with studied insulation materials before installing the finishing material are shown in Figure 18. The schedule C1 results in the highest relative humidity profiles after the drying period. Relative humidity at critical depths does not meet the criteria except in the case of RW in critical depth A. Even if the schedules C2 and C3 produce lower relative humidities, in the case of EPS and PIR, relative humidity does not meet the relative humidity criteria. A comparison of the schedules C2 and C3 shows that relative humidity in critical depths is almost the same despite the fact that the drying time in case C2 is longer; nearly the same relative humidity level of the concrete panel is achieved in case C3 with 60 days shorter total time when the humid period was 30 days shorter compared to case C2.
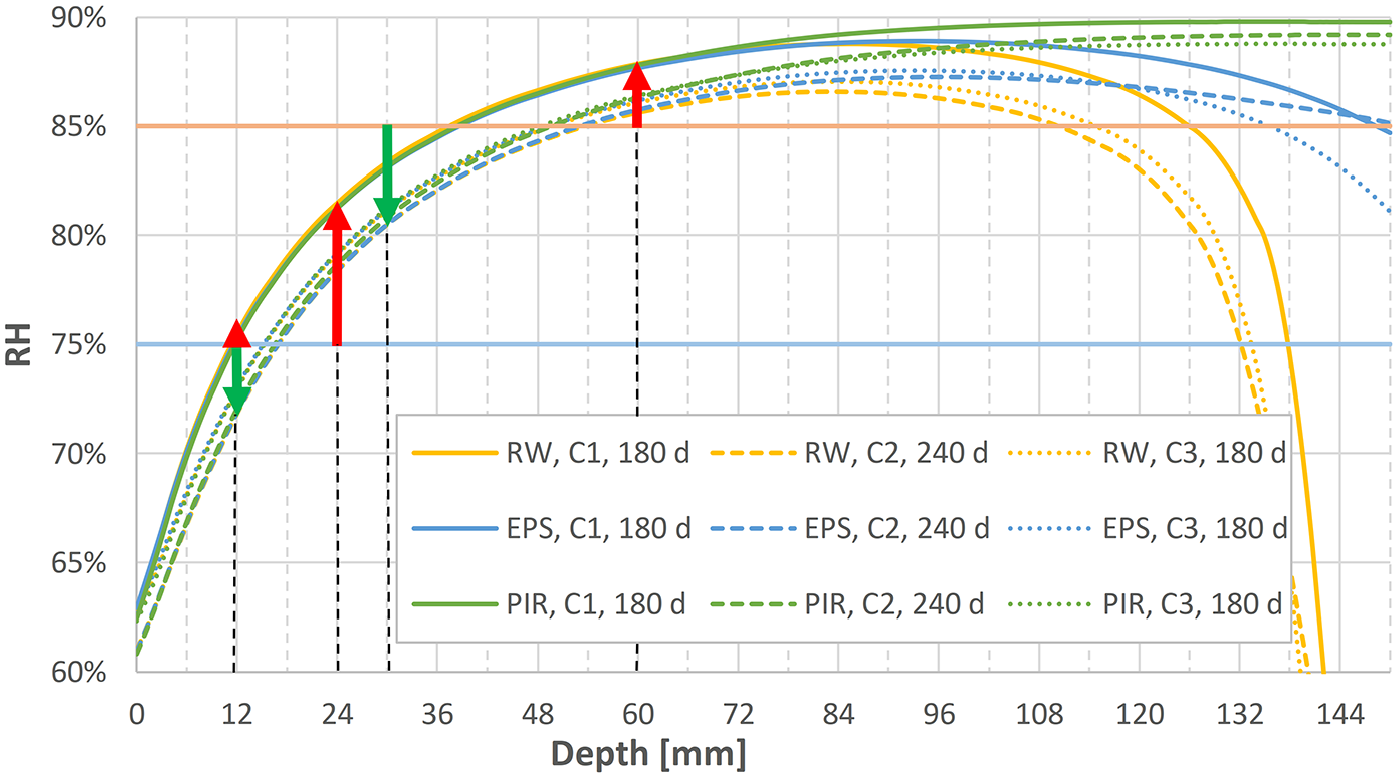
Relative humidity development in critical depths with drying conditions C2 and C3. Critical depths for RW are 0.4*A = 12 mm and A = 30 mm. Critical depths for EPS and PIR are 0.4*A = 24 mm and A = 60 mm. 75%RH is the criteria for 0.4*A% and 85%RH for A.
Because case S2 is more critical for moisture accumulation under the finishing material, comparison of studied insulation materials was executed with case S2 (Figure 19). The comparison shows that the insulation material and the schedule each have a minor effect on the highest relative humidity level under the finishing material, being around 2 percentage points of RH, whereas combining the effect of using a vapor open insulation and shortening the wetting period, the difference between the best and worst cases is approximately 5 percentage points at the end of the simulation period. It should be noted that with PIR, relative humidity does continue to rise at the end of the simulation period, and in all C1 cases, relative humidity is over the critical 85%RH and will most likely be exceeded also in cases C2 and C3. In the case of PIR insulation, no drying occurs after the surface has been installed. In cases C2 and C3, relative humidity is at lower level, and during the simulation period, no drying is clearly noticeable than in case C3 with RW insulation. By contrast, with EPS and RW insulation in case C1, drying of the concrete surface is noticeable; rise of the relative humidity beneath the surface material retards, after which the relative humidity is slowly declining.
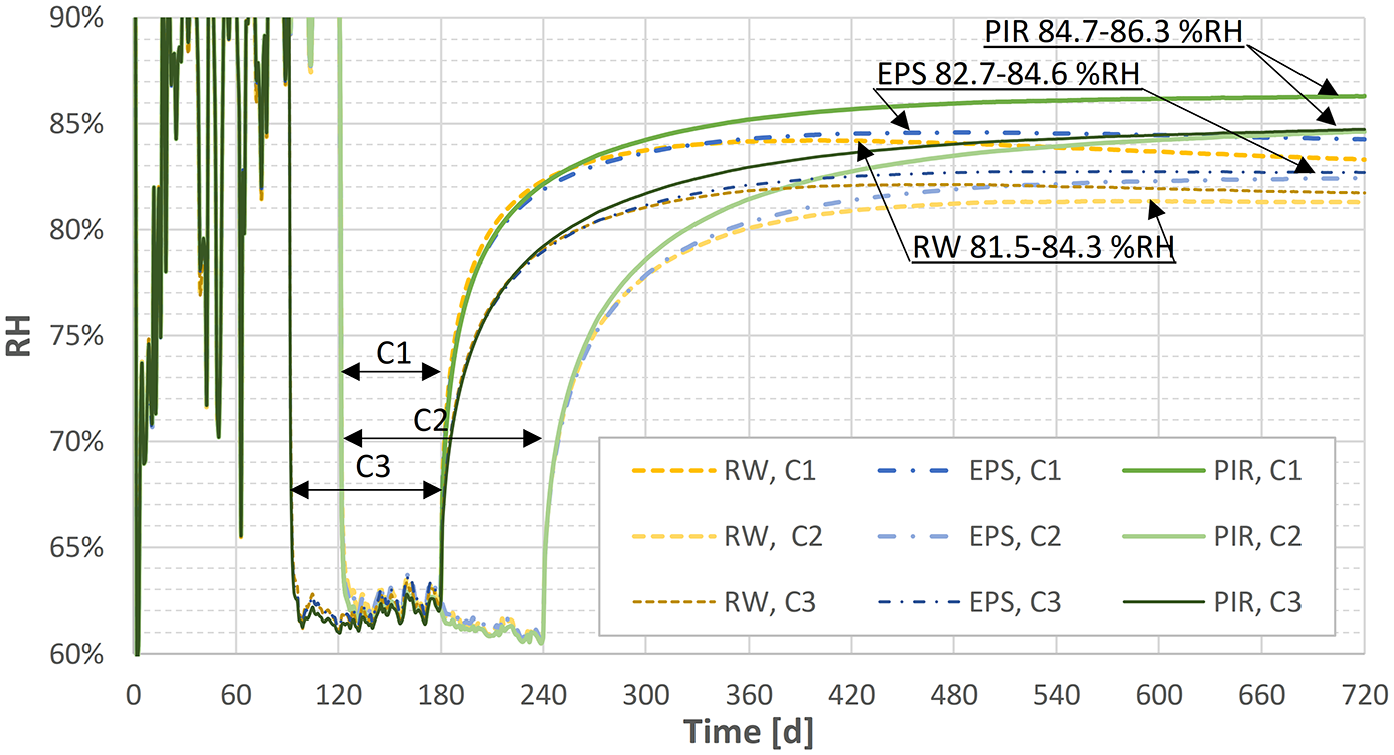
Relative humidity development of the concrete surface during building phase, drying phase, and after applying the surface material in studied conditions. Surface material type S2.
Discussion
The study shows the importance of modeling self-desiccation and changing diffusivity of early age concrete when relative humidity distribution during drying of the concrete structure is evaluated. Measured values at 12 days, Table 5, show greater decrease compared to simulated self-desiccation. However, the relative humidity drop from 40 to 191 days is only 2–4 percentage points. At the initial state of drying, diffusivity is high because of the open capillary pore structure of concrete. Diffusivity decreases rapidly as discontinuity of the capillary pore structure increases due to the hydration products (Ye, 2005). This phenomenon has been taken into account in equation (11). With combined effect of hydration and changing diffusivity, a good agreement was achieved between the simulated and the measured values.
The water binder ratio of the concrete panels is usually quite low (w/b < 0.5), and based on the measurements, the early age humidity drop is by up to 10 percentage points. In the study with no self-desiccation where a precast sandwich panel was modeled (w/b = 0.5) (Ojanen, 2017), relative humidity remained at a level of over 90%–95% on the exterior surface of the inner concrete panel for over a year, whereas in our measurements, the 90%RH level is reached in a week. Based on the studies (Ding et al., 2019; Hassan and Anderstedt, 2016; Persson, 2000, 2001; Sekki and Karvinen, 2017), our results for relative humidity measurements are in good agreement with existing information, as well as modeled relative humidity drop due to self-desiccation.
A presumption for relative humidity beneath the finishing material after the installation is below or at most the relative humidity level at the critical depth (A) before installation. Based on simulations, the presumption is most valid with PIR insulation in which the drying is purely one-sided since relative humidity did not meet the criteria and relative humidity beneath the surface material was over or was most likely to exceed the critical level of 85%RH (Figures 18 and 19).
According to the simulations, in the case of water vapor permeable insulation, the external moisture does not increase the humidity of the internal concrete structure with a ventilated facade. Rather, in the Finnish climate, the drying toward exterior is the prevailing situation. The prerequisite, of course, is that there is no water leakage from the facade to the insulation layer.
The studied structure is under constant temperature in drying phase. In future studies, the temperature dependence of drying should be investigated in order to have better predictions for drying conditions other than 20°C, since in practice the drying environment is approximately 10°C–25°C or in special cases at even higher temperatures. In addition, the effect of periodic wetting conditions in relative humidity changes in concrete requires further research.
Conclusion
The study shows that a simulation model for heat and moisture transport including concrete hydration is applicable for evaluating moisture behavior of the precast concrete panels for which the water binder ratio is low (<0.5). An important aspect considering early age concrete is the changing moisture transfer properties due to hydration. The degree of hydration dependent diffusivity provides an approach for modeling this phenomenon as the diffusivity for fully hydrated concrete at full saturation can be set as a base point.
The results of the study indicate that the external insulation material of the concrete panel has a significant effect on the final moisture level of the inner surface after installation of the surface material. However, the water vapor resistance of the surface material has a greater impact on the moisture level on the inner concrete surface. Generally in wall structures, the water vapor resistance of the finishing materials is so low that the risk from the damaging point of view is of minor importance. We also found that the criterion for applying the finishing materials occurs to be on the safe side if the vapor permeability value is in the range of EPS material or higher. At the most critical case with vapor tight insulation and finishing, in accordance with the presumption of the criterion, relative humidity beneath the finishing material is slowly approaching relative humidity at the critical depth before applying the finishing material and the critical value of relative humidity will be exceeded. Therefore, it is especially important to ensure sufficient drying of the structure if a vapor tight finishing material is used. The drying ability can be ensured using a vapor open insulation material if the interior finishing is vapor tight.
Shortening the wetting time of the structure is the most efficient means to reach the critical relative humidity level, which is fundamentally important in practice. A combination of different means, which are (1) shortening the wetting/humid period, (2) the choice of vapor open insulation, and (3) the choice of the vapor open interior finishing material, ensures a moisture safe outcome.
Footnotes
Appendix 1
Declaration of conflicting interests
The author(s) declared no potential conflicts of interest with respect to the research, authorship, and/or publication of this article.
Funding
The author(s) received no financial support for the research, authorship, and/or publication of this article.