
Abstract
The study investigated object detection and classification based on both Doppler radar spectrograms and vision images using two deep convolutional neural networks. The kinematic models for a walking human and a bird flapping its wings were incorporated into MATLAB simulations to create data sets. The dynamic simulator identified the final position of each ellipsoidal body segment taking its rotational motion into consideration in addition to its bulk motion at each sampling point to describe its specific motion naturally. The total motion induced a micro-Doppler effect and created a micro-Doppler signature that varied in response to changes in the input parameters, such as varying body segment size, velocity, and radar location. Micro-Doppler signature identification of the radar signals returned from the target objects that were animated by the simulator required kinematic modeling based on a short-time Fourier transform analysis of the signals. Both You Only Look Once V3 and Inception V3 were used for the detection and classification of the objects with different red, green, blue colors on black or white backgrounds. The results suggested that clear micro-Doppler signature image-based object recognition could be achieved in low-visibility conditions. This feasibility study demonstrated the application possibility of Doppler radar to autonomous vehicle driving as a backup sensor for cameras in darkness. In this study, the first successful attempt of animated kinematic models and their synchronized radar spectrograms to object recognition was made.
Introduction
SELF-DRIVING vehicles are capable of driving with little or no human support. A self-driving vehicle system requires the use of a variety of sensors such as camera, radar, lidar, and sonar to detect surrounding environment. Although significant progress in autonomous vehicle driving has been made in the past 5 years, there are still several challenges to overcome for fully autonomous vehicles driving in bad weather conditions or at night. A decrease in the range of visibility for camera sensors in darkness or in bad weather conditions has triggered a need for new solutions. Additionally, the strength of returned radar signals from distant moving targets is not high enough to guarantee fully autonomous vehicle driving. Therefore, a combination of different types of sensors along with artificially intelligent technology is essential to identify various driving configurations more clearly.
Convolutional neural networks (CNNs) are widely used to detect and classify objects in images. The high accuracy of object classification achieved using CNN technology has created new opportunities for different applications such as autonomous vehicles, intelligent robots, and disease diagnosis. In 1990, investigation into the modern framework of CNNs was begun and subsequently improved by LeCun et al. 1,2 They attempted to classify handwritten digits using the deep artificial neural network called LeNet-5. However, a combination of the lack of a training data set and poor computing performance led to less significant achievement in image classification. Since 2012, many CNNs have been developed to solve several challenges in image classification. Most notably, the deep neural network AlexNet, 3 developed by Krizhevsky et al., demonstrated a significant improvement on it. This network was similar to LeNet-5 but possessed a deeper structure. With the success of AlexNet, a variety of CNNs have been proposed and superior object classification performance has been achieved because of their deeper structures. The most significant works were ZFNet, 4 VGGNet, 5 GoogLeNet, 6 and ResNet. 7
This present study employed Darknet 53 as a backbone CNN for You Only Look Once (YOLO) V3. CNNs used for object detection and classification can be divided into three main categories. The first is the region-based CNN type, the second is the single-shot multibox detector type, and the third is the YOLO type. Recently, YOLO has attracted a lot of attention in relation to artificial intelligence. YOLO 8 has recently been employed in the direct prediction of class labels, a process called single pipeline detection. Detection by YOLO is achieved in one evaluation with a single network, which predicts bounding boxes and class probabilities from the full image. A low-accuracy small object detection YOLO problem was solved using a logistic classifier and a more sensitive detector with smaller anchor boxes.
In this present study, object detection and classification of a walking human and a bird flapping its wings was conducted using both Inception V3 and YOLO V3, based on Doppler radar spectrograms and vision images. The task required the creation of synchronized radar–vision images to train the networks. To implement this, a dynamic simulator programmed using MATLAB was introduced, which could animate the kinematic models for both objects. An ellipsoidal kinematic element was used to define each body segment of each of the objects. In the case of the bird, the model was composed of five segments, five trajectories, and five reference points. The model could be used to identify the change in the flapping angle of the bird’s wings. The coordinates of the reference points were updated by the addition of the bulk motion of the bird with the change in flapping angle at each sampling point. Boulic et al. 9 and Chen 10 previously proposed a walking human kinematic model. The gait was finally animated by using the change in the coordinates of the reference points which were identified using the translational and rotational equations of motion based on empirical parameterization using biomechanical experimental data.
A change in position in each segment caused a returned Doppler radar signal frequency shift. Oscillation induces a change in frequency modulation in the signal returned from a moving target, a phenomenon called a micro-Doppler signature (MDS). This occurs when the target or any of its structural components (or body segments) experiences rotational motion in addition to bulk motion. Different MDSs can be captured for each target using Doppler radar because of the different physical characteristics of the motion of each target’s individual segments. This is the reason that the radar is receiving more attention from researchers working within various areas of engineering. A comprehensive review 11 of the importance micro-Doppler applications was presented based on subject type, sensor capabilities, and environmental effects, and its future research areas were discussed. Cao et al. 12 presented a good qualitative achievement in the classification of ground targets based on radar MDSs using a deep CNN. The study 13 proposed a method of detecting a human based on their physical characteristics using Doppler radar. Kim and Moon 14 used CNNs for the detection of humans and the classification of their activities based on Doppler radar. In the article, 15 MDSs were extracted using Doppler radar and different types of hand gestures were identified using a CNN. Kim et al. 16 attempted to use MDSs to estimate energy expenditure in human walking and running activities. Such experimental research, which lacks a deep understanding of the kinematics of moving targets, has obvious limits in terms of understanding MDS for targets composed of different body structures and in terms of creating data sets with sufficient synchronized spectrogram–vision images for training the CNN. This is one of the reasons that the simulation approach proposed in this study represents a significant contribution. Furthermore, the first step in applying their synchronized radar–vision images created by an animation simulator to object recognition was achieved in this study, which is considered as one of a series of future studies including an experimental approach.
This investigation is focused on classifying two moving targets using CNNs based on vision images and radar spectrograms which require radar signal frequency shift analysis using a short-time Fourier transform (STFT) with a time window sliding application along the returned signal from the targets. A combination of a black background and dark object red, green, blue (RGB) colors simulated nighttime conditions with low-illumination intensity. The simulations conducted as part of this study indicated that accuracy in the MDS-based classification was high enough for clear target recognition independent of the low-illumination intensity provided by the surroundings.
Kinematic models
It is not easy to animate the motions of creatures. To create accurate kinematic models for them, a huge amount of experimental data on their actual motions must be collected. The motions of humans have been investigated for a long time so that it has enabled researchers to build empirical equations. Regarding the bird’s model with only four joints, its simplicity is why it was chosen as a test object for this study.
Human model
Human gait has been investigated for the past two decades. 17 Boulic et al. 9 proposed a global kinematic model for human walking based on empirical mathematical parameterization using biomechanical experimental data to evaluate the kinematic parameters of each segment of the human body. Chen’s model, 10 based on the advances made by Boulic et al., consisted of 16 segments, 17 trajectories, and 16 reference points (see Figure 1). Every single segment possessed one or two reference points. It could describe human walking motion over repeated cycles by identifying the final position of each of the segments at u. The empirical equations and the experimental data on rotational and flexing angles of the trajectories introduced by Chen 10 were applied in this section.

A walking human model with 17 trajectories and 16 reference points.


where


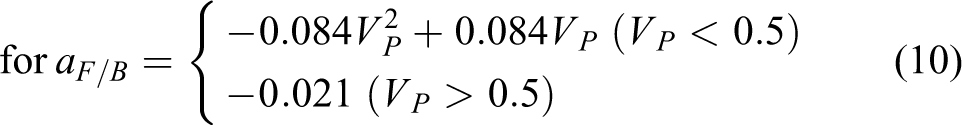


where TrV(u) is the vertical translation offset of the center of the spine from the origin of the spine at u. Tr L (u) is the lateral translation offset of the center of the spine from the origin of the spine at u. Tr F/B (u) is the forward/backward translation offset of the center of the spine from the origin of the spine at u during a forward step onto one of the legs along with its stabilization. VP is the relative velocity of the human. S is the duration of support.
The three angles in the


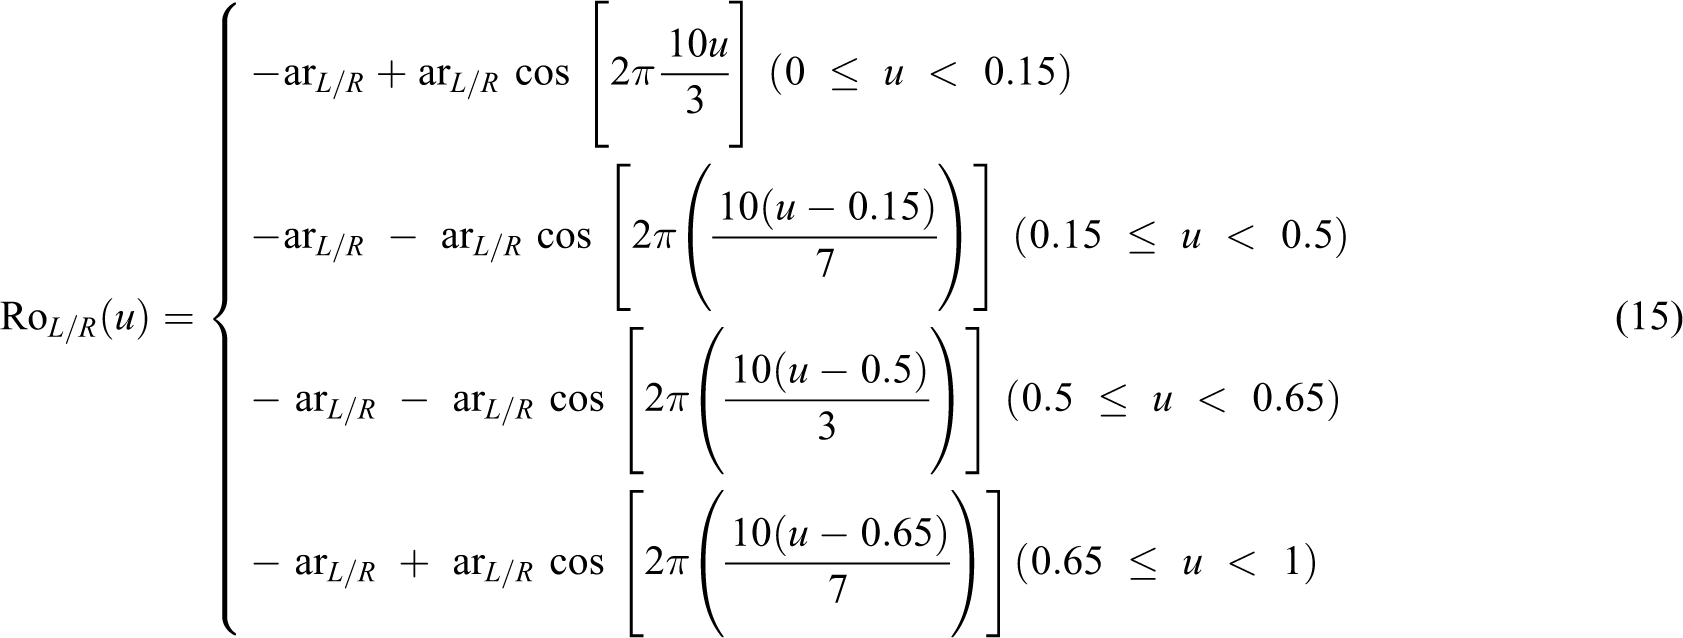


where Ro V (u) is the rotational movement of the back of the body relative to the pelvis at u that occurs before each step to enable the forward motion of the leg. Ro L/R (u)is the rotational movement at u that causes the pelvis to fall on the side of the swinging leg. Ro T (u)describes the pelvis’s rotation relative to the spine to enable a step at u


where Ro S (u)is the flexing angle of the shoulder.
Regarding the rotational angle input data for the thorax and the flexing angle input data for the thorax, the hip, the knee, the ankle, and the elbow from the extra experiments, the simulator built a piecewise function using the subequations defined differently between each of the neighboring control points through one cycle based on different values for VP (see ref. 10 ).
The coordinates of the reference points
The input parameters for the human walking simulation.

RGB: red, green, blue.
In Table 1, a, b, and c represent the length of the three semiaxes of each ellipsoidal body segment (see Figures 1 and 2) in the X, Y, and Z directions, respectively.

A bird kinematic model with five trajectories and five reference points. (a) The mid-point coordinate of the body. (b) A flapping bird model.
Bird model
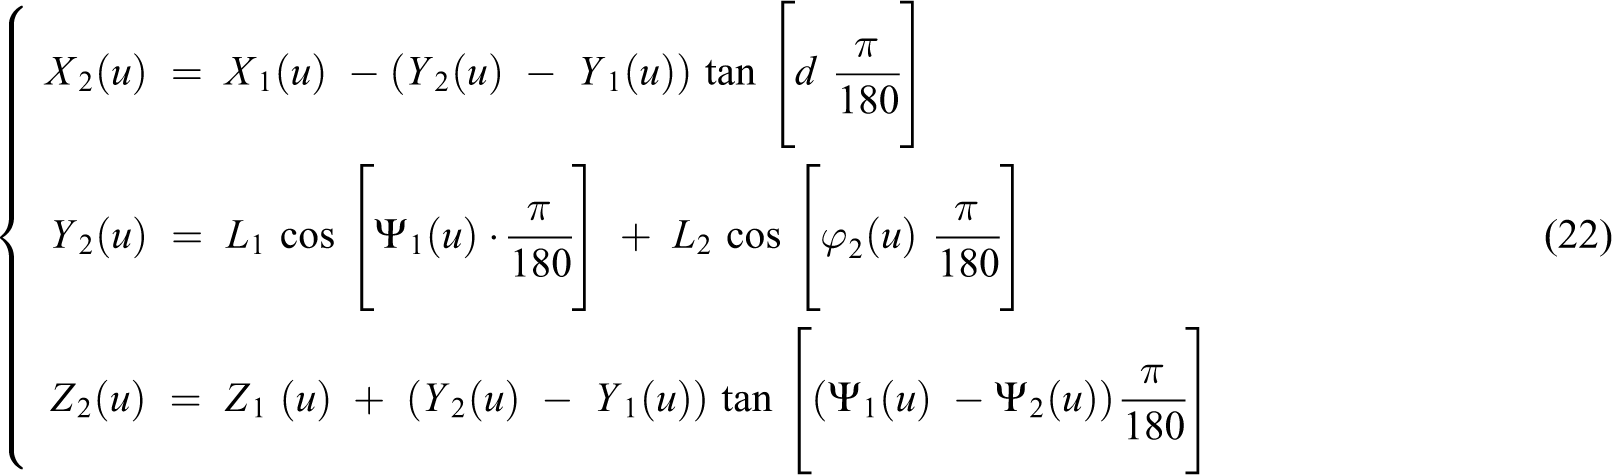
The bird model proposed by Chen 10 was applied in this present study. It describes a bird’s flight by describing the change in the flapping and twisting angles of its wings and requires five segments, five trajectories, and five reference points. The position of the tips of the wings (m) are identified using equations (21)–(23)

and


and


(X1(u), Y1(u), Z1(u)) is the position of the tip of the upper arm at u. (X2(u), Y2(u), Z2(u)) is the position of the tip of the forearm at u. Vb (m/s) is the forward translational velocity of the bird. L1 (m) is the length of the upper arm. L2 (m) is the length of the forearm. d(u) is expressed in degrees. Ψ1 (u) (degrees) is the flapping angle of the upper arm. Ψ2 (u) (degrees) is the flapping angle of the forearm. φ2 (u) (degrees) is the twisting angle of the forearm. A1 (degrees) is the amplitude of the flapping upper arm. A2(degrees) is the amplitude of the flapping forearm. C2(degrees) is the amplitude of the twisting forearm. fflap (Hz)is the flapping frequency. Ψ10 (degrees) is the lag in the flapping angle of the upper arm. Ψ20 (degrees) is the lag in the flapping angle of the forearm.
The center
The input parameters for the bird flapping simulation.

Doppler frequency shift
If the body segment of a moving target experiences rotational motion in addition to bulk motion, the total motion will induce a micro-Doppler effect. The returned signal frequency (or wavelength) will change due to the relative motion of the body segment and will create a different MDS. When a target is moving, the micro-Doppler frequency shift in the MDS can clearly be observed in the time–frequency space 12,18 and the STFT (see (30)) can thus be used as a powerful tool to characterize the MDS. Therefore, MDS-based images can be used to classify different types of features

where x(u) (Hz) is the returned radar signal frequency for each segment at u. dis(u) (m) is the distance between the radar and the target body segment. λ (m) is the wavelength of the given radar signal
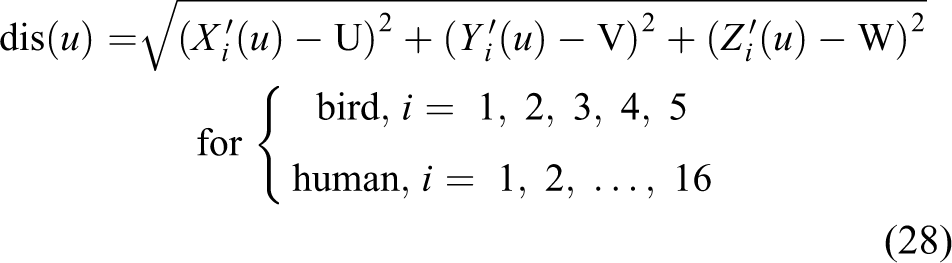
where (U, V, W) (m) is the fixed radar location. RCS (u) is a measure of the strength of the target’s reflectivity and is a function of the target’s orientation and the transmitted radar frequency. The RCS (u) for a simple geometric shape such as a sphere, an ellipsoid, or a cylinder can be expressed by the mathematical formula (29). In this study, an ellipsoidal geometric shape is considered. In equation (29), (degrees) is the incident aspect angle. φ (degrees) is the azimuth angle

The time window sizes of 0.55 s and 0.40 s were applied to the human and the bird model, respectively. Regarding the sliding steps, 1/1500 s was required for the human and 1/2048 s was required for the bird to capture specific MDSs in the Doppler domain. The number of frames per cycle was 1500 for the human and 819 for the bird. The time–frequency shift of the returned radar signal (equation (30)) could be analyzed based on x(u) and it provided spectrograms of the targets as shown in Figures 11(d) and 12(d)

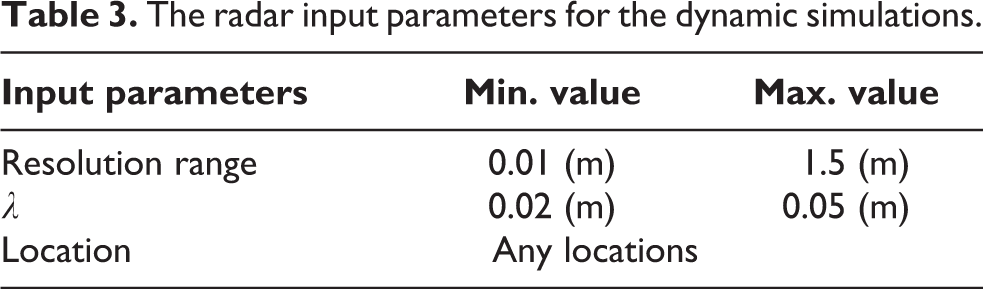
where t(s) is the total duration of time and f (Hz) is the incident frequency of the radar. The MDS simulation required the radar information as noted in Table 3.
The radar input parameters for the dynamic simulations.
Verification of Doppler frequency shift
Boulic et al. 9 proposed a global human walking model and the MDS analysis was implemented by Chen 10 (see Figure 3(a)). The analysis was performed when the human was walking toward the radar, taking the front view of the human into consideration. The original distance between the radar and the center of the target human was 10.0 m and the Doppler radar was located 2.0 m above the ground. The height of the human was 1.8 m. Vp was 1.0 (m/s) and λ was 0.02 (m). The number of frames per cycle was 2048. Figure 3 shows a comparison of the MDS analysis results by Chen 10 and by this present study, respectively.

A comparison of the MDS analysis results. (a) An MDS analysis of a walking human by Chen. (b) An MDS analysis of a walking human performed as part of this study. MDS: micro-Doppler signature.
This present study employed each ellipsoidal body segment size as shown in Figure 4 for the computation. The comparison ensured that the human kinematic model functioned effectively and that a good qualitative STFT analysis was performed as part of this study.

The human model used for the verification of Doppler frequency shift.
Feature extraction and object classification using CNNs
To identify different targets using MDS, distinct features have to be extracted. CNN is one of the most successful learning algorithms used to extract distinct features from images. Feature extraction was used in the studies 12,14,15 for the classification of target species. In this present study, Darknet 53, a feature of YOLO V3, was responsible for learning the features of the vision images, and Inception V3 was used for feature extraction of the MDS-based images.
The kinematic models of the targets were simulated using MATLAB to create the vision images. At each u, the returned radar frequency from the targets was calculated for the MDS identification, a process that was performed using an STFT. The process implemented within the dynamic simulator, as shown in Figure 5, completed the creation of the input data set for object detection and classification. YOLO V3, which was applied in this study, was pretrained on the Common Objects in Context data set containing 118,287 images and 80 classes. Both CNNs were retrained on images with white backgrounds (RGB = [255,255,255]) for application of the transfer learning technique (TLT). Inception V3, which was applied to the MDS-based image classification, was pretrained on the ImageNet Large-Scale Visual Recognition Challenge data set provided by ImageNet, containing 1.2 million images.
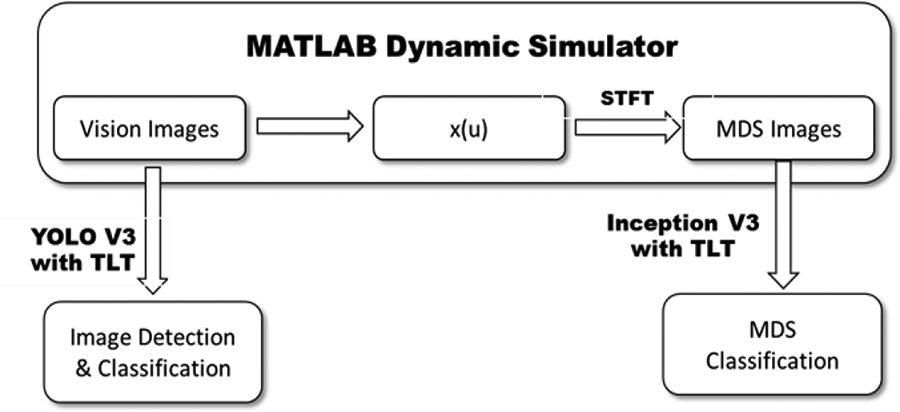
The main CNN-based feature extraction process. CNN: convolutional neural network.
Figure 6 shows the process used to compute the mean average precision (mAP) and the object classification accuracy using YOLO V3 and Inception V3, respectively. Figure 7 shows the architecture of YOLO V3, including Darknet 53 (see B4). The hidden architectures of each resblock_body, and block A and block B are displayed concretely in B3 and B5, respectively. Block A includes hidden layers and a fully connected layer after the backbone CNN and Darknet 53 (B4) before the block B in YOLO_BODY (B6). Block B performs YOLO object detection by creating output feature maps in its last fully connected layer for the three different scales. Each color used in the layers in Figures 7 and 8 indicates a different function (see Figure 8). B7 in YOLO V3 takes the features from the final layers in B6 and converts them into the five parameters for the bounding boxes. It computes the bounding box confidence score and class probability if an object exists. B8 imports the bounding box coordinates for every single object from a given annotation file. B9 takes the parameters from B7 and computes the bounding box scores (class confidence scores) based on the product of the bounding box confidence score and the class probability. Application of a nonmaximal suppression technique in B10 generates a final bounding box out of the predicted bounding boxes around the detected object in the input image. B11 creates the predicted annotation file to be compared with the given ground truth, and intersection over unions are computed in B12. The YOLO loss function which is introduced in B13 is defined by a combination of a localization sub-loss, a box confidence sub-loss, and a classification sub-loss for each final bounding box. The detector in the network has three differently sized anchor boxes. It enables high precision detection of smaller objects. The TLT applied in YOLO V3 was performed in the last two convolutional layers in B3 at the final repetition. Figure 8 shows the architecture of the Inception V3 and the grid size-reduction blocks reducing the loss of information due to the single application of the max-pooling between the three distinct modules. The TLT was applied in the last three layers. Common options for the two CNNs include batch normalization, Xavier initialization, ADAM optimization, and a dropout of 0.3 and 200 epochs. ReLu and linear activation functions, a SoftMax classifier, a cross-entropy loss function, a learning rate of 0.01, and a batch size of 32 were applied in the case of Inception V3. Leaky ReLu and linear activation functions, a logistic classifier, the YOLO loss function, a learning rate of 0.03, and a batch size of 8 were applied in the case of YOLO V3. Each data set for the networks was split into training, validation, and test data sets. The YOLO V3 data set consisted of 800 training and 200 validation images. They incorporated an object RGB of [185,185,185] and a white background RGB = [255,255,255]. The mAP test data set for Figure 12 contained 150 images for each background RGB color. For the classification accuracy computation (see Table 4), 150 images with white backgrounds and object RGB = [50,50,50], 150 images with black backgrounds and object RGB = [50,50,50], and 150 images with black backgrounds and object RGB = [5,5,5] were used. The Inception V3 data set contained 800 training, 100 validation, and 100 test MDS-based images.

The mAP and classification accuracy calculation process used by the neural networks. mAP: mean average precision.

The architecture of YOLO V3. YOLO: You Only Look Once.

The architecture of Inception V3. N× module in the figure means that the module repeats N times.
Classification results using YOLO V3 and Inception V3.

YOLO: You Only Look Once; RGB: red, green, blue; MDS: micro-Doppler signature.
Figure 9 shows the training and validation losses computed using YOLO V3 and Inception V3, respectively. Two hundred epochs were sufficient to complete each network’s retraining and validation to obtain fine-tuned weights and to achieve an accuracy of 100%. This was achieved in the case of the classification for white backgrounds using YOLO V3 as well as using Inception V3 (see Table 4).

Training and validation losses. (a) The change in the training loss computed using YOLO V3. (b) The change in the validation loss computed using YOLO V3. (c) The change in the training loss computed using Inception V3. (d) The change in the validation loss computed using Inception V3. YOLO: You Only Look Once.
Results and discussion
Both CNNs were employed to detect and classify the walking human and the bird flapping its wings using the vision images and the spectrograms animated using the MATLAB simulator. Figures 10 and 11 show the simulation results for both targets. It is clear from Figures 10(b) and (c) and 11(b) and (c) that targets with small object RGB values on black backgrounds were not clearly distinguished from their backgrounds. The Doppler radar created identical signatures for the same targets from the ones in the vision images, regardless of low visibility of the targets (see Figures 10(d) and 11(d)). The next step, the object classification task using the CNNs, was transformed into an image recognition problem. First, the mAP analysis of the vision images (see Figure 12) was conducted. It illustrated that the computed mAPs for the two targets with object RGB = [185,185,185] on a white background were 1.0. However, mAPs computed for the same objects decreased when the background color was black. It suggested the need for new solutions to achieve superior performance of the vision image-based object detection and classification system when applied in darkness.

The MATLAB simulation results for the bird model. (a) A simulation of the bird with a white background and object RGB = [50,50,50]. (b) A simulation of the bird with a black background and object RGB = [50,50,50]. (c) A simulation of the bird with a black background and the object RGB = [5,5,5]. (d) An identical MDS of the same bird with different object and background RGB colors. RGB: red, green, blue; MDS: micro-Doppler signature.

The MATLAB simulation results for the human model. (a) Simulation of the human with a white background and an object RGB = [185,185,185]. (b) Simulation of the human with a black background and an object RGB = [50,50,50]. (c) Simulation of the human with a black background and an object RGB = [5,5,5]. (d) An identical MDS of the same human with different object and background RGB colors. RGB: red, green, blue; MDS: micro-Doppler signature.
The object classification of the given vision images and the spectrograms was made (see Table 4) using the CNNs. In the case of an object RGB of [5,5,5] and a black background, vision image-based detection was not achieved for the human. In contrast, the MDS image-based object classification achieved 100% accuracy regardless of the large change in degrees of visibility of the objects on their backgrounds. The results demonstrated the potential to solve object detection problems that were due to poor visibility, a decrease in vision range, or even zero visibility due to darkness.

The mAP calculated using YOLO V3 for the vision images with the white (left figure: RGB = [255,255,255]) and the black (right figure: RGB = [0,0,0]) backgrounds. YOLO: You Only Look Once; RGB: red, green, blue; mAP: mean average precision.
Conclusion
In this study, the first application of the animated kinematic models and their synchronized MDS describing a walking human and a bird flapping its wings to object recognition was made. MATLAB dynamic simulator was used to process the effect due to the size of each ellipsoidal body segment, the change in velocity of the targets, the varying object and background color considerations, and the radar locations to enable a variety of animations of the specific motions of the objects to be implemented. As the targets were moving, the spectrograms created by the STFT analysis of the returned radar signal were used to identify their motion. The vision image-based classifications made against the black background were unsuccessful as both of the objects were not clearly detected or classified by YOLO V3. This was due to the small difference in pixel values at the border between the object and the background. However, the MDS-based images enabled the accurate classification of the objects under the aforementioned conditions. The MDS image-based classification using the Inception V3 achieved 100% accuracy, which was clearly higher than the accuracy of the vision image-based classification. The experiments with Doppler radar spectrogram will be incorporated into a series of future studies. Chen’s kinematic models for both the human and the bird were analyzed and simulated using MATLAB. The human model supported translational and rotational motion of each of the body segments, so that a natural human walking motion could be animated. It controlled 18 different input parameters describing human body segment size, forward velocity of the body, object and background RGB colors, and radar-related information. The bird model required rotational motion of each body segment to describe the flapping of the bird’s upper arm and a combination of flapping and twisting angles for the forearm. The final position of each body segment was updated by adding the rotation to the translation at each u. The different spectrograms for each of the targets were captured using the STFT taking a variety of input parameters into consideration. The human MDS-based images created in this study and those by Chen
10
were compared to confirm the validity of the STFT analysis results. The comparison clearly demonstrated that the two spectrograms showed good qualitative agreement. The YOLO V3 used for the vision image-based detection and classification and the Inception V3 used for the MDS image-based classification were then introduced. It was clear that the mAP of 1.0 was achieved for the targets when the object RGB was [185,185,185] on a white background, whereas the object RGB of [185,185,185] for the human on a black background decreased the mAP computed by YOLO V3 to 0.86. This suggested that vision image-based detection and classification in darkness produced undesirable results. Regarding the accuracy of the classification, the YOLO V3-based classification still demonstrated a good qualitative accuracy of 100% in terms of the classification of targets when the object’s RGB values were [50,50,50] on a white background. However, the low visibility of the objects on black backgrounds dropped the classification accuracy dramatically from 97.3% to 46.7%, and detection was not achieved in the case of the human object in the lowest visibility condition (RGB values of [5,5,5]) on a black background. However, the MDS image-based classification results demonstrated the classification accuracy of 100% for both targets regardless of their low visibility. It suggested that the visual information did not have any effect on the STFT analysis results. This feasibility study showed promise for the successful future development of a strong backup sensor for camera-based autonomous vehicle driving and showed that Doppler radar performs excellently in the detection of specific movements in the absence of light.
Footnotes
Declaration of conflicting interests
The author(s) declared no potential conflicts of interest with respect to the research, authorship, and/or publication of this article.
Funding
The author(s) disclosed receipt of the following financial support for the research, authorship, and/or publication of this article: This research was supported by King Mongkut’s Institute of Technology Ladkrabang (KMITL) of Thailand (grant number: KREF 186311); and the grant-in-aid of HANWHA SYSTEMS, South Korea.