
Abstract
To better monitor the state of isolating switches, an efficient binocular vision-based state measurement system is proposed in this article. Two optimal cameras are selected as the vision of our inspection system. Firstly, stereo calibration and distortion rectification are performed on acquired image pair. Secondly, to recover the three-dimensional information of switch, we propose a semi-global stereo matching method by using data- and structure-driven cost volume fusion and then optimizing raw disparity map with weighted- and edge discriminated-smoothness prior. Gradient content is enforced on the weight for suppressing small-weight-accumulation problem in weak-textured regions. Besides, Hough transform with feature constraints is implemented for removing the chaotic lines and extracting center line of the switch arm. Finally, based on the center line and corresponding disparity map of the switch arm, triangulation principle is used for calculating the true angle between the switch arm and insulator such that whether or not the isolating switch is fully closed can be detected. The experimental results demonstrate that the proposed stereo matching method can achieve good performance in Middlebury v.3 data set and switch images, and the system can precisely measure the state of switches.
Keywords
Introduction
In a power system, monitoring the state of the substation equipment is a significant task. 1 Isolating switch is the most frequently used device in high-voltage switchgear. 2,3 Although the operating principle and structure of isolating switch are relatively simple, it is relatively prone to failure because of large amount of use. Most of switches operate outdoors, so the equipment components can be inevitably oxidized. The aging of the transmission parts leads to the deviated rotation angle and the incomplete closure of the isolating switch. Whether the switch is completely closed has a great influence on the safety of a substation. Therefore, to ensure the safety and reliability of the substation work, it is especially considerable to correctly identify the state of the isolating switch.
Traditional inspections mainly rely on the manual observation by telescope and subjective judgment. These methods are time-consuming and susceptible to subjective influence. In recent years, real-time inspection technologies for substation have been rapidly developed. 4 To improve the efficiency of state monitoring for isolating switch, vision-based intelligent inspection technologies 5 –7 have become a new trend, which greatly improves the accuracy and reduces the labor costs. In general, for effectively detecting the switch state, insulators are required to be first located followed by the state determination of the switch. 8 –12 Zhang et al. 13 proposed a simple but efficient isolating switch state recognition method, which determines the state of the switch by directly performing Hough transform on the switch boundary. Lu et al. 14 employed a method based on image geometry to monitor the substation switch. The angle of the arm is calculated by cosine theorem after the contour of the arm image is obtained, whether the switch state is closed or not is determined eventually. Bin et al. 6 introduced a switch detection method based on image recognition technology. The approach performs well on the conditions of image rotation and uneven illumination mainly by extracting and matching scale-invariant feature transform (SIFT) features of the isolating switch. In addition, infrared thermography has also gained much attention in electrical preventive maintenance due to its high precision and sensitivity imaging characteristics. 15 Ullah et al. 16 used multilayered perceptron to classify the thermal conditions of components to address initial prevention mechanism for power substations by infrared thermography. Further work based on deep learning approach and infrared images has also been carried out to defect analysis in high-voltage equipment. 17
However, the above approaches are all based on two-dimensional (2D) image content, in which the angle between the switch arm and the insulator cannot uniquely reflect the true angle in 3D space especially under the changes of the camera angle. Moreover, by using an infrared device to monitor the closing of the switch, it is impossible to accurately determine whether the closure is completely successful at the moment the switch is closed. Instead, we employ binocular vision technology to significantly detect the state of the isolating switch according to the 3D depth information in this article.
Binocular stereo vision technology has an extensive range of applications in computer vision, such as robotic autonomous navigation, aerospace and remote sensing, and industrial automation systems. 18 –20 The binocular stereo vision system mainly includes the following parts: binocular image acquisition, camera calibration, 21 –23 image correction, 24 stereo matching, 25 –27 and 3D reconstruction 28,29 process. Dense stereo matching is the key issue of stereo vision, and its purpose is to find the corresponding points in image pairs and obtain the disparity map for recovering 3D information. Four steps are primarily included in the stereo matching procedure, which are matching cost calculation, cost aggregation, disparity calculation, and disparity refinement. There are still many challenging issues existing in stereo matching algorithm, such as radiometric distortions, poor performance in weak-textured and disparity discontinuous regions.
In this article, aiming to precisely measure the state of isolating switch in 3D space, we mainly focus on proposing an effective semi-global stereo matching method by two strategies: the first one is constructing the matching cost by fusing data- and structure-driven cost volumes and the second is optimizing the raw disparity map with weighted- and edge discriminated-smoothness constraint. In particular, the weight is combined with gradient content such that the small-weight-accumulation problem in weak-textured regions can be suppressed to a certain extent. Based on our proposed semi-global stereo matching method, we also present a complete binocular vision system that can be employed to calculate the true angle between the switch arm and insulator, which consists of stereo calibration and rectification, switch detection, center line extraction of switch arm, stereo matching, and depth calculation. Firstly, stereo calibration is performed to derive internal and external parameters of cameras. After image rectification, the complete switch inspection is conducted followed by proposed feature constrained-Hough transform 30 for removing the chaotic lines and extracting center line of the switch arm. Moreover, the proposed stereo matching method is implemented from which only the stable disparities are utilized in later 3D coordinate mapping for guaranteeing the accuracy of angle measurement. Finally, the true angle between the switch arm and insulator is obtained by the principle of triangulation and whether or not the isolating switch is fully closed can be identified. The experimental results illustrated that the proposed method not only obtains higher measurement accuracy but also contributes to the substation safety.
The following section outlines the related work of stereo matching. Following that, the methodologies of the proposed methods are presented in the third section. In the fourth section, the performance of the proposed method is tested on Middlebury v.3 data set as well as the switch images. The fifth section concludes the article.
Related work
A detailed classification of stereo matching algorithms is provided by Scharstein and Szeliski, 31 in which stereo matching algorithms can be divided into local and global methods. Generally, global methods 32 can be formulated as an energy minimization problem. The energy function composes of a data term and smoothness term, which is to explicitly penalize disparity discontinuity between neighbor pixels. Dynamic programming (DP), 33 graph cut, 34 and belief propagation 35 are famous global optimizers, which can obtain comprehensive disparity characterization at the expense of substantial computational complexity.
Different from global methods, local ones are performed by calculating the matching cost between patches in image pairs, followed by aggregation of computed cost volumes over local support windows. Patches are compared by dissimilarity measures, which can be divided into two groups. The first group is traditional dissimilarity measures including sum of absolute differences, normalized cross-correlation, rank and census transform. The second group is learning-based measures, such as discriminative dictionary learning (DDL) 36 and convolutional neural networks. 37 Due to better generalization ability for stereo, in this work, cost computation is based on DDL. 32 However, the DDL tends not to preserve fine details due to the loss of constraint by structural information such as gradients. Hence, in this article, we present a data- and structure-driven cost volume fusion strategy to further improve the robustness of cost volume such that the shortcoming of the single data-driven cost computation can be neutralized.
Besides, cost aggregation is another vital step in local methods. In despite of variable support window (VSM)-based or adaptive support weight (ASW)-based aggregation method, the primary aim is to ensure the implicit smoothness assumption that pixels within the same support window share the similar depth. In VSM-based methods, multiple, fixed, and adaptive windows are employed to prevent them from crossing depth discontinuous regions. 38 –40 However, a rectangular window is not always rigorous enough at discontinuity regions and the computation within adaptive windows can be time-consuming. ASW-based methods assign preferential weights for each pixel within predefined window. Normally, color dissimilarity and distance proximity are chosen for determining the weight. The disadvantage of ASW-based methods is that the matching ambiguity will be unavoidable in low-textured regions, where small-weight-accumulation problem exists.
In the work by Hirschmuller, 41 semi-global matching (SGM) stereo method is proposed, which works in three steps: first, pixel-wise cost computation is computed; then, the cost volume is aggregated along 8/16 1D search passes with local smoothness constraint between neighbor pixels. Finally, post-processing is employed to remove outliers and obtain only consistent estimation. However, SGM is sensitive to penalty parameter as the smoothness terms need to be big enough to process smooth disparity map and small enough to maintain fine structures at discontinuities. In addition, SGM may result in ambiguous discontinuities around foreground objects in textureless background. Numerous variants of SGM have also been developed to obtain significant performance gains. Mei et al. 42 performed cost aggregation in dynamic cross-based window and optimized the disparity map in a scanline optimization framework. Liu et al. 43 proposed a stereo framework and formulated a joint second-order smoothness prior, avoiding the blend of the foreground and background and retaining the disparity discontinuities of strong texture regions. Liu et al. 44 presented a 3D aggregation strategy based on adaptive support window and good performance in slanted regions can be reached. Chuang et al. 45 incorporated penalty tuning method and edge content in gradual SGM cost aggregation, balancing the smoothness and fine structures of disparity result. Yao et al. 46 extended the SGM to a more global matching for overcoming the limitation of local scanline optimization.
However, in these SGM-based methods mentioned above, the selection of optimal disparities from full candidates introduces uncertainty in aggregation passes and the final depth recovery ability. For better handling slanted plans, we propose weighted- and edge discriminated-smoothness constraint to efficiently optimize the raw disparity result. The penalties at edge regions are automatically determined based on confidence measure for penalizing larger disparity changes. The weight combining appearance and gradient content can suppress the small-weight-accumulation problem to a certain extent. In this article, we dedicate to apply binocular stereo vision system to state measurement and improve the matching performance in weak-textured and disparity discontinuous regions. The contributions of this article are as follows: (1) feature constraints are enforced on Hough transform for obtaining the center line of switch arm; (2) data- and structure-driven cost volumes are fused to construct the matching cost, improving the matching accuracy; and (3) in cost aggregation process, weighted- and edge discriminated-smoothness constraint is proposed to optimize the raw disparity map. The smoothness constraint is determined automatically according to the image confidence.
Methodology
Overview of procedure
An overview of the proposed method is illustrated in Figure 1. Our system can be divided into three parts: camera calibration and rectification, stereo matching, and center line extraction of switch arm. To start, the first part mainly includes stereo calibration and distortion rectification for camera parameters and subsequently horizontal dissimilarity searching. The second part includes semi-global stereo matching based on data- and structure-driven cost volume fusion and weighted- and edge discriminated-smoothness prior. The third part is for center line extraction of switch arm and we mainly focus on exploiting feature constraints-based Hough transform to remove chaotic lines and extract center line of the switch arm. Ultimately, the vector of the center line in 3D space can be obtained by combining the disparity map and the positions of center line. Consequently, we can get the angle between the arm and the insulator so as to determine whether or not the isolating switch is fully closed.
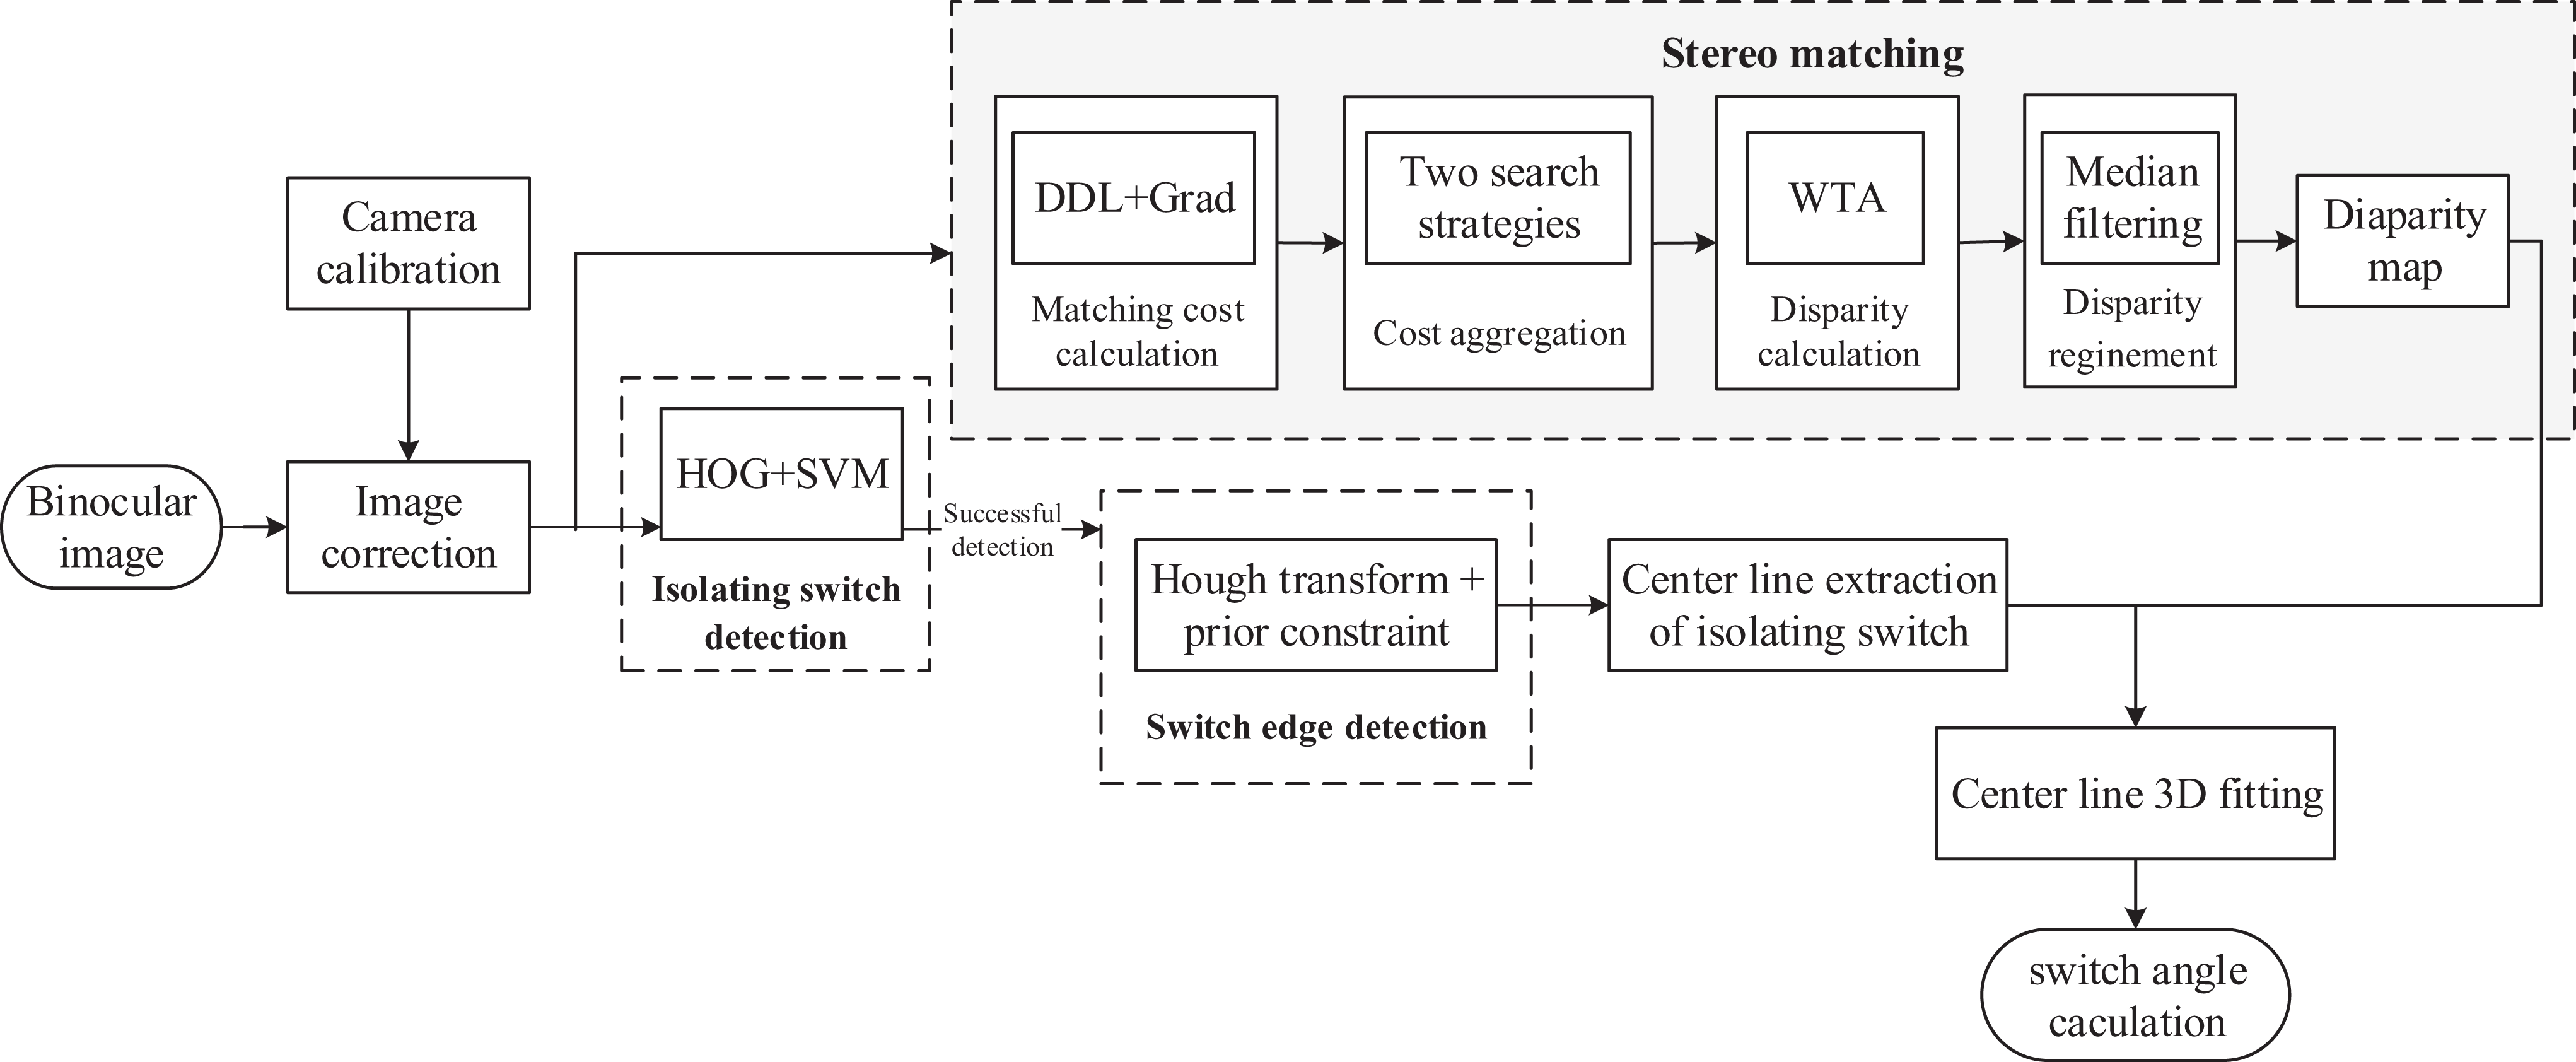
Flowchart of the proposed measurement system. Our system can be divided into three parts in detail: camera calibration and rectification, stereo matching, and center line extraction of switch arm.
Matching cost computation
Matching cost measurement is used to compute initial cost volume, which is the basis of the whole stereo matching algorithm. Cost volume is a 3D matrix with each element corresponding to the cost of a relative pixel at a certain disparity level. Considering better generalization ability for stereo, we adopt the DDL
36
method, which belongs to data-driven approaches and utilizes sparse representation to represent each patch over learned discriminative dictionary, to measure the similarity between image patches. The matching cost value

where
Nonetheless, the DDL method tends not to preserve fine details due to loss of constraint by structural information such as gradients. Therefore, in this article, we present a data- and structure-driven cost volume fusion strategy to further improve the robustness of cost volume such that the shortcoming of the single data-driven cost can be neutralized. The fused matching cost measure is defined as follows
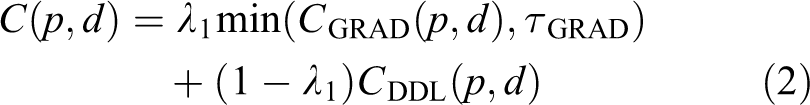
where τGRAD is the truncating value, coefficient λ1 balances the impact of each measure.

where ∇
x
and ∇
y
are the derivative operators in x and y directions, respectively. Grayscale image,
Weighted and edge discriminated cost aggregation
Edge weighted tree structure
Global method regards the matching task as the optimization of energy function, which is defined by
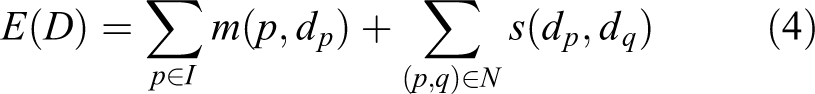
where D represents disparity map, p belongs to image I and is assigned to disparity dp
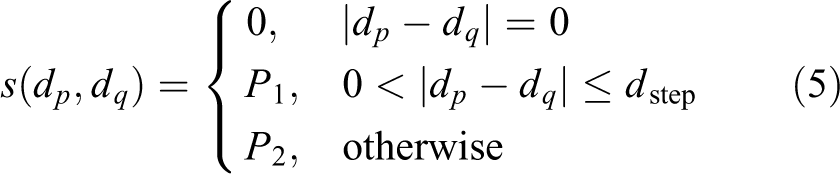
. The first term is the data term, while the latter one is regularization function enforced on neighboring pixels p and q in accordance with the predefined set N. P
1 is used to penalize small jumps in disparity. For disparity jumps greater than one pixel where disparity borders are more likely to occur, a more critical parameter P
2 is generally adopted with
For simplicity and computational efficiency, edge weighted horizontal tree structure is adopted for enforcing the connectivity of adjacent pixels such that the energy optimization can be efficiently implemented via DP. The horizontal tree is constructed as shown in Figure 2. The tree is rooted on pixel p, and the horizontal tree is established by extending the node p in the vertical direction, then a batch of horizontal expanding is performed. A complete cost aggregation process combines forward and backward passes in the horizontal phase.

Edge weighted tree structure: (a) horizontal tree structure, (b) the horizontal phase, and (c) the vertical phase. p is the root node. Different edges correspond to different weights. The whole forward–backward aggregation is illustrated in the dashed rectangle.
In the edge weighted tree structure, the edge connecting adjacent nodes are generally assigned weight determined by color difference. 47 However, in weak-textured regions, the color difference would be quite small. Many unreliable high weights accumulate along a long path, resulting in small-weight-accumulation drawback. 48 In this article, we propose an enhanced weight function based on color and gradient content. The edge image for weight calculation is obtained by random forest method. 49 The proposed edge weight is defined as follows

where
Confidence-based penalty tuning
How to automatically assign appropriate penalty variables (
Normally, the initial disparity maps are obtained by WTA strategy; subsequently, the left–right consistency check is performed for picking confidence points from the initial disparity maps. A confident ratio

where


where
Edge discriminated cost aggregation
After constructing the horizontal tree, cost volume is first aggregated from leaves to the root node which locates at same column in horizontal passes. Then, the cost volume is aggregated from the subsidiary nodes to the root node along vertical passes. Therefore, the energy function in equation (4) can be optimized as follows

where P
1 is a lower penalty for adapting slanted or curved planes and only penalizing the small step change
The cost aggregation process is shown in Figure 2, which is divided into two phases: the horizontal phase and the vertical phase. In each phase, the forward and backward propagation are employed. For the forward pass, the cost volume is renewed recursively from the leftmost pixel of a scanline. The accumulated cost values are preserved in array CF
. Similarly, the backward pass calculates the costs successively from the rightmost pixel and the accumulated cost values are stored in CB
. Finally, the aggregated cost value

Disparity computation and refinement
After the cost volumes are regularized, the raw disparity map is determined by selecting the minimum aggregated disparity value for each pixel utilizing WTA strategy

where disp is the maximum disparity candidate. The disparity map obtained by this stage still has outliers in occluded regions. Therefore, weighted median filter is adopted to correct unstable pixels to a great extent.
Center line extraction of switch arm
The rough location of the isolating switch employs the SVM algorithm
50
combined with the Hog eigenvector of the switch, and this rough location is not the focus of this article. Instead, suppose that the rough location is finished and then we focus on exploiting feature constraint-based Hough transform for obtaining the center line of switch arm. Hough transform is an approach for detecting lines, circles, and other shapes. The main principle is that the image is mapped from the original polar coordinate space into parametric space and then to fit the shapes such as lines and circles. A line in the polar coordinate space corresponds to a point in the Hough space, and a line in the Hough space corresponds to a point in the polar coordinate space. Firstly, the contours of switch image from rough location are detected by random forest method.
49
After that, Hough transform algorithm is adopted to search the straight lines of arm edges on the contour image. However, there are chaotic lines in the background of image and small segments also exist, resulting in failed center line extraction. Therefore, a novel method leveraging feature constraints-based Hough transform is proposed for removing the chaotic lines and extracting center line of the switch arm. The specific steps are as follows: Step 1: As isolating switch has been identified by SVM method, the switch arm takes up the close-up view of the identified isolating switch. Assume the end-to-end coordinates of lines detected by Hough Transform is stored in array

where N is the total number of lines,
The slope Step 2: A line detected by the Hough transform could be divided into several segments, it is necessary to merge the segments by means of integration strategy. If the minimum pixel distance between any two parallel lines belonging to one long line is smaller than integration threshold Tb
, these two parallel lines are merged as one line. To eliminate inverse influence of vertical lines in the background, we delete the lines of which the angle is larger than Tv
degree since the purpose of this article is to detect whether or not the isolating switch is fully closed. Step 3: To eliminate bad influence of small and cluttered lines, the threshold of the candidate lines is set to

Step 4: Based on the characteristics of isolating switch arm whose two edges are parallel, parallel constraint is enforced, namely, the angle difference between two lines is calculated. The angle threshold is set to w = 2° and the parallel constraint is considered to be satisfied when the angle difference is less than the threshold. If the parallel constraint is satisfied, two lines with the smallest angle difference are selected as the detected edges of switch arm. Otherwise, the longest line is selected as the detected edge. Step 5: After accurately detecting the two edges of arm, the disparity map is required to obtain the angle between the switch arm and insulator. However, the disparity value is unstable at the arm edges. If the result of edge detection is slightly shifted or the disparity values of the edge are not accurately calculated, the 3D information of the lines will be wrong. Consequently, it is indispensable to extract the center line which locates at disparity continuous regions. The end-to-end coordinates of the center line of the switch arm are as follows

where
Angle measurement of switch arm in 3D space
Stereo imaging system includes binocular image acquisition, camera calibration, image rectification, and 3D information recovery. With reference to Figure 3, the imaging planes of the binocular cameras are coplanar and the distance from cameras to optical centers (O
1 and O
2) is f. The objective point

Projection of 3D objective point
After acquiring the images, the intrinsic, extrinsic, and distortion parameters of the cameras are obtained based on the calibration method proposed by Zhang.
51
To reduce the complexity of matching problem, the epipolar constraint
52
provides an efficient strategy that corresponding points only have horizontal offsets. Once the image pairs have been rectified, the points Pl
and Pr
satisfy that

where
Therefore, the 3D coordinate of point P is recovered as follows

For isolating switches, when they are in condition “closed,” the measured angle between the switch arm and insulator will be in a certain range. If not, it may indicate that the switch is not fully closed well. The position of the middle line and the corresponding depth information are combined, then the end-to-end coordinates of the middle line can be mapped into 3D space, that is,

where
Experimental results
In this section, the performance of the proposed stereo matching method is evaluated on the images of the Middlebury stereo benchmark 53 and isolating switches, respectively. To further compare with the proposed method, seven state-of-the-art methods are chosen. In addition, the center line extraction of switch arm leverages the Hough transform and prior constraints, and the evaluation of this content is also illustrated.
Evaluation on Middlebury v.3 data set
For evaluation of the proposed stereo matching algorithm, other seven algorithms are selected to compare on the Middlebury v.3 data set which is challenging and representative. The seven methods are weighted cost propagation with smoothness prior (WCPSP), 54 iterative color-depth (MSTCD2), 55 DDL, 36 iterative guided filter (IGF), 56 improvement of stereo matching (ISM), 57 pyramid stereo matching network (PSMNet), 58 and second-order semi-global matching (SGM-SO), 59 respectively. In particular, WCPSP method enforces local smoothness during the weighted cost aggregation on horizontal tree structure, and the smoothness constraints contribute to smooth disparity map, especially on curved surfaces. SGM-SO method utilizes angle direction priors-based second-order smoothness constraint to improve the matching accuracy in weak-textured regions. Then, slanted plane iterative optimization is performed to optimize disparity maps.
The detailed evaluation results of 15 Middlebury v.3 image pairs in non-occluded regions are shown in Table 1. The average error rate of each method is calculated. Our method holds the best performance in accuracy. The average error rate of our method is the lowest among evaluated methods. PSMNet does not work well in the data set, and the average mismatching rate reaches 19.16%, which is twice of the proposed method. Compared to WCPSP, DDL is significantly better due to dictionary learning-based matching cost. However, by implementing data- and structure-driven cost volume fusion and weighted- and edge discriminated-smoothness prior, our method achieves more accurate disparity maps and reliable depth boundaries in comparison with DDL.
Mismatching rate (%) on 15 Middlebury v.3 stereo pairs by eight algorithms.a

a Error threshold is 2.0 pixel and the non-occluded regions are evaluated.
WCPSP: weighted cost propagation with smoothness prior; DDL: discriminative dictionary learning; IGF: iterative guided filter; SGM-SO: second-order semi-global matching; PSMNet: pyramid stereo matching network; MSTCD2: iterative color-depth.
For qualitative analysis, Figure 4 presents the disparity maps of Adirondack, ArtL, MotorcycleE, Piano, Pipes, and Playroom. It can be clearly seen that the disparity maps of the proposed method are close to the ground truth. As for MotorcycleE, the disparity map calculated by our method is the best especially on the edge of the motorcycle. Even if the performance of IGF and ISM method is comparable, these methods are not very effective in weak-textured area due to the limitation of local methods. For Piano, fine and smooth results are obtained on piano and stool by WCPSP and the proposed method because of the smoothness constraint. However, WCPSP has a large number of mismatched pixels at top right corner. It may be because the matching cost function is not very competitive for illumination. It can be concluded that the proposed method keeps the distinguished results among these methods especially in the weak-textured and the boundary regions.

Disparity maps of the Middlebury data sets: (a) left image, (b) ground truth, (c) WCPSP, (d) MSTCD2, (e) DDL, (f) IGF, (g) ISM, (h) PSMNet, (i) SGM-SO, and (j) the proposed method. The data below the image are the mismatching rate (%). From the first row to end, the image pairs are ArtL, Jadeplant, MotorcycleE, Piano, and Shelves, respectively. WCPSP: weighted cost propagation with smoothness prior; DDL: discriminative dictionary learning; IGF: iterative guided filter; SGM-SO: second-order semi-global matching; PSMNet: pyramid stereo matching network; MSTCD2: iterative color-depth.
Center line extraction of switch arm
One pivotal operation in calculating switch angle is the extraction of the center line of switch arm. Since the disparity values of arm edges which locate at depth discontinuities are unstable, it’s indispensable to acquire disparity values that are more stable in the center line of the arm.
In the proposed method, random forest-based edge detection and Hough transform combined with feature constraints are adopted. Figure 5 presents the results of line detection with different configurations. Images with low light, blurred details, or complex backgrounds are selected for line detection. To prove the effectiveness of the proposed method, four different experimental settings for detecting the edge of the switch arm are adopted. It can be seen from the first row of Figure 5(a) and (c) that when constraints are not enforced, the random forest method could obtain more accurate edges than Canny operator, which is indicated at the lower edge of the switch arm. Then, the center line in Figure 5(d) is obviously more stable than Figure 5(b). For the second and third rows, there are more complex scenarios in the background where chaotic lines occur. In this case, when the constraints are added, the edges of switch arm can be successfully detected, which reveals the positive effect of the proposed feature constraints in combing random forest-based edge detection.
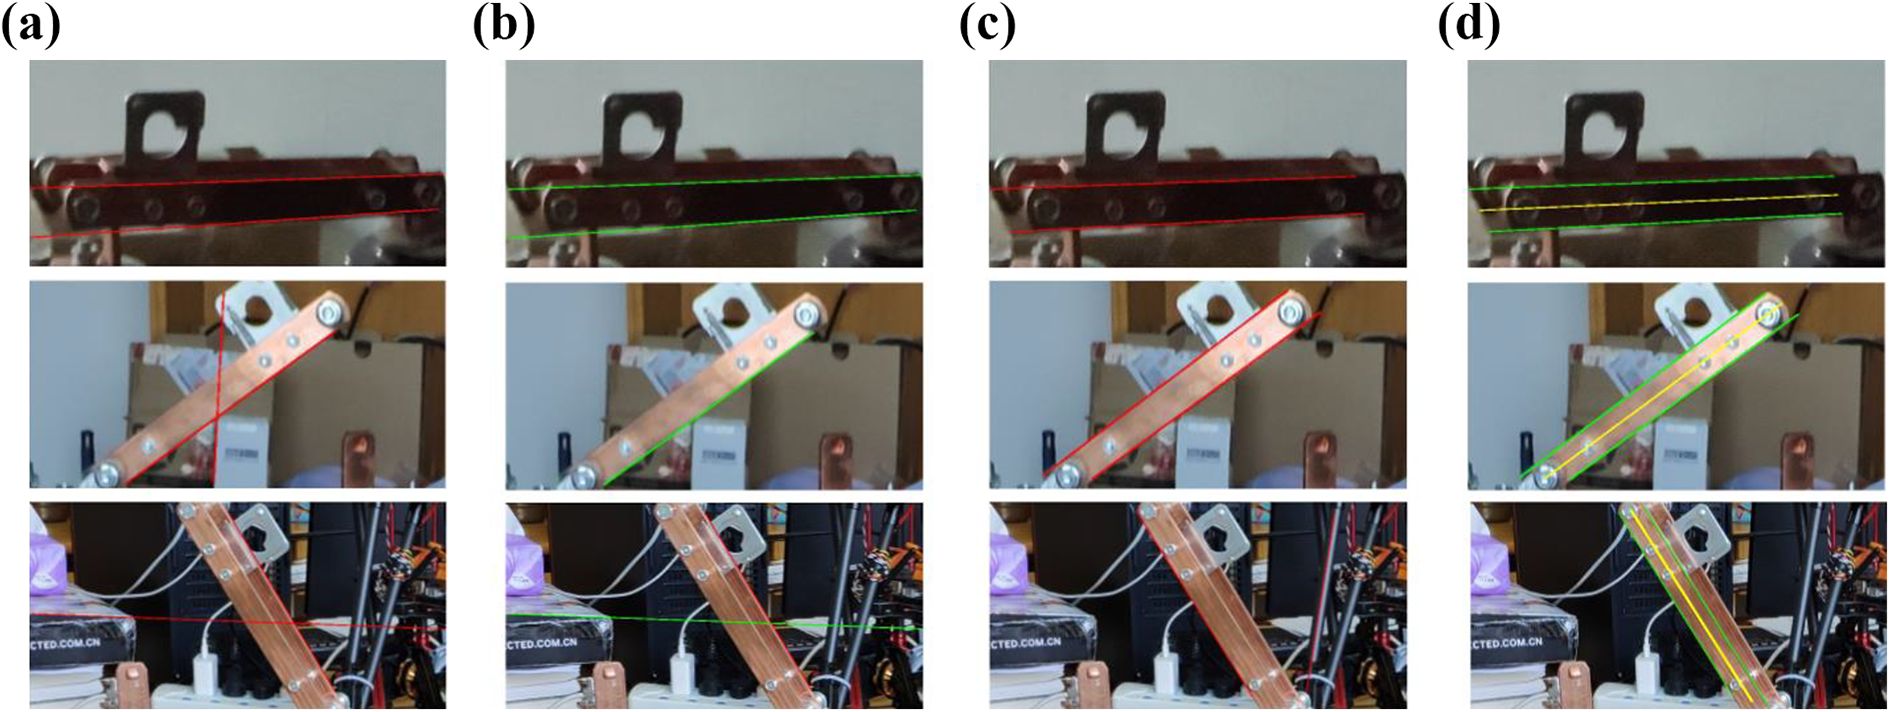
Results of center line detection with four kinds of experimental settings: (a) Canny, no feature constraint; (b) Canny, feature constraint; (c) random forest, no feature constraint; and (d) random forest, feature constraint. The red lines are the detected lines without constraints, while green lines are detected with constraints. If parallel lines do not exist, the longest line is chosen. The yellow line is the center line extracted by the proposed algorithm.
Switch images
Stereo calibration
To recover the 3D information of the object, we adopt Zhang’s calibration method
51
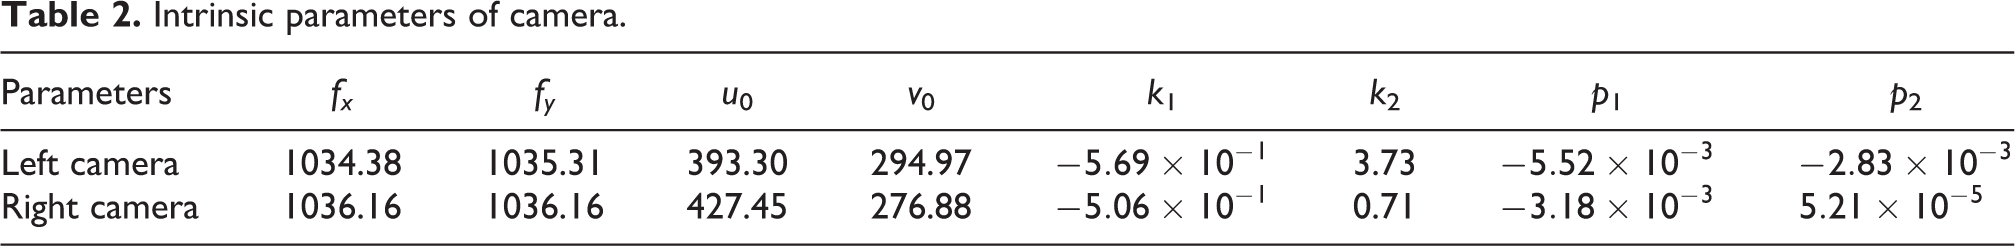
for obtaining the camera intrinsic and extrinsic parameters. The calibration accuracy in binocular stereo vision is a crucial factor and will affect the accuracy of subsequent 3D reconstruction. The intrinsic and extrinsic parameters of the binocular camera calibration are presented in Tables 2 and 3, respectively. fx
and fy
are horizontal and vertical focal lengths,
Intrinsic parameters of camera.
Extrinsic parameters of camera.

In the extrinsic parameters, R and T are the pose relationship between binocular cameras, R is the rotation matrix and T is the translation vector. In general, when the cameras are placed horizontally, R is an identity matrix, which means no rotation and scaling. The first parameter of the T matrix is the base distance
Measurement analysis
As not all the codes of the compared methods such as IGF and ISM methods are available, the quantitative results in “Evaluation on Middlebury v.3 data set” section of these compared methods are obtained from Middlebury homepage directly. In this section, we utilize four stereo matching methods (i.e. WCPSP, MSTCD2, DDL, and SGM-SO) to analyze the performance of measurement in comparison with our method. These techniques can be used to detect the angle of isolating switch in the power system. Generally, when the angle is 0° or within one preset threshold, the switch arm is regarded as fully closed and operating smoothly. As the accuracy of the angle detection is chiefly affected by angle and distance, the stereo images are captured under different distances and angles using binocular industrial cameras.
Figure 6 presents the captured image pairs under three angles (0° (fully closed), 5°, and 11°) and three distances (1 m, 1.5 m, and 2 m). WCPSP, MSTCD2, DDL, SGM-SO, and the proposed method are employed to generate the disparity map for each stereo pair. In Figure 7, we show the disparity maps of these five stereo matching methods under 1.5 m distance with three different angles (0°, 5°, and 11°). The matching cost function of WCPSP only relies on the linear accumulation of traditional truncated absolute difference (AD) and gradient content, which is sensitive to pattern regions and image noises and is inferior to learning-based dissimilarity measure. Visually, it can be seen from Figure 7(a) that there are obvious error matching points in the leftmost and background regions. In nonlocal MSTCD2 method, minimum spanning tree structure is built for each pixel and competitive performance against guided image filter on both efficiency and accuracy has been illustrated in this method. However, as the minimum spanning tree structure would become no longer unique in low-textured regions, error disparity values will be obtained. This is consistent with the appearance of black holes in Figure 7(b). In addition, it is hard to guarantee excellent performance in slanted surfaces because cost aggregation is performed on independent cost slices. Instead, our method performs cost aggregation based on edge discrimination strategy and cost slices are incorporated adaptively such that the slanted or curved surfaces can be handled properly. SGM-SO method has a “false obesity” phenomenon between the insulators, which is mainly because of excessive slanted plane iterative optimization. Moreover, compared with DDL, our method has less scanline effects and better distinction on objects edges, especially the edges of the switch arm. It can be concluded that even for these most challenging data, our method remains keeping the best performance in disparity accuracy.
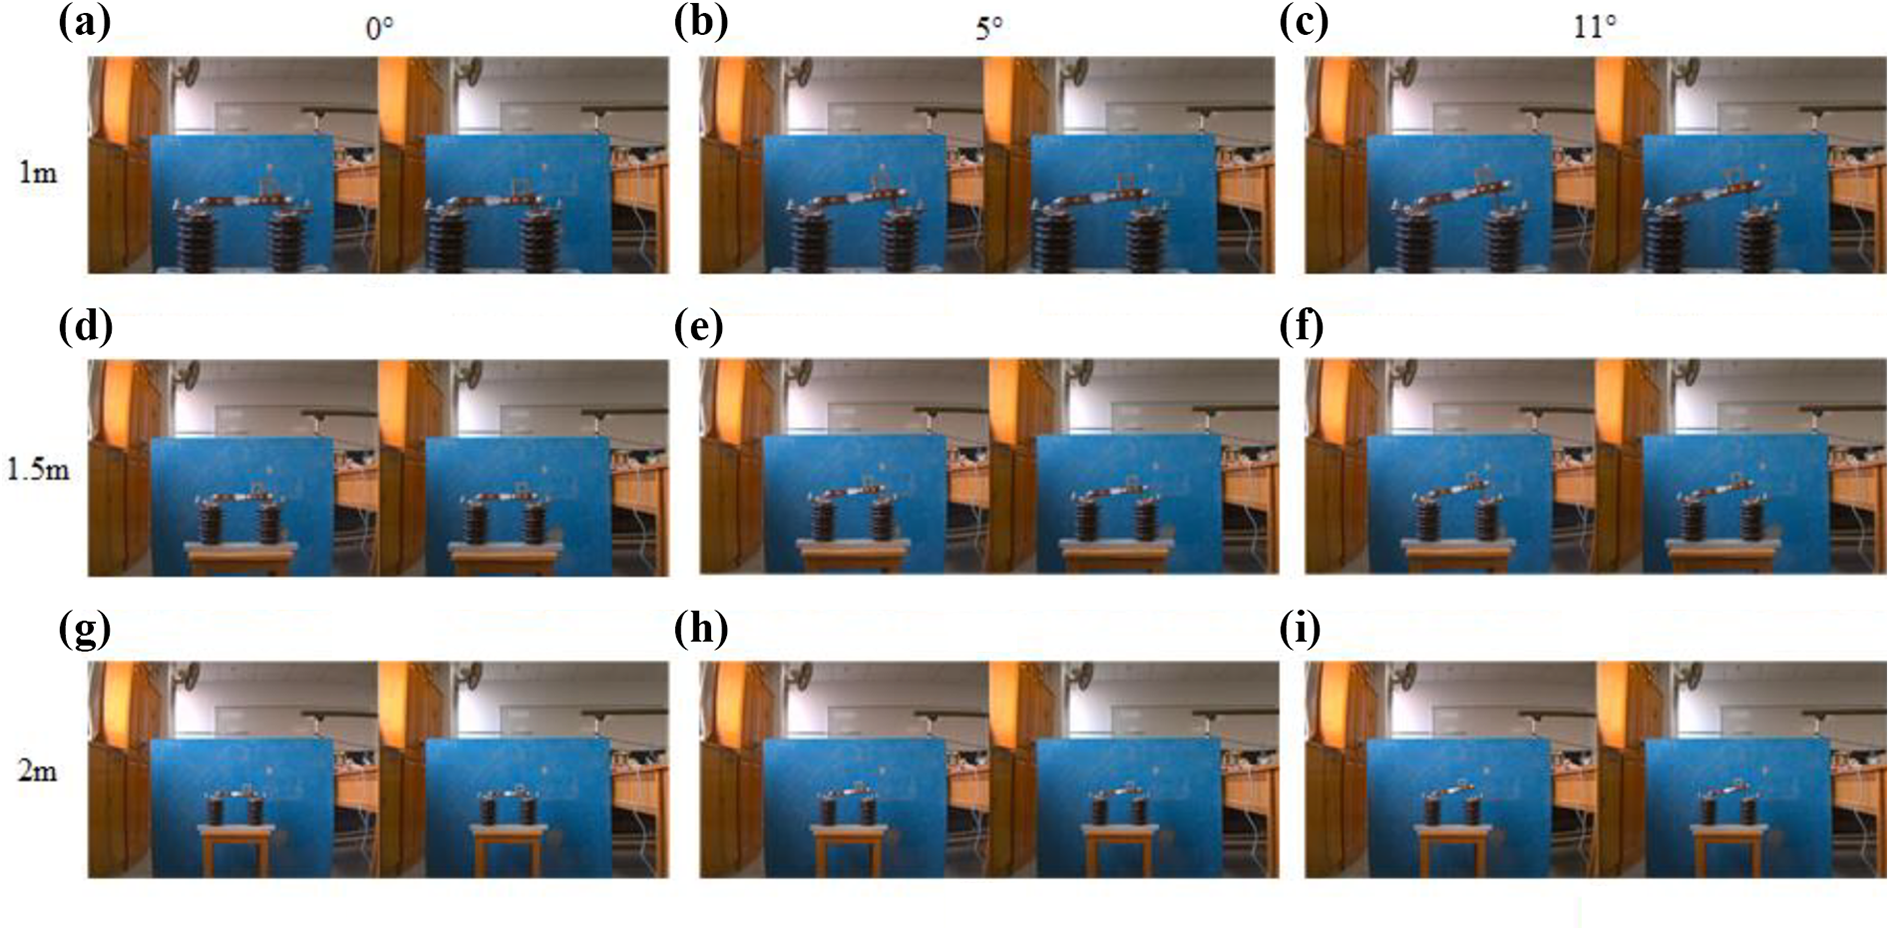
Binocular images of isolating switch under different angles and distances. Columns from left to right: low (0°), medium (5°), and high (11°) angle. Rows from top to bottom: short (1 m), medium (1.5 m), and long (2 m) distance. (a)-(c) are images captured under 1m distance with three different angles. (d)-(f) are images captured under 1.5m distance with three different angles. (g)-(i) are images captured under 2m distance with three different angles.
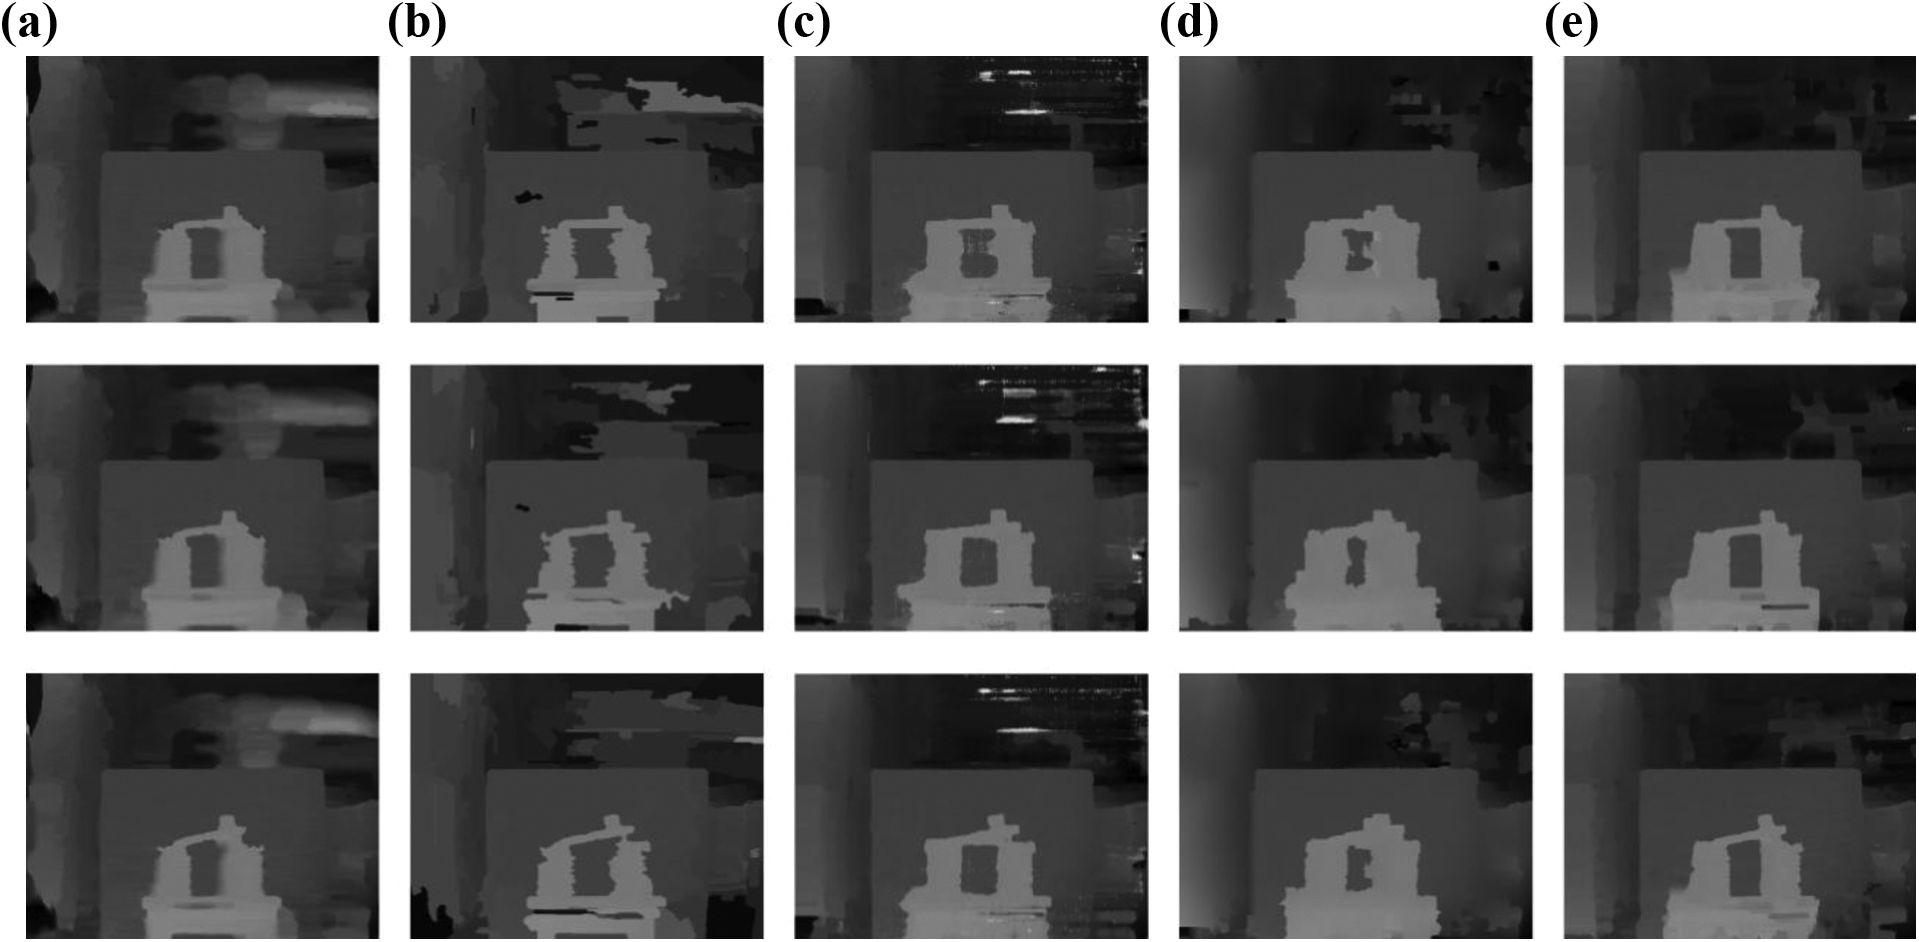
Disparity maps of five methods at 1.5 m distance: (a) WCPSP, (b) MSTCD2, (c) DDL, (d) SGM-SO, and (e) the proposed method. Rows from top to bottom represent 3°, respectively. WCPSP: weighted cost propagation with smoothness prior; DDL: discriminative dictionary learning; IGF: iterative guided filter; SGM-SO: second-order semi-global matching; MSTCD2: iterative color-depth.
In addition, the quantitative evaluation is successively presented according to two aspects: (i) length comparison of the switch arm under different distances and angles and (ii) accuracy comparison of the angle under different distances and angles. The calculation of the arm’s length and angle is based on 3D coordinate transformation, which is shown in formula (17). Table 4 presents the length comparison of the switch arm calculated in 3D space by five stereo matching methods and nine different situations with regard to distance and angle. In actual measurement, the outermost two screws on the arm are regarded as the end points of arm and the true length is 20.8 cm. As can be seen from the table, our method can estimate accurate and smooth disparity map and the data are closer to the true length in comparison to other methods. In WCPSP, the data are abnormal in condition 1.5/(5,11) and 2/11 because there are outliers in disparity, resulting in huge disparity jump among adjacent pixels. Table 5 illustrates the angle calculation of switch arm by five stereo matching methods. At the angle of 0° and distance of 1 m, 0.95° and 0.60° are calculated by WCPSP and SGM-SO methods, respectively. Compared to the two methods, our method has great advantages and the accuracy is increased nearly by 10 times.
Length calculation of the switch arm under different distances (cm) and angles (°).
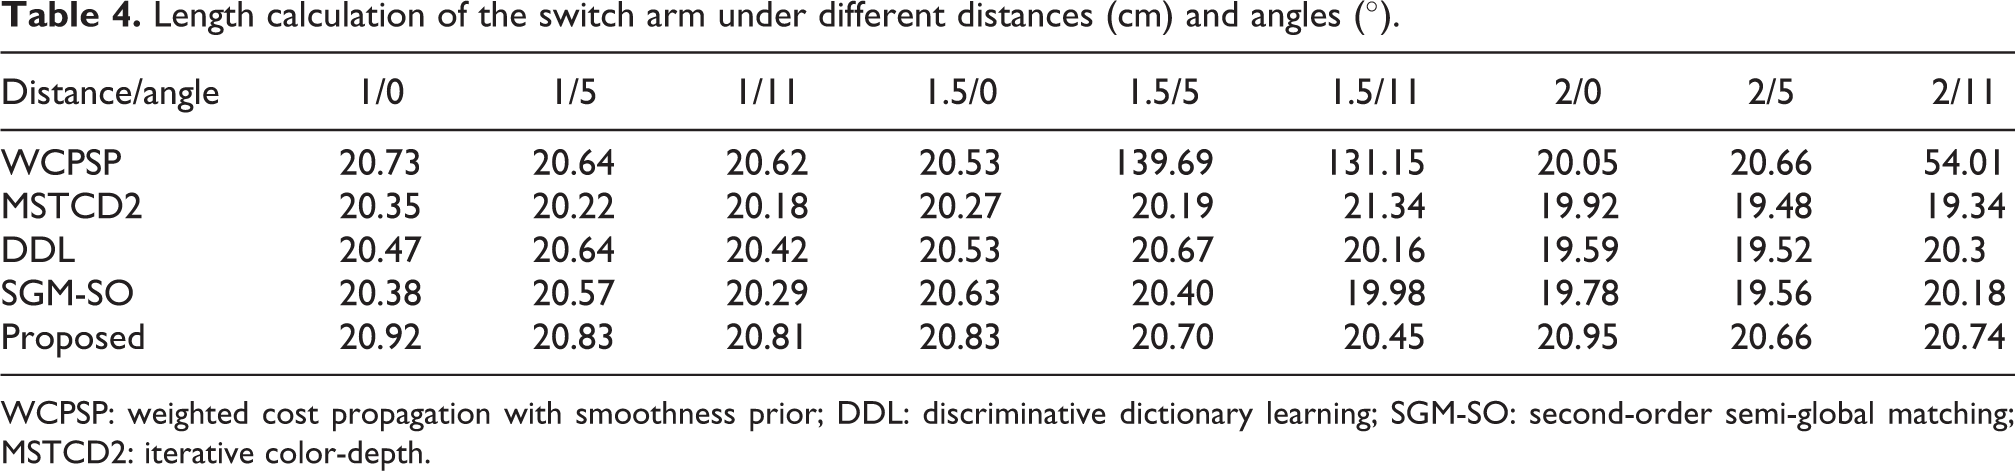
WCPSP: weighted cost propagation with smoothness prior; DDL: discriminative dictionary learning; SGM-SO: second-order semi-global matching; MSTCD2: iterative color-depth.
Angle calculation of isolating switch under different distances and angles.

WCPSP: weighted cost propagation with smoothness prior; DDL: discriminative dictionary learning; SGM-SO: second-order semi-global matching; MSTCD2: iterative color-depth.
For more intuitively demonstrating the accuracy of each method, absolute errors are calculated. The absolute error Δε is defined as follows

where
The absolute error line chart of Tables 4 and 5 are shown in Figure 8(a) and (b), respectively. As can be seen from Figure 8, WCPSP has the worst performance. With distances increase, the absolute errors become unstable and are more likely to be worse. This is apparent according to the upward trend curves by the five methods. However, our method can still control the errors of length and angle within 0.35 cm and 1.16° and keep the most stable performance.

Absolute error comparison among five methods: (a) absolute error comparison of switch arm’s length and (b) absolute error comparison of switch angle. WCPSP: weighted cost propagation with smoothness prior; DDL: discriminative dictionary learning; SGM-SO: second-order semi-global matching; MSTCD2: iterative color-depth.
Conclusion
To deal with the safety hazard caused by switch disconnection in power system, an efficient binocular stereo vision-based state measurement system is proposed in this article. The system is carried out in the aspects of camera calibration and rectification, improved SGM algorithm, and the center line extraction of switch arm. In particular, data- and structure-driven cost volume fusion and weighted- and edge discriminated-smoothness prior are proposed in SGM-based stereo matching. The cost volume fusion strategy can neutralize the shortcoming of single data-driven cost and improve the robustness of dissimilarity measures. Meanwhile, the small-weight-accumulation problem in weak-textured regions can be suppressed effectively by the proposed edge weighted tree structure, and the discriminated-smoothness prior construct appropriate regularization terms by enforcing different penalties on different cost layers such that both the slanted planes and disparity discontinuities can be handled well. In terms of line detection, after the rough positioning of the isolating switch by implementing SVM algorithm and Hog eigenvector of switch, random forest method is employed to detect the contours of switch image due to its stability in combination with Hough transform. Then, feature-constrained Hough transform is adopted to remove chaotic lines from background and extract the center line of the switch arm. By constructing binocular stereo vision framework, the disparity map obtained by semi-global stereo matching and the center line of switch arm are combined that whether the switch is fully closed can be determined based on triangulation principle. Obviously, accurate measurement is also related to the performance of stereo calibration. We adopt Zhang’s calibration method for calculating the intrinsic and extrinsic parameters of cameras. Experimental results on Middlebury v.3 data set prove that the proposed matching method has great advantages and achieves more accurate disparity maps compared with other advanced methods. Moreover, from the quantitative measurement analysis on switch images, we find that our system can control the measurement errors of length and angle within 0.35 cm and 1.16° and keep the most stable performance.
For the convenience of the experiments and the validation, the current work is carried out only in a reasonably laboratory environment, its robustness in real-world scenarios needs to be verified in future research. Moreover, the dynamic processing of visible sequence images captured from closing process and their further cooperatively processing with infrared images can also be exploited for more effective state continuous monitoring of isolating switches.
Footnotes
Declaration of conflicting interests
The author(s) declared no potential conflicts of interest with respect to the research, authorship, and/or publication of this article.
Funding
The author(s) disclosed receipt of the following financial support for the research, authorship, and/or publication of this article: This work was supported by the National Key R&D Program of China (no. 2018YFC0406900), the Key Research and Development Program of Jiangsu Province (no. BE2018092), and the State Grid Jiangsu Electric Power Co., Ltd Science and Technology Project (no. J2019104).