
Abstract
Computer vision systems have demonstrated to be useful in applications of autonomous navigation, especially with the use of stereo vision systems for the three-dimensional mapping of the environment. This article presents a novel camera calibration method to improve the accuracy of stereo vision systems for three-dimensional point localization. The proposed camera calibration method uses the least square method to model the error caused by the image digitalization and the lens distortion. To obtain particular three-dimensional point coordinates, the stereo vision systems use the information of two images taken by two different cameras. Then, the system locates the two-dimensional pixel coordinates of the three-dimensional point in both images and coverts them into angles. With the obtained angles, the system finds the three-dimensional point coordinates through a triangulation process. The proposed camera calibration method is applied in the stereo vision systems, and a comparative analysis between the real and calibrated three-dimensional data points is performed to validate the improvements. Moreover, the developed method is compared with three classical calibration methods to analyze their advantages in terms of accuracy with respect to tested methods.
Introduction
Nowadays, applications like manufacturing process, structural health monitoring, microsurgery, laparoscopic surgery, and specially in autonomous navigation have used three-dimensional (3-D) measuring techniques. 1 –5 In these applications, the accuracy is essential for the tasks that must be developed; therefore, there are methods to improve the accuracy of the 3-D measurements. 6,7 In autonomous navigation systems, the aim is to move an autonomous object through a 3-D environment with classic interpolation methods (inertial sensors) or external references (computer vision, ultrasonic sensors, GPS, CCD, and CMOS). 8 –11 Recently, research in autonomous navigation applications has focused on stereo vision, which is used for 3-D mapping, detection, and location of objects. 12 –14 Advantages of the stereo vision are the portability and the wide field of view (FOV) due to the use of cameras, obtaining more information of the environment to scan compared with other 3-D measuring techniques, for example, time of flight, pulse modulation method, dynamic laser triangulation, among others. 15 –17 Stereo vision systems (SVS) process visual information from two or more cameras to obtain features of a specific scene. The SVS setup employs two cameras in which each camera captures images from different perspectives. 18 In each stereo image, the corresponding points between them are detected, and finally, a triangulation process is performed with each corresponding pair of points. 19 –21 The two main reasons of loss of accuracy in SVS for 3-D measurements are the loss of information due to the image digitalization and the lens distortion. 22 The loss of information in image digitalization entails that specific areas of the images have low quality in terms of brightness, sharpness, and contrast, causing a difficult and inaccurate localization of the 3-D points in these areas. On the other hand, the lens distortion causes deformation in the straight lines of the images, resulting on inaccurate measurements of the 3-D points in SVS. These errors are minimized using camera calibration methods, where intrinsic and extrinsic parameters of the cameras are obtained. 23 The mentioned parameters are the position and orientation of the cameras, focal distance, optical center, and lens distortion coefficients, where their estimation entails a high computational cost because it is necessary to perform many steps to obtain them. The novel camera calibration method for SVS is developed with the purpose of locating 3-D points of a specific scene without estimating these parameters, obtaining a low computational cost. Moreover, the developed method is created to have higher accuracy in the localization of 3-D points than other calibration methods that use the estimation of the mentioned parameters. The developed SVS prototype is presented in Figure 1; it performs the developed camera calibration method, high-speed pattern recognition feature, and triangulation process to obtain the 3-D points coordinates. The proposed calibration method uses the least square technique, in which an equation is obtained to compensate the loss of information due to the image digitalization and the errors generated by the lens distortion. The presented article shows the implementation of an SVS to locate 3-D points coordinates in real-time applications and a novel calibration method to improve the accuracy of the 3-D points coordinates. Experimentations are performed, where 3-D points coordinates of a specific scene are located at different depths, obtaining databases of 3-D points coordinates with the implemented SVS and, afterward, databases including the calibration method on the SVS, comparing the results to validate the improvements of the developed calibration method. Moreover, an experimentation where a comparative analysis is performed between the developed calibration method with other three classical calibration methods is presented. In this experimentation, the errors obtained by each calibration method tested in planes XY, XZ, YZ, and XYZ are compared.
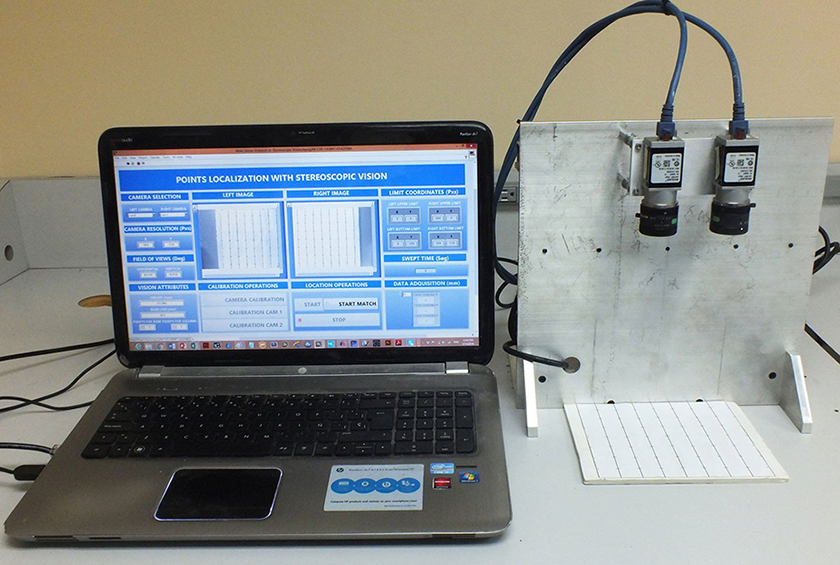
Developed SVS with interface in LabVIEW. SVS: stereo vision systems.
Image digitalization errors and lens distortion
Image digitalization is employed a CCD or CMOS sensor, which gets the light information from the scene, converting it into electric signals. The intensity of each electrical signal will depend on the amount of light obtained by the sensor in different parts of the scene. 24 These signals are amplified and converted into digital signals, creating a bitmap (pixels) with the digital information of the scene. In this process, there is a loss of information due to signal noise, the conversion of light information to electric signals made by the sensor, and the conversion of the analog signal to digital signal made by the analog–digital converter. 25 Generally, in SVS, a matching process of a specific region is performed between images from different perspectives in order to locate 3-D points of a scene. A low quality of the images due to the loss of information can cause mismatch of the specific region between the images and also entails to inaccurate measurements of the 3-D points. Figure 2 shows an example of how the errors of image digitalization affect the SVS in this matching process.

Template matching in stereoscopic images. (a) The template was successful located in both images despite the quality between the images. (b) The template was found only in left image, the low quality entails the mismatch in right image.
Another problem that occurs in cameras is the lens distortion. The problem consists in the curvature of the straight lines presented in the image due to the camera lens. This curvature can be presented in three forms: barrel distortion, pincushion distortion, and mustache distortion. 26 Figure 3 shows the types of distortions that can be presented in camera lens. The barrel distortion is seen on wide angle lenses, where the FOV of the lens is wider than the size of the image sensor, resulting in straight lines curved inward. In the opposite way, the pincushion distortion is seen on telephoto lens, where the FOV of the lens is smaller than the size of the image sensor, resulting in straight lines curved outward. In addition, the mustache distortion appears in several lens with variable FOV. In this distortion, the straight lines are seen curved inward toward the center of the image and curved outward at the extreme corners of the image. The lens distortion in SVS causes inaccurate measurements in the 3-D points localization, especially toward the extreme edges of the images where the distortion affects more.

Types of lens distortion: (a) Non-distortion. (b) Barrel distortion. (c) Pincushion distortion. (d) Mustache distortion.
SVS implementation
The SVS obtains 3-D information from two images captured from two different cameras separated by a known distance. Similar design of SVS can be found in the literature,
27
–29
The developed computer program for 3-D point localization using SVS can be divided into five steps: images capture, camera calibration, pattern match, computing pixel coordinates to angles, and triangulation. Figure 4 shows the localization of a 3-D point in the scene using the developed SVS. The coordinates

Localization of a 3-D point in SVS. SVS: stereo vision systems; 3-D: three-dimensional.
Specifications of the SVS
The developed SVS in a particular 3-D point is presented in Figure 5, where b is the base line, l is the distance from the base line to the scene, and
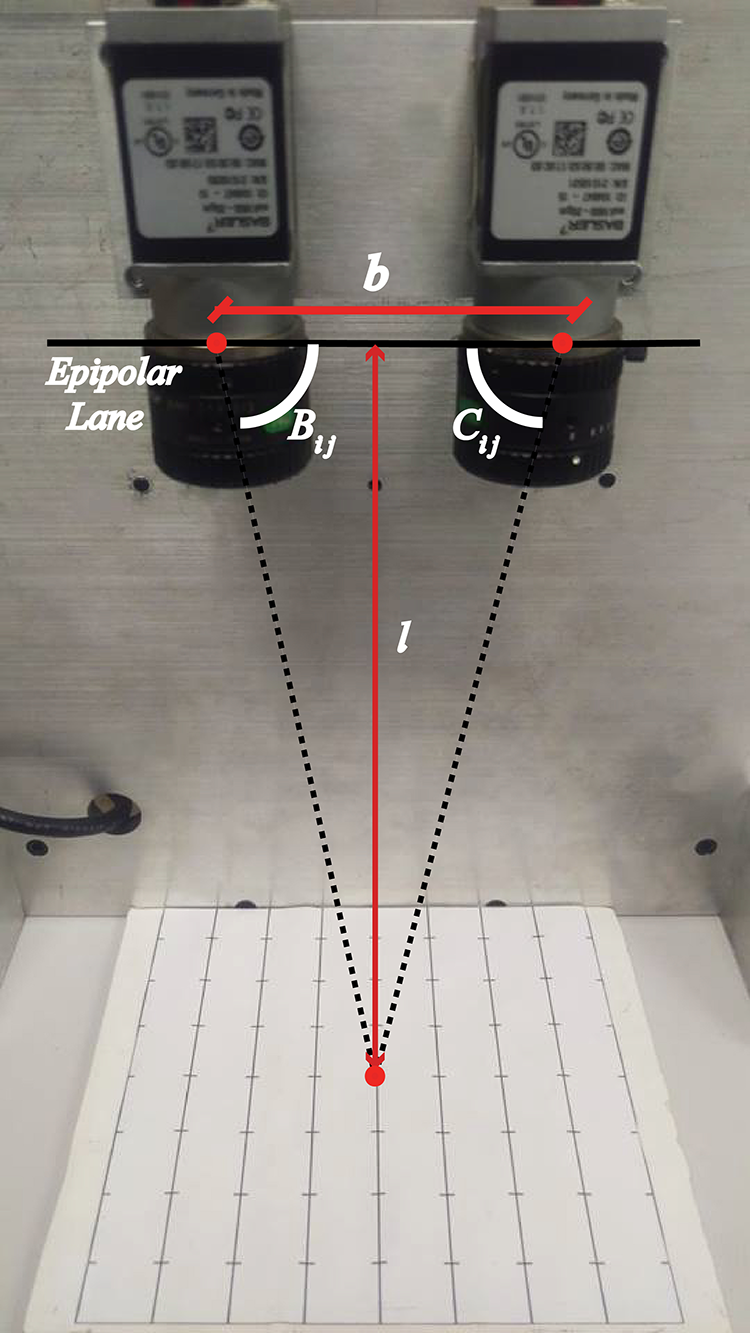
Developed SVS with the angle location in a particular 3-D point. SVS: stereo vision systems; 3-D: three-dimensional.
Images capture
The first step of the developed SVS is to obtain visual information through the image capture of both cameras which will be processed to obtain 3-D points of a particular scene. In this case, a specific test grid with known distances is used, where 3-D points will be obtained. The test grid used is shown in Figure 6, where 63 crosses along the grid can be appreciated, with 2 cm separation between them. The developed SVS locates the center of the crosses and obtains the 3-D coordinate of each one. Due to the displacement between cameras, both cameras capture a different scene, 31,32 and to perform the stereo vision technique, it is required to identify the same scene in the image pair; therefore, the developed computer program is able to choose the region of interest in both cameras. For the experimentation, the test grid is placed in the middle of the cameras (as shown in Figure 5); using a distance from the base line to the test grid at 22.87 cm, the developed computer program locates the same scene with a slight displacement in both images, where 49 of the 63 crosses are observed.
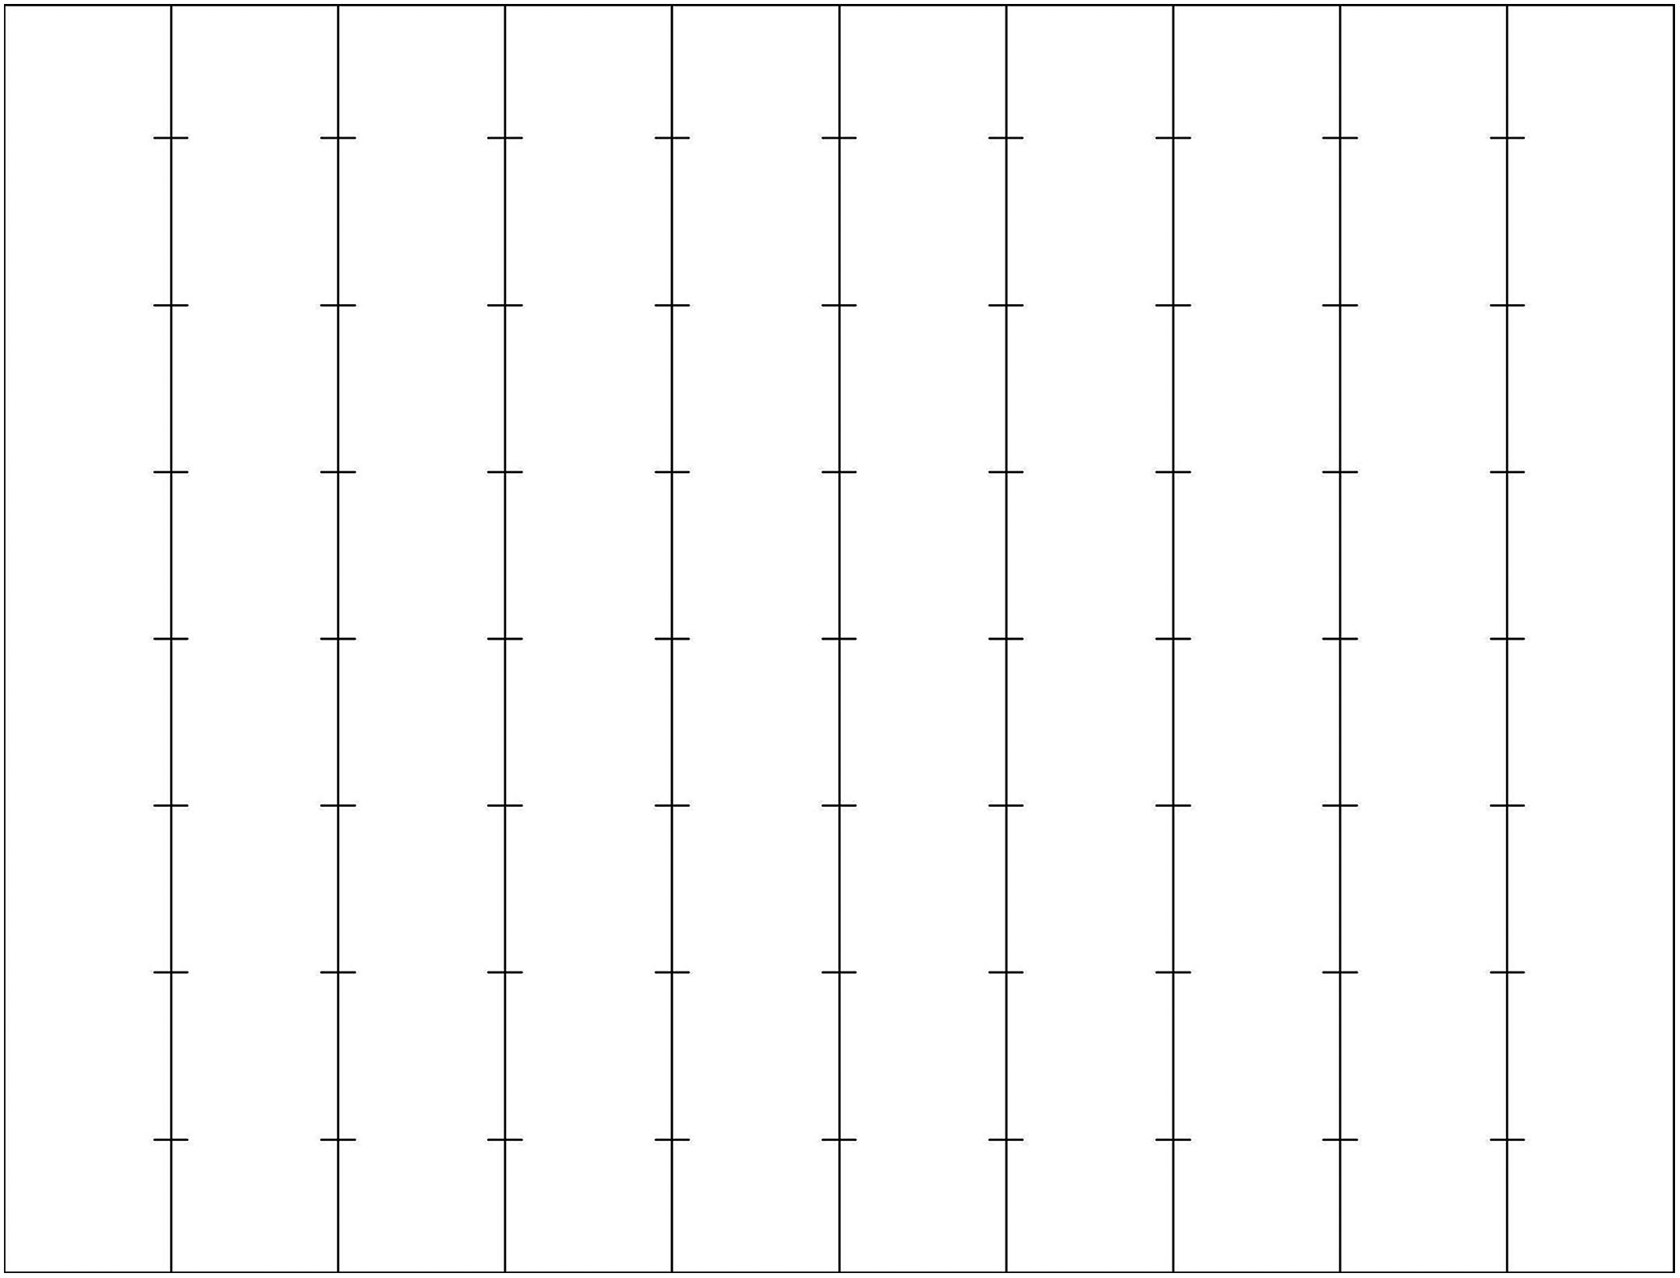
Test grid used for the experimentation.
Camera calibration
The developed calibration method used in SVS consists of four main steps:
Step 1: Estimate the horizontal and vertical angles for each of the crosses in the calibration grid.
Step 2: Use the developed SVS to estimate the same horizontal and vertical angles with the information of left and right camera.
Step 3: With the estimated angles, find the adjustment angles
Step 4: Adjust the angles
In the first step, it is required to obtain the corresponding horizontal and vertical angles for each of the crosses in the calibration grid. The angles can be obtained according to the horizontal and vertical separation that the points have between them for any calibration grid. Figure 7 shows the developed calibration grid, using a total of 285 crosses with a separation of 1 cm between them.

Developed calibration grid with origin in the center.
The angles
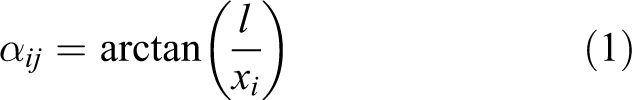

where l is the distance from the base line to the calibration grid, and (xi , yj ) are the coordinates of the located points with origin in the center of the calibration grid. To perform the developed calibration, the calibration grid must be perpendicular to the cameras. In the developed SVS, the cameras are parallel to a metal base which is perpendicular to the surface where the calibration grid is located. With these conditions, the SVS is able to locate 3-D points with great accuracy from any point of view (in the FOV) even if the scene is not perpendicular to the cameras. The second step is to obtain the angles of the corresponding two-dimensional points on the left and right camera using the developed SVS. Figure 8 shows the angle location of the 3-D point projection in both images.

Angle location of the 3-D point projection in both images. 3-D: three-dimensional.
To obtain the angles on the left camera, the center of calibration grid and the center of left camera must be orthogonally aligned. Afterward, pattern matching is used to obtain the pixel coordinates of the points. Considering the origin coordinate in the center of left camera, the angles


where

where

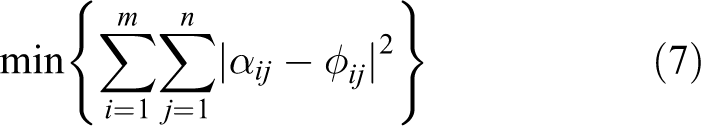

These minimization problems are solved using the least square method, where polynomial equations to find the adjustment angles
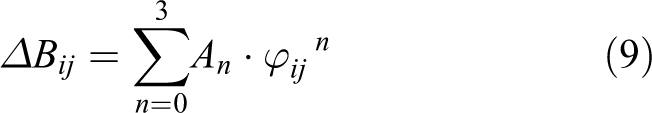
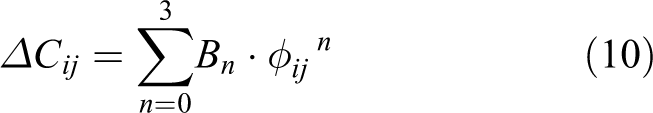

where An
, Bn
, and Cn
are the adjustment coefficients of the functions obtained by the least square method. In the final step, the angles


Pattern match
In this step, the central coordinates in pixels of all the crosses of the test grid are located for both cameras. To estimate the coordinates, pattern matching method (also called area-based image match) is employed. This match method has been widely studied and applied in the literature. 34 –37 In pattern matching, a correlation window of brightness (intensity) patterns is performed between a template image and the two images, providing the regions in each image that has the most correspondence brightness with respect to the template image. 38 The developed computer program uses an image template with dimensions of 20 pixels per side with a cross in the middle. This template is used to locate regions with a similar cross in the middle of 20 pixels per side in the images from both cameras. When the square regions are located, the program estimates the central coordinates in pixels of all the located regions (the coordinates match with the center of the cross in each region). The developed computer program uses a score to identify how closely the template image matches in different regions of both images (score range is between 0 and 1000). The minimum score tolerance to find the pattern matches in the developed program is 800. Common problems presented in the pattern matching are occlusions which occurs when a particular region of the scene is observed in one image but not in the other. 39 Priya and Anand 40 focus on the problem of occlusion and provide a solution to avoid them through a novel modified geometric mapping technique. In the developed program, if the match score is low, or an occlusion is presented, the localized point is not considered in the next step.
Computing pixel coordinates to angles
As shown in Figure 4, the angles

To obtain the angle


Angle

Because both cameras are placed in an epipolar lane, the vertical pixel position of the 3-D point projection in both images is the same. 41,42
Triangulation
Triangulation process is widely used in multiple applications to locate point coordinates in a scene.
43
–45
In the currently developed SVS, the triangulation is performed with the base line of the cameras and the center point position of the crosses in the test grid located in the left and right images. For each triangulation, angles


Experimentation
To test the proposed calibration method, a routine has been developed in LabVIEW, which is able to find 3-D point coordinates with and without using the calibration method. The computer program is enabling to change several settings of the SVS such as camera resolution, FOV (horizontal and vertical), distance from the base line to the scene, base line, and number of rows and columns of the test grid. Also, the computer program indicates the area of interest to search in the image, time localization, and the obtained data of the 3-D points found in the scene. Figure 9 shows the processes performed by the computer program to obtain the coordinates of the points, where it can be appreciated the variables obtained in each process.

Block diagram of the developed SVS. SVS: stereo vision systems.
The first experiment was developed where a surface was scanned at different distances. Figure 10 shows two same grids with a total of 100 crosses separated by a distance of 5 cm in the x-axis. The developed program performed the scan of the crosses two times, one using the developed calibration method and other without using it.

Experiment SVS of a surface at different distances. SVS: stereo vision systems.
A second experiment was developed, obtaining databases of 3-D points at different distances from the base line to the test grid using the proposed method and the developed computer program. For each distance, it obtained two databases, one using the calibration method and another without using it. In the developed experimentation, it obtained 22 databases (534 measurements), changing the distance every 1 cm. For the analysis, four databases were chosen, in which the distance was changed every 3 cm, starting at a distance of 22.87 cm, where two databases with a total of 98 measurements were obtained. Other databases selected were at distances of 19.87, 16.87, and 13.87 cm, where two databases were obtained of each one. Seventy measurements were obtained at 19.87 cm, 30 measurements at 16.87 cm, and 30 measurements at 13.87 cm.
Moreover, the third experimentation was performed, comparing the developed method with the three methods that use extrinsic and intrinsic parameters to calibrate the cameras: method of Zhang, 48 method of Jia et al., 49 and method of Cui et al. 50 For this experimentation, a database of 49 3-D points is estimated at a distance of 22.87 cm using the developed calibration method and the previously mentioned calibration methods in the SVS. Finally, with each estimated database, a reconstruction error is calculated and compared between the calibration methods. The system is able to perform the calibration in 280 ms, while the location of 49 3-D points can be realized in 200 ms. This execution time was obtained using a compact vision system from national instruments, with a processor Intel Atom quad-core 1.91 GHz.
Experimentation results
Referring to the first experiment, Figure 11 shows the scan of the grid on a 3-D view, and Figure 12 shows the scan of the grid at different planes. Figures 11(a) and 12(a) and (c) show a barrel distortion that produces a curvature in straight lines of the images and therefore inaccuracy of the measurements. Moreover, the quality of the images due to the image digitalization causes dispersion of the points in XZ plane (Figure 12(e)). On the other hand, Figures 11(b) and 12(b) to (f) show the corrections of the errors by the developed calibration method.

Scanned surface 3-D view: (a) Uncalibrated scan. (b) Calibrated scan. 3-D: three-dimensional.

Surface scan at different planes: (a) Uncalibrated scan YZ plane. (b) Calibrated scan YZ plane. (c) Uncalibrated scan XY plane. (d) Calibrated scan XY plane. (e) Uncalibrated scan XZ plane. (f) Calibrated scan XZ plane.
For the second experiment, Table 1 shows 10 measurements located along the test grid employing a distance of 22.87 cm from the base line to the test grid. Furthermore, Table 1 shows the absolute error compared with the real database without using the calibration method. In the same way, Table 2 shows the analysis using the calibration method. As it can be appreciated, the measurements on each coordinate are better in the calibrated SVS than the SVS without using the calibration. Averages of absolute errors considering the 49 measurements obtained without using the calibration in x, y, and z coordinates were of 0.6908, 0.0412, and 0.0933 cm, respectively. Otherwise, averages of absolute error in x, y, and z coordinates in the SVS using the calibration were of 0.1307, 0.034, and 0.0512 cm, respectively. These results using the calibration method represent improvements in terms of percentage in x, y, and z coordinates of 81.07%, 17.47%, and 45.12%, respectively.
3-D points localization without using calibration at 22.87 cm (simplified table).

3-D: three-dimensional.
3-D points localization employing the developed calibration method at 22.87 cm (simplified table).

3-D: three-dimensional.
The proposed calibration was performed in other three scenarios, changing the distances from the base line to the test grid at 19.87, 16.87, and 13.87 cm. Figure 13 shows the absolute error comparison of 10 measurements obtained with and without using the calibration method in x coordinate, Figure 14 in y coordinate, and Figure 15 in z coordinate.

Absolute error comparison in x coordinate at 19.87, 16.87, and 13.87 cm (simplified graph).

Absolute error comparison in y coordinate at 19.87, 16.87, and 13.87 cm (simplified graph).

Absolute error comparison in z coordinate at 19.87, 16.87, and 13.87 cm (simplified graph).
In each coordinate, it can be appreciated the improvements of the calibration method, obtaining improvements in averages of absolute errors in x coordinate of 76.65%, 87.86%, and 85.44%, with distances of 19.87, 16.87, and 13.87 cm, respectively. Furthermore, improvements in averages of absolute errors in y coordinate were of 34.53%, 42.28%, and 50.72%. Moreover, improvements in averages of absolute errors in z coordinate were of 50.09%, 51.48%, and 56.13%. With the databases at different distances, a comparative analysis is developed; Table 3 shows the error variability between the estimated data and the real data. Using the SVS without calibration, variabilities greater than 14 mm in x coordinate, in y coordinate greater than 2 mm, and in z coordinate greater than 7 mm was obtained. Implementing the calibration method, the variabilities decrease to a maximum of 3.2 mm in x coordinate, 1.7 mm in y coordinate, and 2.5 mm in z coordinate. Furthermore, a comparative error analysis was performed by employing the mean square error (MSE) that provides a measurement error for each x, y, and z coordinates set of each database obtained. 51
Error variability of the measured coordinates between the estimated data and the real data.

The MSE is obtained by

where Yi
are the real values,
Comparative MSE analysis between the estimated data and the real data.

MSE: mean square error.
For the third experiment, 3-D reconstruction error is used to compare the accuracy of 3-D points localization with different calibration methods.
The mean reconstruction error

where n is the total number of the 3-D points and
Statistics of mean 3-D reconstruction errors of the calibration’s methods in planes XY, XZ, YZ, and XYZ.

3-D: three-dimensional.
As result, the mean errors by the proposed method are 0.454, 0.530, 0.526, and 0.728 mm in planes XY, XZ, YZ, and XYZ, respectively. In Table 5, it can be seen that the accuracy of the proposed method is better than Zhang’s and Jia et al.’s methods in all planes, while Cai et al. present the best accuracy. Although the proposed method improves the accuracy in only two of the three methods, it demonstrates a high accuracy for 3-D points localization. Moreover, the proposed method requires a few number of steps to perform the calibration than Zhang, Jia et al., and Cai et al., obtaining simplicity in the implementation and a lower computational cost than classic calibration methods that require several steps to obtain the necessary parameters of the cameras for calibration.
Conclusions
The developed SVS is able to locate 3-D points in a scene by intensity pattern match localization methods and performing a calibration method to improve accuracy of the measurements. In this article, a novel calibration method for SVS was presented, where using the SVS, several 3-D points at different distances were obtained. Furthermore, a comparative analysis between the obtained databases and the real databases was developed. Moreover, a comparative analysis of mean reconstruction errors in planes XY, XZ, YZ, and XYZ between classic calibration methods and the proposed method was performed. The dispersion error was reduced by employing the calibration method, obtaining the best ranges at 13.87 cm of distance, with error ranges in x coordinate from −1 mm to 1.6 mm, in y coordinate from −0.2 mm to 0.3 mm, and z coordinate from −0.6 mm to 0.7 mm. The MSE results validate the improvements in the localization of 3-D coordinates, obtaining the best MSE reduction in terms of percentage in x, y, and z coordinates of 98.04%, 76.67%, and 83.65%, respectively. Furthermore, the mean reconstruction errors of the proposed method are better in terms of accuracy than Zhang’s and Jia et al.’s methods, with values in planes XY, XZ, YZ, and XYZ of 0.454, 0.530, 0.526, and 0.728 mm, respectively. The proposed method can be used to calibrate the SVS which requires a reliable localization of a specific 3-D point in the scene for decision-making or obtains reliable spatial information, for example, for autonomous navigation tasks and robotic vision applications. Advantage of the developed calibration method is the competitive accuracy in the 3-D points localization and a high execution speed due to the use of only the distortion of the cameras as information to perform the calibration in comparison with actual calibration methods that require many steps to obtain several parameters of the cameras for calibration. The developed calibration can be used in multiple machine vision applications, particularly machine vision applications where descalibrations are expected, and, therefore, it is necessary to perform a fast calibration to ensure the accuracy localization of the 3-D points.
Footnotes
Declaration of conflicting interests
The author(s) declared no potential conflicts of interest with respect to the research, authorship, and/or publication of this article.
Funding
The author(s) disclosed receipt of the following financial support for the research, authorship, and/or publication of this article: This study was supported with funding from Universidad Autónoma de Baja California.