
Abstract
It is important to measure and analyze people behavior to design systems which interact with people. This article describes a portable people behavior measurement system using a three-dimensional LIDAR. In this system, an observer carries the system equipped with a three-dimensional Light Detection and Ranging (LIDAR) and follows persons to be measured while keeping them in the sensor view. The system estimates the sensor pose in a three-dimensional environmental map and tracks the target persons. It enables long-term and wide-area people behavior measurements which are hard for existing people tracking systems. As a field test, we recorded the behavior of professional caregivers attending elderly persons with dementia in a hospital. The preliminary analysis of the behavior reveals how the caregivers decide the attending position while checking the surrounding people and environment. Based on the analysis result, empirical rules to design the behavior of attendant robots are proposed.
Introduction
It is important to measure and analyze people behavior for designing systems which interact with people. We have to understand how people behave with respect to the surrounding people and environment to achieve systems with natural and rich interactions with people. In particular for service robots, by analyzing the behavior of a person who is helping another, we could model their behavior and create a robot with human-like behavior. This allows robots to have natural interaction with humans and makes them more acceptable in daily service situations.
Several models which describe the social interaction between persons, such as social distance 1 and social force model, 2 have been proposed, and a number of works have applied those models to service robots. 3 –5 However, since those models are based on simple analysis of the distance between persons, they cannot describe the influence of the surrounding environment and the other persons. Such limitations may yield unnatural behavior of the robots in complex situations. To realize a robot with natural and acceptable behavior, it is necessary to measure person behavior in diverse situations and construct a sophisticated interaction behavior model.
There are several data sets which provide people behavior in indoor 6 and outdoor environments. 7,8 However, to the best of our knowledge, no data set provides people behavior involving interaction between followed and following persons even though such a situation is very common in daily services. Most of existing robots just keep the distance to the target person constant, and this naive following strategy could make people feel uncomfortable. We believe that it is necessary to measure and analyze people attendant behavior to design the behavior of attendant robots, and it triggered us to develop a system which enables long-term and wide-area people behavior measurement and create a data set which consists of real professional human’s attendant behavior data.
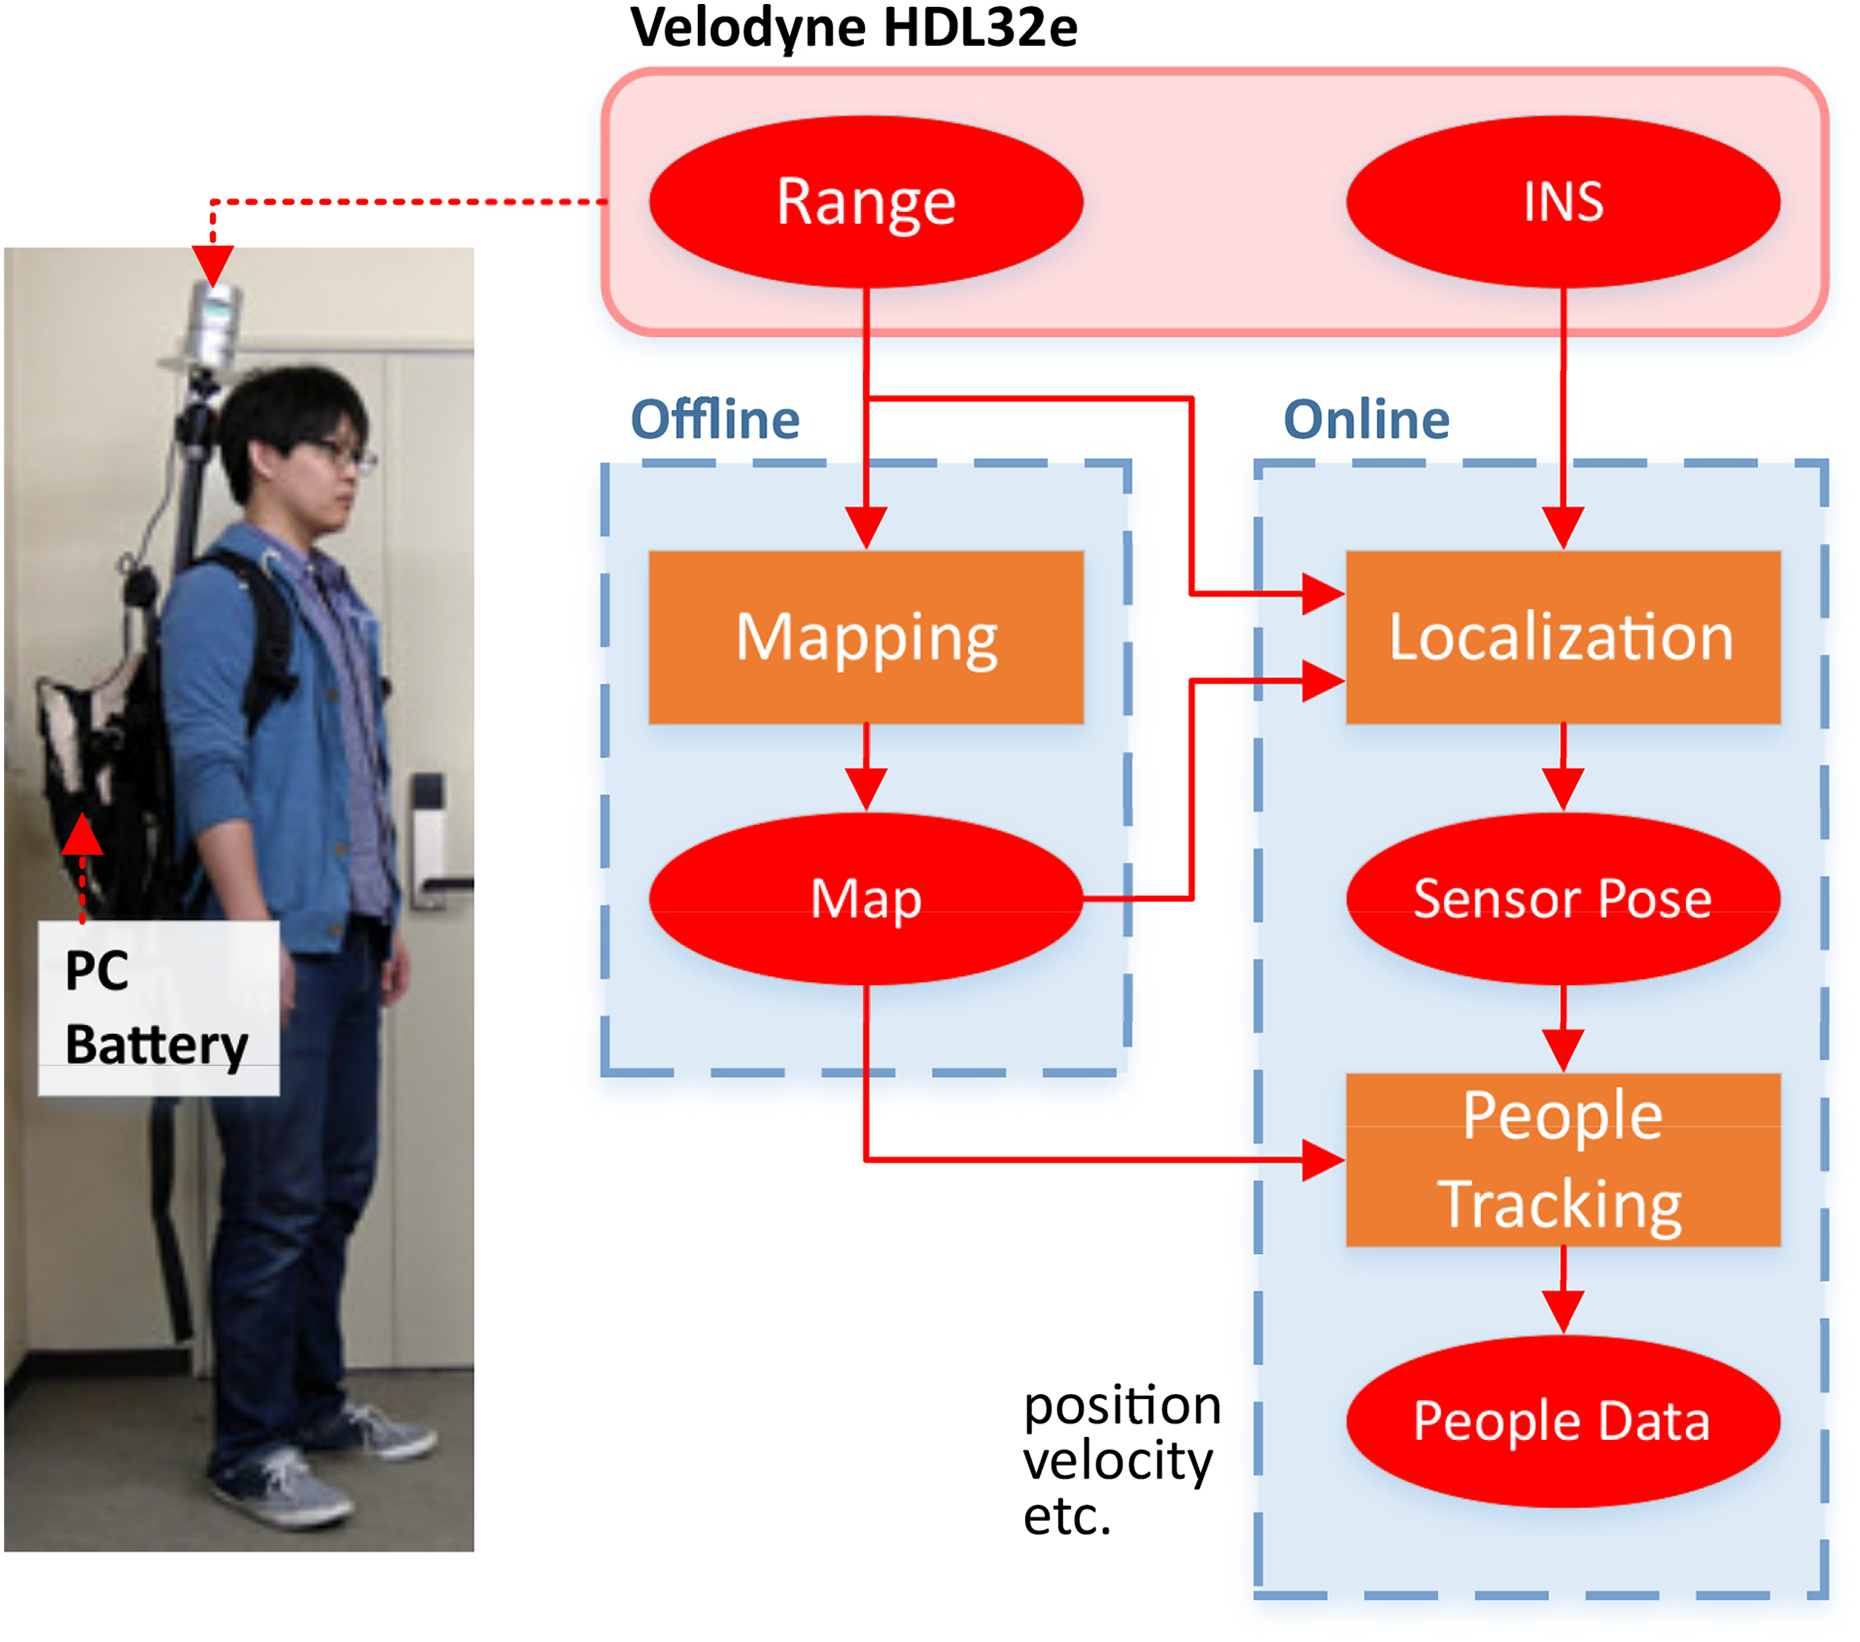
Figure 1 illustrates the proposed system for people behavior measurement. The system is based on a three-dimensional (3-D) LIDAR, and a human observer carries the system and follows the persons to be observed while keeping them in the sensor view. The system simultaneously estimates the sensor pose in a 3-D environmental map and tracks the target persons. The proposed system can be applied to long-term and wide-area people behavior measurement tasks.

The proposed system to measure people behavior using a 3-D LIDAR. The observer carries the backpack with a 3-D LIDAR and follows the persons to be measured. 3-D: three-dimensional.
The contributions of this article are threefold. First, we propose a portable measurement system which enables long-term and wide-area people behavior measurements. We validated that the tracking accuracy of the proposed system is comparable to a static sensor-based people tracking system. Second, we provide a preliminary analysis of a field test of the proposed system in a hospital. We recorded the behavior of professional caregivers attending elderly persons with dementia. The results show that the proposed system can be applied to the measurement of real people behavior. In addition to that, based on the analysis results, we propose empirical rules to design the behavior of attendant robots. Third, we provide the software of the system and the recorded people behavior as open-source and a public data set (http://github.com/koide3/hdl_graph_slam, and http://www.aisl.cs.tut.ac.jp/database_fukushimura.html). They would be useful to measure and analyze people behavior in situations which are hard for existing people tracking systems.
The rest of the article is organized as follows. The following section explains related work. The third section describes an overview of the proposed system. The fourth and fifth sections describe the offline Simultaneous Localization and Mapping (SLAM) method using a 3-D LIDAR and the online people behavior measurement method which includes sensor localization and people tracking, respectively. The sixth section explains a field test in a hospital and provides a preliminary analysis of the field test. The last section concludes the article and discusses future work.
Related work
Systems to measure people behavior can be categorized into two groups: (1) systems using static sensors which are fixed at the environment and (2) systems using wearable sensors attached to the target persons.
People tracking using static sensors, such as cameras and laser range finders, has been widely studied. In particular, people tracking using cameras for surveillance is a major research topic in the computer vision community. A lot of works have proposed people detection 9 and tracking methods 10 using RGB cameras. Recent inexpensive consumer RGB-D cameras allow us to reliably detect and track people, 11 and a camera network system for people tracking using RGB-D cameras has been proposed. 12 Although such works provide reliable people tracking, a capability of recovering the track of a person, who left the camera view once, is necessary. This problem (i.e. person reidentification) has been one of the main research topics of vision-based people tracking systems. A lot of reidentification methods based on people appearance 13 –16 and soft biometric features 17,18 have been proposed. They enable reliable people reidentification over time and over cameras.
Laser range finders have also been used for people tracking systems. 19,20 Such systems can very accurately localize people, and the measurement area of each sensor is larger than cameras. While the reliability and the detection accuracy of those static sensor-based systems are very good, they can measure people behavior only in an area limited by the sensor view. In order to cover a large environment, they require the placement of a lot of static sensors, thereby increasing the time and cost of installing and calibrating all the sensors.
Another way to measure the behavior of specific persons for a long time over a wide area is to attach a wearable sensor to each target person and measure their behavior with the sensor. Several kinds of sensors, such as inertia navigation system (INS) and global positioning system (GPS), have been used for this purpose. Recent small wearable GPS sensors allow us to track a person in outdoor environments, and they have been applied to several applications of people behavior measurement and analysis. 21,22 As an application, GPS-based wearable devices for helping elderly or visually impaired people have been proposed. 23,24 The combination of GPS and INS improves tracking accuracy under low-level GPS radio power. 25 However, GPS signals are not available in places close to buildings and indoor environments.
Recently, Wi-Fi signal-based localization has been widely studied. 26 –28 Some of them are based on triangulation of Wi-Fi signal strength and show decimeter or centimeter accuracy in ideal situations. 26,27 However, they require to place multiple antennas in the environment to accurately estimate the device position, and thus, it is hard to be applied to a large environment. Other ones are based on the matching of Wi-Fi fingerprint matching. 28 While they do not rely on external antennas and can be applied to large environments where Wi-Fi signal is available, the estimation accuracy is very limited.
Behavior measurement systems for indoor environments based on pedestrian dead reckoning have also been proposed. 29,30 Those methods estimate the target person position by integrating acceleration and angular velocity obtained by an INS (attached to the person). In order to prevent estimation drift, Li et al. combined pedestrian dead reckoning and map-based localization. 29 Those methods can keep track the position of the person as long as they hold the sensor. Since they utilize smartphones which are very common and inexpensive in recent years, those methods are cost-effective and easy to adopt. However, since INS is an internal sensor and it cannot sense the surrounding environment, it is hard to accurately measure the person position with respect to the environment and other persons’ positions. Thus, they cannot be applied to the measurement of the interaction between persons and that of person’s behavior affected by the environment.
System overview
Figure 2 shows an overview of the proposed system. In this system, the observer carries the backpack equipped with a 3-D LIDAR (velodyne HDL-32e) and a PC and follows the persons to be measured. The 3-D LIDAR provides 360° range data at 10 Hz, and from the range data, the system estimates its pose while tracking the target persons. The process of the proposed system consists of two phases: (1) offline environmental mapping and (2) online sensor localization and people detection/tracking.
System overview.
In the offline mapping phase, we create a 3-D environmental map which covers the entire measurement area. For the mapping, we employ a graph optimization-based SLAM approach (i.e. Graph SLAM 31 ). In order to compensate accumulated rotational errors of the scan matching, we introduce ground plane and GPS position constraints for indoor and outdoor environments, respectively.
In the behavior measurement phase, the system estimates its pose on the map created offline by combining a scan matching algorithm with an angular velocity-based pose prediction using unscented Kalman filter (UKF). 32 Simultaneously, the system detects and tracks the target persons.
Offline environmental mapping
Graph SLAM
Graph SLAM is one of the most successful approaches to the SLAM problem. In this approach, the SLAM problem is solved by constructing and optimizing a graph whose nodes represent parameters to be optimized, such as sensor poses and landmark positions, and edges represent constraints, such as relative poses between sensor poses and landmarks. The graph is optimized so that the errors between the parameters and the constraints are minimized. Following,
31,33
let

where
However, if the parameters span over non-Euclidean spaces (like pose parameters), those algorithms may lead to suboptimal or invalid solutions. One way to deal with this problem is to perform the error optimization on a manifold which is a minimal representation of the parameters and acts as a Euclidean space locally. In order to enable it, an operator ⊞ is introduced, which transforms a local variation
Typically, in the 3-D SLAM problem, node

where
In the proposed system, we first estimate the sensor trajectory by iteratively applying normal distributions transform (NDT) scan matching
34
between consecutive frames. For 3-D LIDARs, NDT shows a better performance than other scan matching algorithms, such as iterative closest points,
35
in terms of both the reliability and the processing speed.
36
Let
Loop-detection


The loop detection algorithm is similar to the work of Nelson. 37 First, we detect loop candidates based on the translational distance and the length of the trajectory between nodes (lines 2–11). Then, to validate the loop candidates, a scan matching algorithm (in our case, NDT) is applied between the nodes of each candidate. If the fitness score is lower than a threshold (e.g. 0.2), we add the loop to the graph as an edge between the nodes (lines 12–17). Every time a loop is found, the pose graph is updated such that equation (1) is minimized. We utilize g2o, a general framework for hypergraph optimization, 33 for the pose graph optimization.
As a generated map gets larger, it tends to be bent due to the accumulated rotational error of the scan matching (see Figure 3). In order to compensate the error, we introduce ground plane and GPS position constraints for indoor and outdoor environments, respectively. Figure 4 shows an illustration of the graph structure of the proposed system.

Comparison of the sensor trajectories estimated by the existing method and the proposed method. (a) BLAM. (b) LeGO-LOAM. (c) Ours without plane constraints. (d) Ours with plane constraints.

The proposed pose graph structure.
Ground plane constraint
To reliably generate the map of a large indoor environment, we assume that the environment has a single flat floor and introduce the ground plane constraint which optimizes the pose graph such that the ground plane detected in each observation becomes the same plane. This assumption is valid in many indoor public environments, such as schools and hospitals.
We assume that the approximate height of the sensor is known (e.g. 2 m) and extract points within a certain height range which should contain the ground plane points (e.g. (−1.0, +1.0) m from the ground). Then, we apply RANSAC
38
to the extracted point cloud and detect the ground plane. If the normal of the detected plane is almost vertical (the angle between the normal and the unit vertical vector is lower than 10°), we consider that the ground plane is correctly detected and add a ground plane constraint edge to the graph. Figure 5 shows an example of the detected ground planes. Green points are the points extracted by the height thresholding, and red points belong to the ground plane detected by RANSAC. We detect the ground plane every 10 s and connect the corresponding sensor pose node

Ground plane detection. Points within a certain height range are extracted by height thresholding (green points), and then RANSAC is applied to them to detect the ground plane (red points). The horizontality of the ground plane is validated by checking the plane normal.
To calculate the error between sensor pose


where
Following Ma et al.’s
39
work, we employ the minimum parameterization


where
GPS constraint
In outdoor environments where the ground is not flat, we use the GPS-based position constraint instead of the ground plane constraint. For ease of optimization, we first transform GPS data into the universal transverse mercator coordinate, where a GPS data has easting, northing, and altitude values in a Cartesian coordinate. Then, each GPS data is associated with the pose node, which has the closest time stamp to the GPS data, as a unary edge of the prior position information.
The error between the translation vector

SLAM framework evaluation
In order to validate the proposed SLAM system, we recorded a 3-D point cloud sequence in an indoor environment. Figure 6 shows the experimental environment and the trajectory of the sequence. The duration of the sequence is about 45 min (2700 s), and the length of the trajectory is about 2400 m (estimated by the proposed method).
The experimental environment. The duration of the sequence is about 45 min, and the length of the trajectory is about 2400 m.
For comparison, we generated 3-D environmental maps using the proposed method with and without plane constraints. We also applied existing publicly available SLAM frameworks, BLAM 37 and LeGO-LOAM, 40 to this data set.
Figure 3 shows the trajectories estimated by the different SLAM algorithms. BLAM and LeGO-LOAM were aborted in the middle of the sequence when they failed to estimate the trajectory and did not recover. BLAM failed to find the loops due to the accumulated rotation error of the scan matching and generated a warped and inaccurate trajectory. Since LeGO-LOAM maintains the local consistence of the ground plane between consecutive frames, the estimated trajectory is flatter than the one estimated by BLAM. However, it still suffers from the accumulated rotational error due to the lack of the global ground constraint. Eventually, it failed to estimate the trajectory when the observer made a u-turn at the end of a narrow corridor.
With and without the plane constraint, the proposed method could construct pose graphs properly thanks to the reliability of NDT, and it generated consistent maps. However, without the plane constraint, the resultant map is warped due to the accumulated rotational error which is hard to be corrected by loops on a plane. With the ground plane constraint, the accumulated rotational error is corrected, and the resultant map is completely flat. Figure 7 shows the generated environmental map. The color indicates the height of each point. The floor has the consistent height thanks to the plane constraint. The result shows that the proposed plane constraint is effective to compensate the accumulated rotational error in a large indoor environment.

The created environmental map. The color indicates the height of each point. The height of the floor is consistent thanks to the plane constraint.
Table 1 shows the processing time of the proposed method and BLAM. The processing time of LeGO-LOAM is not available here, since it provides only real-time processing. While BLAM took about 15,327 (s) to generate the map, the proposed method took about 5392 (s) thanks to the computational efficiency of NDT.
Processing time of BLAM and our SLAM system.

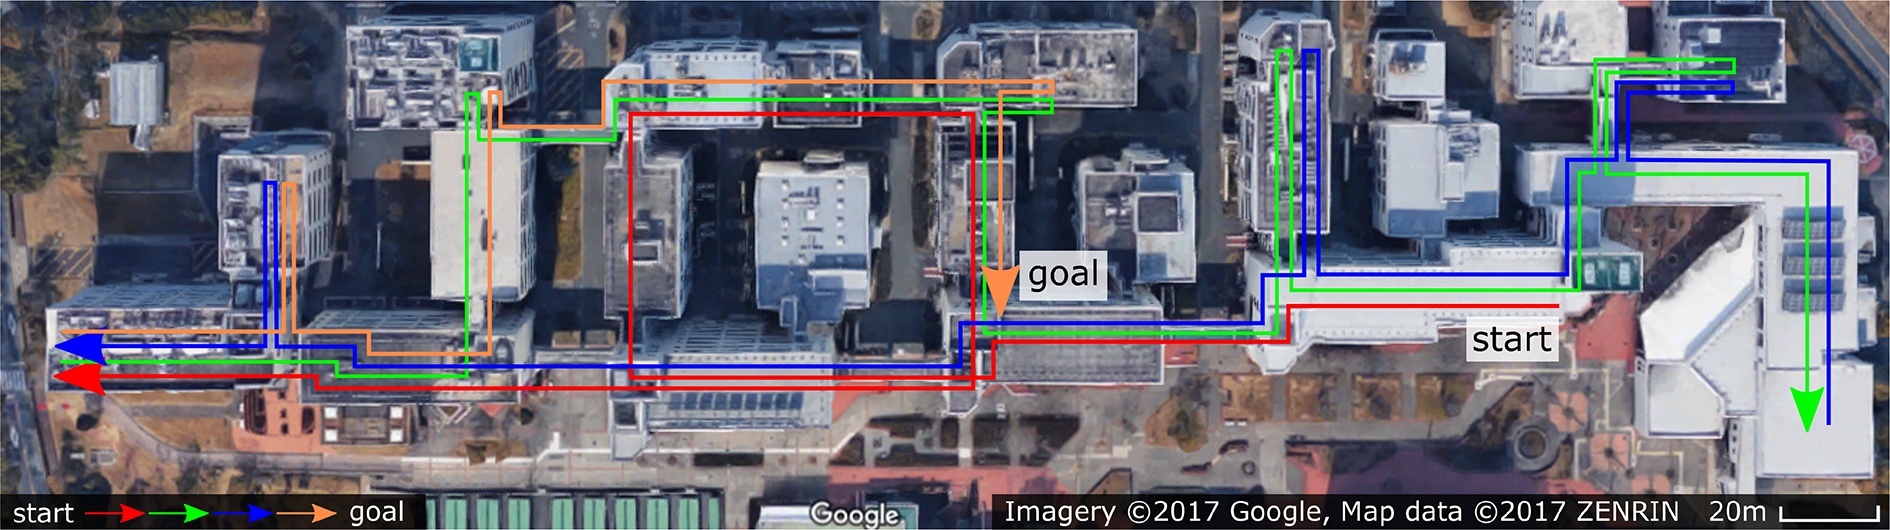
We also validated the proposed method in an outdoor environment. Figure 8(a) shows the environment and the trajectory of the sequence. The duration of the sequence is about 42 min (2500 s). Figure 8(b) shows the map generated by the proposed method with the GPS constraint. Although there were large undulations, the system correctly found loops and constructed a proper pose graph thanks to the GPS constraint. Note that, without the GPS constraint, the system could not find the loop due to the scan matching error and failed to create the environmental map.

The SLAM system validation in an outdoor environment. (a) The outdoor environment. The duration of the sequence is about 42 min, and the length of the trajectory is about 3000 m. (b) The 3-D map of the outdoor environment generated by the proposed method with GPS constraints. The color indicates the height of each point. 3-D: three-dimensional; GPS: global positioning system.
Online people behavior measurement
In order to measure people behavior, the system simultaneously estimates the sensor pose on the 3-D environmental map and tracks people around the observer. Figure 9 shows an overview of the online sensor localization and people tracking system. By integrating angular velocity and range data provided by the LIDAR, the system estimates the sensor pose. Then, it detects and tracks people to know people positions with respect to the environmental map. Note that the initial pose of the sensor is given by hand to avoid the global localization problem.

The online sensor pose estimation and people detection and tracking system.
Sensor localization
We can estimate the sensor ego motion by iteratively applying a scan matching algorithm as in the SLAM part. However, in contrast to the SLAM scenario, the observer has to follow the target persons during the measurement and sometimes has to move quickly to keep them in the sensor view. In such cases, the sensor motion between frames gets very large and the scan matching may wrongly estimate the sensor ego motion due to the large displacement. In order to deal with this problem, we integrate the NDT scan matching with angular velocity data provided by the 3-D LIDAR using UKF. 32
We define the sensor state to be estimated as

where

where

With equation (9), the system predicts the sensor pose by using UKF and then applies NDT to match the observed point cloud with the global map with the estimated

We normalize the quaternion in the state vector after each of the prediction and correction steps to prevent its norm from changing due to the unscented transform and the accumulated calculation error. It is worth mentioning that we also implemented pose prediction which takes acceleration into account. However, the estimation result got worse due to the strong noise on acceleration observations.
People detection and tracking
We first remove the background points from an observed point cloud to extract the foreground points. Then, we create an occupancy grid map with a certain voxel size (e.g. 0.5 m) from the environmental map. The input point cloud is transformed into the map coordinate according to the sensor pose estimated by UKF, and then each point at a voxel containing environmental map points is removed as the background. The Euclidean clustering is then applied to the foreground points to detect human candidate clusters. However, in case persons are close together, their clusters may be wrongly merged and are detected as a single cluster. To deal with this problem, we employ Haselich’s split-merge clustering algorithm. 41
The algorithm first divides a cluster into subclusters until each cluster gets smaller than a threshold (e.g. 0.45 m) by using dp-means 42 so that every cluster does not have points of different persons. Then, if there is no gap between those subclusters, the clusters are considered to belong to a single person and remerged into one cluster. Figure 10 shows an example of the detection results. The person clusters are correctly separated even when they are very close together thanks to the split and the remerge process.

Haselich’s clustering algorithm. The green bounding box indicates the Euclidean clustering result. Two persons are wrongly detected as a single cluster. The cluster is divided into small subclusters (red bounding boxes) and then remerged if there is no gap between those subclusters. The blue bounding boxes are the final detection result. (a) Top view. (b) Bird’s eye view.
The detected clusters may contain nonhuman clusters (i.e. false positives). To eliminate nonhuman clusters among detected clusters, we judge whether a cluster is a human or not by using a human classifier trained with slice features by Kidono et al. 43 and Schapire and Singer. 44 Assuming that persons walk on the ground plane, we track persons on the XY plane without the height. We employ the combination of Kalman filter with the constant velocity model and global nearest neighbor data association 45 to track persons. The tracking scheme works well as long as the tracked persons are visible from the sensor and are correctly detected.
Sensor localization evaluation
To show how the pose prediction improves the sensor localization, we conducted a sensor localization experiment. Figure 11 shows the experimental environment. An observer carries the system and moves along the corridor, and the system estimates its pose from the range and angular velocity data. We conducted the experiment twice. In the first trial, the observer walked (about 1.5 m/s) to avoid the sensor being moved quickly. In the second trial, the observer ran (about 3.0 m/s) and the sensor got shaken very strongly.

The experimental environment of the sensor localization experiment.
Figure 12 shows the results of the first trial. Figure 12(a) shows the estimated trajectories with and without the pose prediction. Since the observer moved slowly during the first sequence, both the results show the same correct trajectory. To assess the effect of the sensor pose prediction, we assume that the trajectories estimated by NDT are mostly correct, and we compare the predicted sensor poses with the poses estimated by NDT since measuring the ground truth of the sensor trajectory is difficult. Figure 12(b) and (c) shows the difference between the predicted sensor pose (initial guess pose) and the one estimated by NDT. In the case without the pose prediction, the previous matching result is used as an initial guess. With the prediction, the translational and rotational pose prediction errors significantly decrease thanks to the constant velocity model and the consideration of angular velocity, respectively.

The results of the first trial of the sensor localization experiment. The observer walked during the trial (about 1.5 m/s). Both the trajectories with and without the angular velocity-based pose prediction are correctly estimated. With the prediction, the initial guess for NDT significantly gets closer to the correct pose. (a) Estimated trajectories. (b) Difference between the predicted and the corrected positions. (c) Difference between the predicted and the corrected rotations. (d) Processing time. NDT: normal distributions transform.
The results of the second trial are shown in Figure 13. The system failed to estimate the sensor pose without the pose prediction (see Figure 13(a)) since the observer moved very quickly, and the sensor displacement between frames got larger. The NDT matching took a longer time (about 56 ms per frame) without the pose prediction since the large displacement between frames makes NDT need more iterations to converge to a local solution. With the prediction, the matching took about 45 ms per frame thanks to the good initial guess (see Table 2). The results show that the angular velocity-based pose prediction makes the pose estimation robust to quick motions and fast to converge.
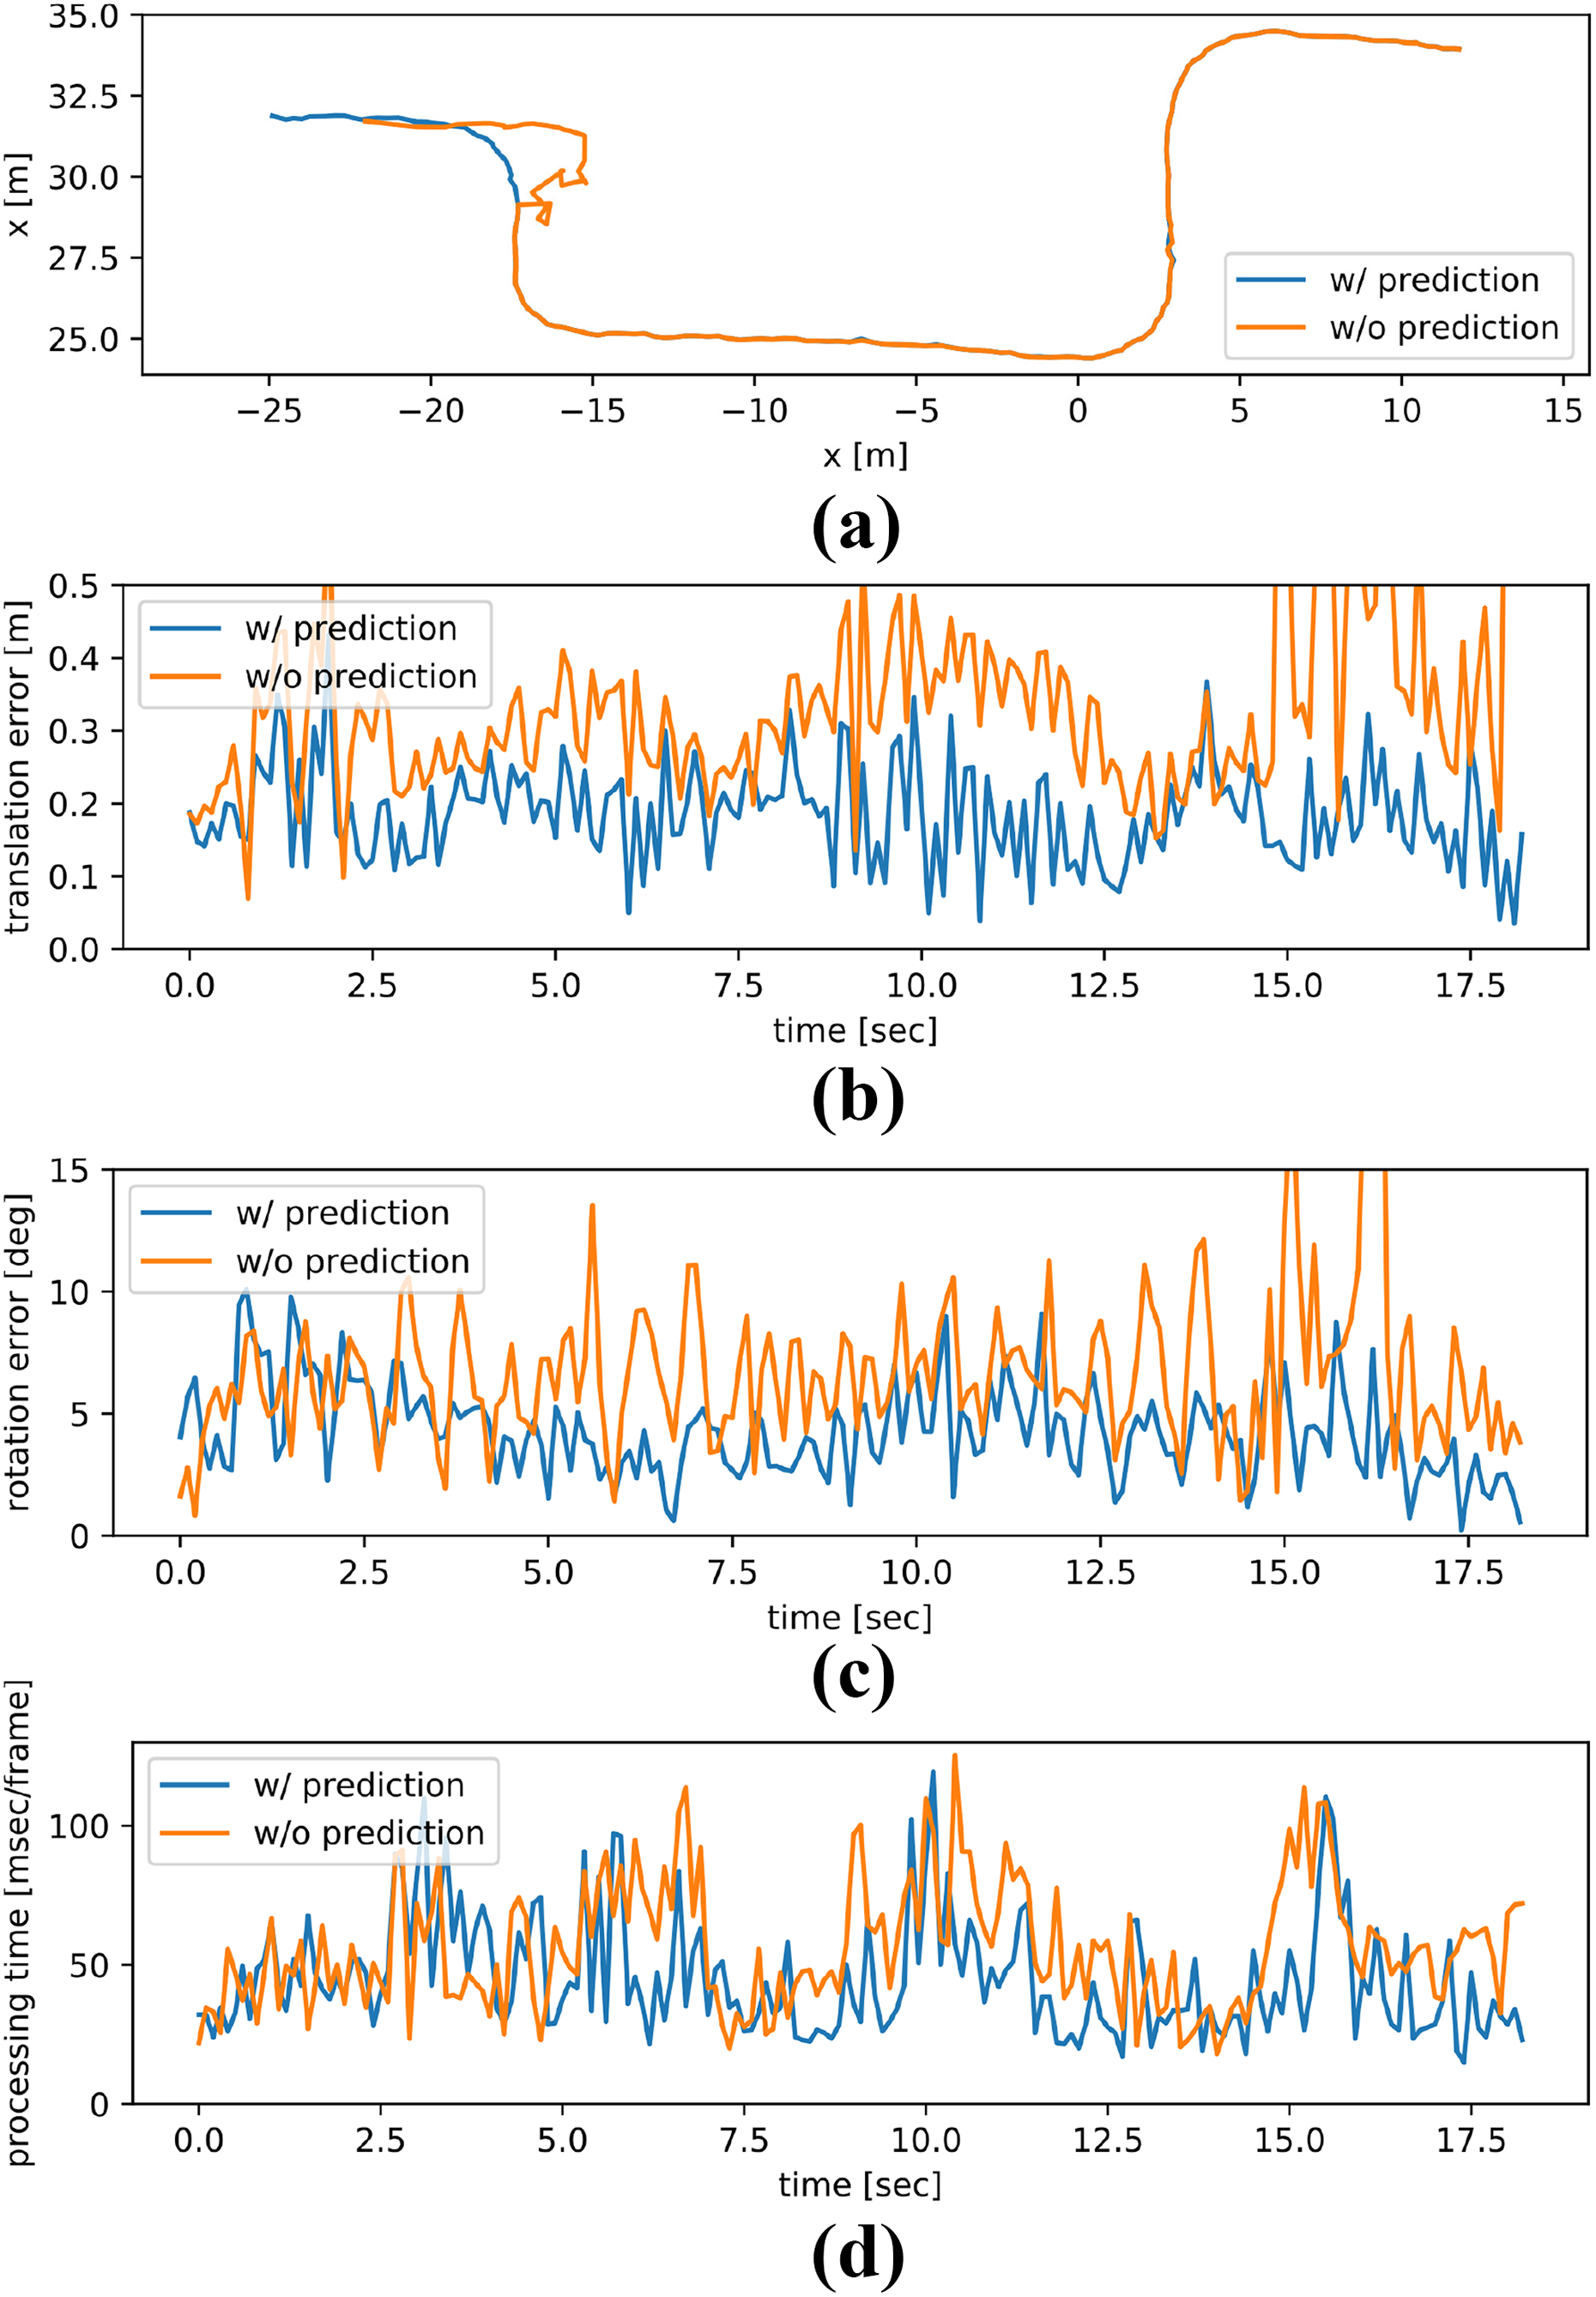
The results of the second trial of the sensor localization experiment. The observer ran during the trial (about 3.0 m/s). Without the pose prediction, the system could not correctly estimate the pose due to the very quick motion. (a) Estimated trajectories. (b) Difference between the predicted and the corrected positions. (c) Difference between the predicted and the corrected rotations. (d) Processing time.
The summary of the sensor localization experiment.

People detection evaluation
To analyze the effect of the split-merge clustering 41 and the human classifier, 43 we recorded a 3-D range data sequence, in which two persons are close together and walking side by side. It is a hard situation for the usual Euclidean clustering since the persons’ clusters may be merged into a single cluster. The number of frames is 102, and we applied the human detection method with and without the split-merge clustering and the human classifier to this sequence.
Table 3 shows the evaluation result. Without both the techniques, the recall value is low (0.834), since clusters of the persons are sometimes detected as a single cluster due to the Euclidean clustering. With the split-merge clustering, the wrongly merged clusters are split into subclusters, and the recall value gets higher (0.995). With both the split-merge clustering and the human classifier, over split subclusters are eliminated by the classifier, and the highest F-measure value is achieved (0.961). This result shows that, in situations where persons are close together, the split-merge clustering 41 effectively increases the recall of human detection, and by combining it with the human classifier, 43 we can obtain reliable human detection results.
The people detection evaluation result.

Comparison with a static sensor-based people tracking system
In order to reveal the pros and cons of the proposed system, we compared the proposed system with a publicly available static sensor-based people tracking framework, OpenPTrack. 12 The framework is designed for people tracking using static RGB-D cameras, and it is scalable to a large camera network. Moreover, it uses cost-effective hardware and is easy to setup. It has been operated by people including nonexperts in computer vision, such as artists and psychologists.
Figure 14 shows the experimental environment and the configuration of the RGB-D camera network. The map is created by the proposed SLAM method. We placed nine Kinect v2s so that they cover about 2 × 20 m2 area. We calibrated the camera network according to the procedure provided by OpenPTrack and then estimated the transformation between the environmental map and the camera network by performing ICP registration between point clouds of the Kinects and the environmental map.

The experimental environment and the configuration of RGB-D cameras for OpenPTrack. Nine Kinect v2s are placed in the corridor. While OpenPTrack can measure only the limited area covered by cameras (about 2 × 20 m2 area), the proposed system can cover the whole of the floor.
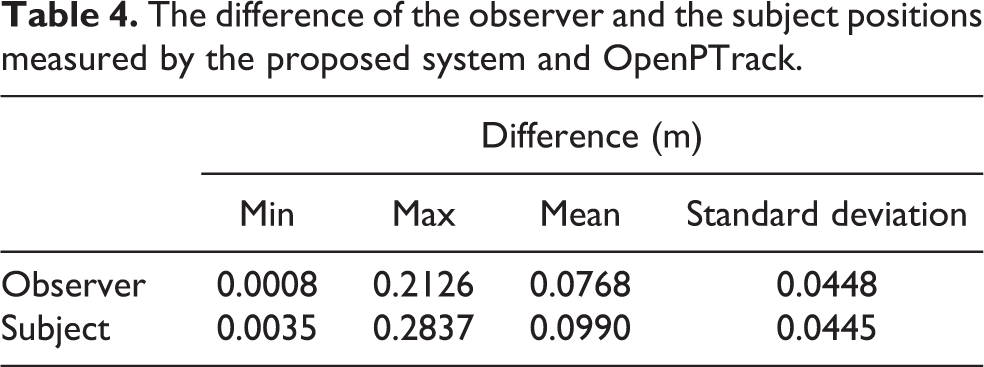
While a subject walked in the corridor, an observer carrying the proposed system followed him. The trajectories of both the persons were measured by the proposed system and OpenPTrack. Table 4 shows the summary of the differences between the people positions measured by the proposed system and OpenPTrack. The differences sometimes became larger (about 0.2–0.3 m) due to detection errors of OpenPTrack at the border of the camera view. However, the difference is lower than 0.1 m on average, and the result shows that the measurement accuracy of the proposed system and the static sensor-based people tracking system are comparable.
The difference of the observer and the subject positions measured by the proposed system and OpenPTrack.
In summary, the tracking accuracy of the proposed portable system is comparable to the static sensor-based system, and the measurement area of the proposed system can be extended easily. For instance, the system can measure the people behavior over the whole area of the map shown in Figure 7 (200 × 50 m2). We would need hundreds of cameras to cover the whole area of the map if we used a static sensor-based system in the environment. On the other hand, static sensor-based systems can measure behavior of all people in the covered area simultaneously, while the proposed system covers only the surrounding area. Thus, we can say that the proposed system is suitable to measure the behavior of specific people over a large area, while static sensor-based systems are suitable for behavior measurement of all the people in a relatively small environment.
Field test in a hospital
Measuring behavior of caregivers attending elderly persons
To show that the proposed system can be applied to real people behavior measurements, we conducted a field test in Sawarabikai Fukushimura hospital. The hospital is specialized for elderly care, and hundreds of elderly patients are hospitalized and receiving care and rehabilitation in the hospital. Under permission granted by the hospital, we recorded professional caregivers’ behavior while they attend elderly persons with dementia. Figure 15 shows a snapshot of the field test. The caregiver attends the elderly to prevent accidents (such as stumbling, colliding, and falling) and sometimes guides him/her to their room.
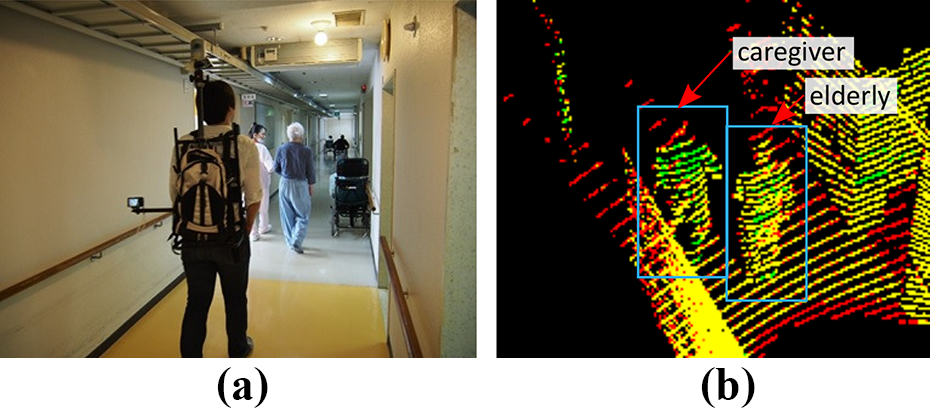
A snapshot of the field test. The behavior of the care giver attending an elderly is recorded by using the proposed system. (a) Image. (b) Range data.
The number of sequences is 33, and the total duration is about 52 min. We also recorded an attendant behavior sequence in an outdoor environment shown in Figure 8. The duration of the outdoor sequence is about 22 min. Note that, for privacy reasons, we captured images during only the sequence shown in Figure 15 with the special permission from the hospital, the subject, and his family. In the other sequences, we recorded only range data. It is a merit of the proposed system that it can measure people behavior without privacy problems.
Figure 16 shows the created indoor environmental maps through the field test. The elderly persons take rest at the dining hall on the first floor and then return to their hospital room on the second floor with a caregiver using the elevator. After they ride the elevator, we switch the map from the one of the first floor to the second floor.

The environments of the field test. (a) Hallway (1F). (b) Ward (2F).
During the measurement, there were other patients and objects, such as wheelchairs and medicine racks, and the observer sometimes had to move quickly to keep the subjects in sensor view. However, the proposed system could correctly localize itself through all the sequences thanks to the wide measurement area of the 3-D LIDAR and the integration of the scan matching and the angular velocity-based pose prediction.
Regarding people tracking, the system failed to keep track of the subjects when a patient came between the observer and the subjects to be observed, and new IDs were assigned to the subjects after they reappeared. In such cases, the system notifies that it lost the track of subjects, and we reassigned correct IDs to them by hand. Since we saw those cases only a few times, the system could keep track of the subjects for the most part of the sequences, and we could reassign all the IDs with the minimum effort.
Preliminary analysis of the attendant behavior
To show the possibility of the behavior analysis with the proposed system, we provide preliminary analysis of the measured behavior sequences.
Figure 17(a) shows the distribution of the distance between a caregiver and an elderly person in the indoor environment. The distribution is unimodal, and the peak is at about 0.6 m. In proxemics, this distance is categorized as “Personal distance (0.45–1.2 m),” and people allow only familiar people to be within this distance 1 while they keep more distance (i.e. “Social distance (1.2–3.6 m)”) when meeting or interacting with unfamiliar people. It implies that people maintain a closer relationship while attending another person comparing to usual people interaction, such as meeting. Figure 17(b) shows the distribution of the caregivers’ position with respect to the elderly persons. The caregivers usually locate at the side of the elderly persons. In order to lead the elderly persons, they slightly precede the patients. The distribution is a bit anisotropic: when a caregiver is following an elderly person, the distance between them tends to be larger since the caregivers see the elderly person and the surrounding environment at the same time. From this preliminary analysis, we can find that the caregivers decide their attending position in order to keep the elderly person in the view and look ahead in the environment.

An analysis of the people attending behavior during the field test in an indoor environment. (a) The distribution of the distance between the elderly person and the caregiver. (b) The distribution of the relative position of the caregiver with respect to the elderly person.
Figure 18(a) shows the trajectories of the caregivers and the elderly persons at a corner, and it also suggests the importance of visibility for deciding the attending position. The number of the trajectories is 17. The caregivers tend to walk on the outer side of the corner (15 of 17). We can consider that, by walking at the outer side, the caregivers keep the outlook of the corridor to prevent accidents, such as stumbling and colliding. The caregivers walk on the inner side in a few cases (2 of 17). However, they preceded the elderly persons in order to check the safeness before the elderly persons enter the corner. These results suggest that the caregivers always check the existence of other surrounding people and objects, such as wheelchairs, to prevent accidents.
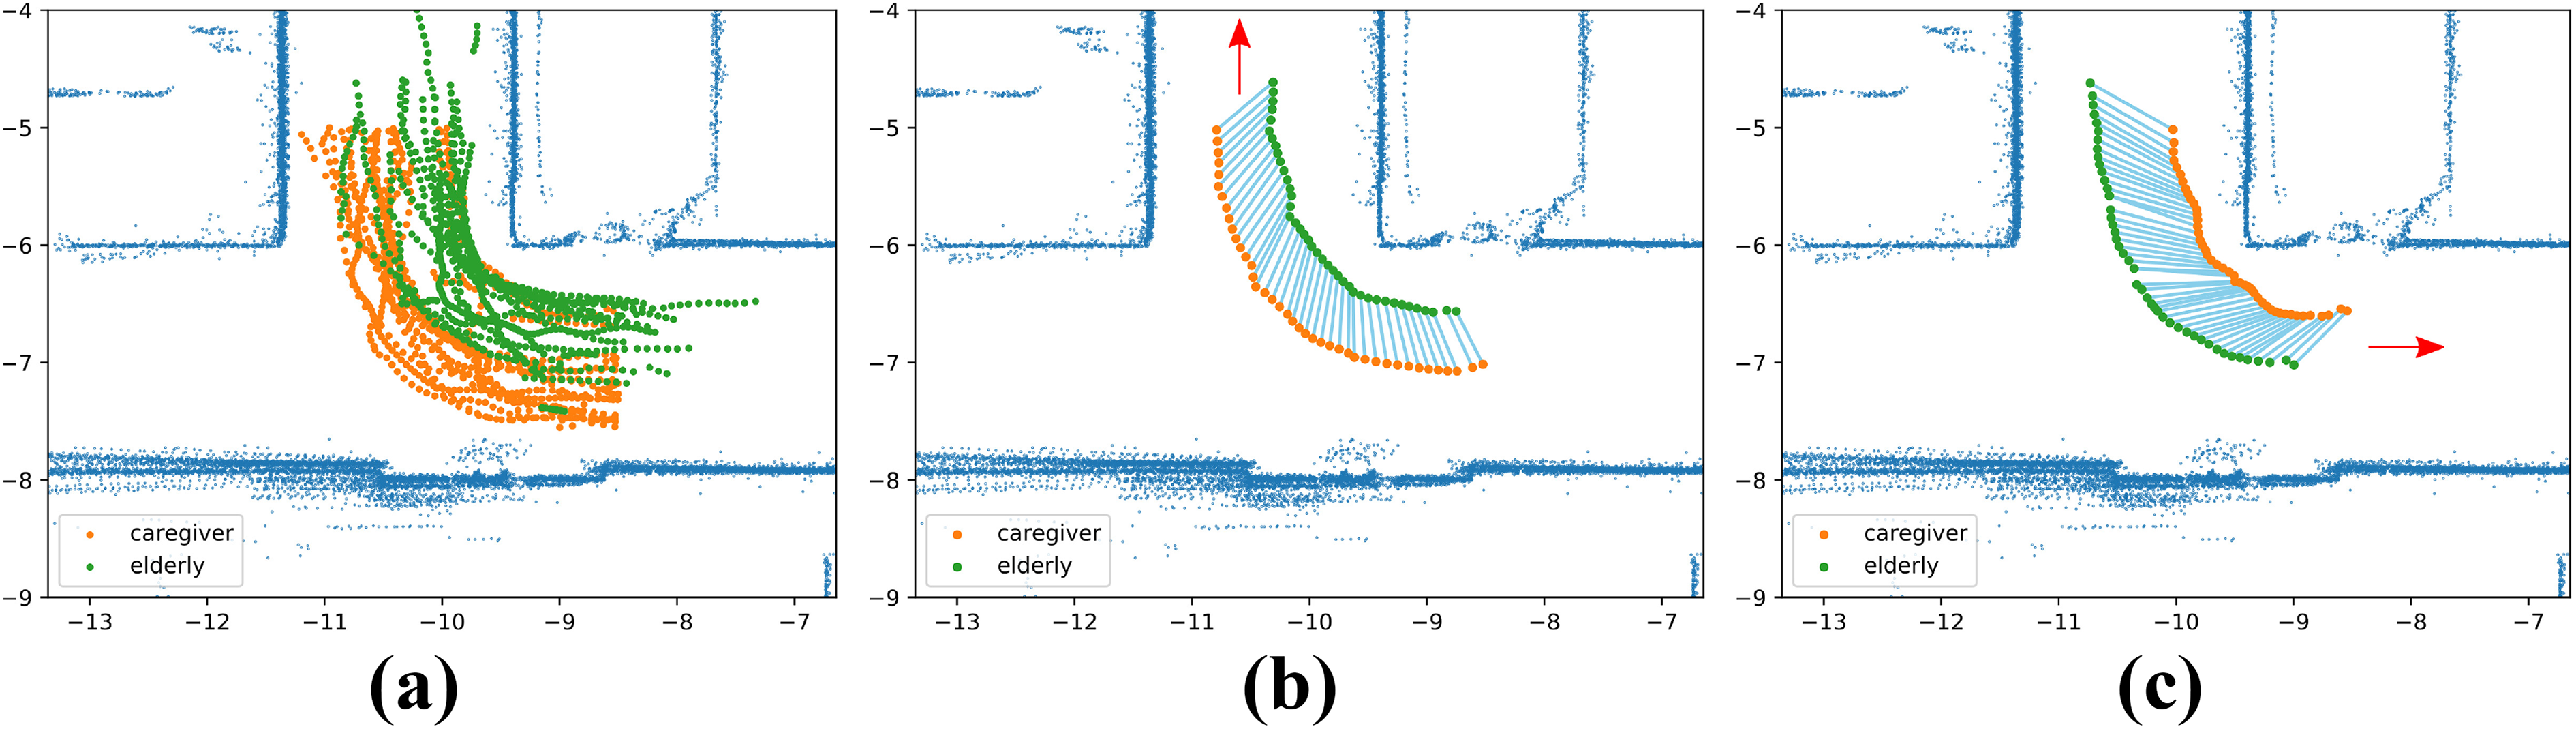
The trajectories of the caregivers (in orange) and the elderly persons (in green) at a corner. The light blue lines indicate that the connected points are measured at the same time. In most of the cases, the caregivers walked on the outer side of the corner (15 of 17). In a few cases, the caregivers walked on the inner side. In such cases, they preceded the elderly persons to ensure outlook of the corridor (2 of 17). (a) All the trajectories of the caregivers and the elderly person. (b) An example of the cases where the caregiver walks on the outer side of the corner. (c) The case where the caregiver walks on the inner side of the corner.
Figure 19(a) shows the recorded trajectories in the outdoor environment. In this sequence, the elderly was fine to walk, and the caregiver did let him walk relatively freely while navigating him to return back to the hospital. Figure 19(b) shows the caregiver’s walking speed and the elevation of her position in the global map. When the caregiver (and the elderly) was going up a slope, they got slow down to 1.0–1.2 m/s, while they walked at 1.2–1.4 m/s in down slopes. Slopes influence not only their walking speed but also their position relationship. We extracted their behavior in up slopes and down slopes, respectively, and calculated the distributions of the caregiver’s relative position with respect to the elderly (see Figure 20). We can see that, in down slopes, the elderly led the caregiver while they walked side by side in up slopes due to the change of the walking speed. Although the caregiver’s “X-axis” position varies depending on the walking speed, he/she almost always stays at 0.6 m side from the elderly. This is also observed in indoor environments (see Figure 17). These results suggest that, during attendance, professional caregivers adjust their position depending on the elderly persons’ status and the surrounding environment, while keeping their side distance to the elderly persons constant. This can be applied to designing of person following robots. Most of existing person following robots just keep the distance to the target constant. However, it might be unnatural behavior for people. We can make the robot keep the side distance to the target constant, and it may contribute the naturalness of the following behavior of the robot.

The recorded attendant behavior in the outdoor environment. (a) People trajectory. (b) The caregiver’s walking speed (green) and altitude (blue).

The distribution of the relative position of the care giver with respect to the elderly person in an outdoor environment. (a) Up slopes. (b) Down slopes.
Those analysis results are difficult to obtain using existing measurement systems which use static sensors or wearable devices, such as INS and GPS, since it requires accurately measure people behavior with respect to other people and the surrounding environment. The results show that we can capture and analyze such people behavior with the proposed system.
Person following behavior rules
Based on the analysis of the real caregivers’ behavior, we propose empirical rules to design the behavior of attendant robots. It would be helpful to design a robot which attends a person while keeping him/her away from dangerous situations.
The robot attends the person while keeping the side-by-side positioning as long as it’s possible. In particular, it should keep in the position 0.6 m aside from the person. Depending on the walking speed, the relative position would deviate along the front-back direction. However, even in such a case, the robot should keep the certain distance aside from the person. At a corner, the robot should go on the outer side of the corner so that it can check the safeness of the corridor while avoiding to disturb the person. In case the robot cannot go on the outer side due to positioning and obstacles, it should go on the inner side before the person enters the corner and check whether it’s safe. It would slightly disturb the person from walking. However, the safety has a higher priority than the comfortableness. To attend a person who is fine to walk, the robot has to be able to run at about 1.4 m/s.
Note that the values in the rules, such as the distance to the person to be attended, should be adjusted depending on the robot configuration (e.g. size and shape). However, we believe that the rules would be a good initial guide to designing a comfortable attendant robot which is socially acceptable.
Conclusions and discussion
This article has described a portable people behavior measurement system using a 3-D LIDAR. The proposed system enables long-term and wide-area behavior measurement. The system first creates a 3-D map of the environment using the Graph SLAM approach in advance to measurements. Then, it estimates its pose, detects, and tracks people simultaneously. The tracking accuracy of the system is comparable to a static sensor-based people tracking system. As a field test, we demonstrated the effectiveness of the proposed system in measuring the behavior of professional caregivers’ attending elderly persons. Based on the analysis of the measured behavior, empirical rules to design the behavior of attendant robots are proposed. The measurement system and the professional caregivers’ behavior data set have been public so that they can be used for to measurement and analysis of people attendant behavior.
The current system requires a human observer who carries the backpack with the 3-D LIDAR, thus manual effort to observe people is necessary. The human observer would be replaced with a mobile robot so that a large attendant behavior data set is automatically created for improving the robot attendant behavior.
Footnotes
Acknowledgement
The authors would like to thank O. Kohashi, S. Yamamoto, and T. Gomyo for allowing us to conduct the field test in Sawarabikai Fukushimura hospital and their excellent cooperation during the test.
Declaration of conflicting interests
The author(s) declared no potential conflicts of interest with respect to the research, authorship, and/or publication of this article.
Funding
The author(s) disclosed receipt of the following financial support for the research, authorship, and/or publication of this article: This work is in part supported by JSPS Kakenhi No. 25280093 and the Leading Graduate School Program R03 of MEXT.