
Abstract
Image deblurring is a challenging problem in image processing, which aims to reconstruct an original high-quality image from its blurred measurement caused by various factors, for example, imperfect focusing caused by the imaging system or different depths of scene appearing commonly in our daily photos. Recently, sparse representation whose basic idea is to code an image patch as a linear combination of a few atoms chosen out from an over-complete dictionary has shown uplifting results in image deblurring. Based on this and another heart-stirring property called nonlocal self-similarity, some researchers have developed nonlocal sparse regularization models to unify the local sparsity and the nonlocal self-similarity into a variational framework for image deblurring. In such models, the similarity evaluation for searching similar image patches is indispensable and influential in deblurring performance. Though the traditional Euclidean distance is generally a choice as a similarity metric, its application might give rise to inferior performance since it fails to capture the intrinsic structure of image patches. Consequently, in this article, based on structural similarity index and principal component analysis, we propose the nonlocal sparse regularization-based image deblurring with novel similarity criteria called structural similarity distance and principal component analysis-subspace Euclidean distance to improve the accuracy of deblurring. The structural similarity index is commonly used for assessing perceptual image quality, and principal component analysis is pervasively used in pattern recognition and dimensionality reduction. In our comprehensive experiments, the nonlocal sparse regularization-based image deblurring with our novel similarity criteria has achieved higher peak signal-to-noise and favorable consistency with subjective vision perception compared with state-of-the-art deblurring algorithms.
Keywords
Introduction
Image deblurring has many applications from astronomical imaging and remote sensing imaging to medical imaging. It has drawn attention around the world for decades and has been regarded as a worthy research topic in image processing so far. If we can acquire the degraded image

where
Obviously, image deblurring is an ill-posed linear inverse problem
3
; in other words, with the degraded image y and the known blur matrix
To alleviate this situation, the regularization models, which try to incorporate both the observation model and the prior knowledge of the clean image as a regularization term into a variational formulation, have been widely investigated and adopted for image deblurring. The regularization models are generally formulated as the following minimization problem

where
Because the design of effective regularization terms is at the core of image deblurring, some classical regularization terms have been designed, for example, quadratic Tikhonov regularization, 6 Mumford–Shah regularization, 7 wavelet regularization, 8 or total variation (TV) regularization. 9 Even though various deblurring methods are rising and developed, the regularization models still show their extraordinary charm in image deblurring. This has motivated many outstanding investigators to start a long process of exploration to find excellent image priors as regularization terms.
In the exploration process, sparsity as one of the most significant properties of natural images has gradually come into researchers’ sight in image deblurring. As a result, sparse representation-based regularization models 10 –12 have been promoted rapidly and have achieved great success in image deblurring. These models follow an assumption that each patch of an image can be precisely represented by a few elements from a basis set called a dictionary. Instead of traditional analytically designed dictionaries 13 based on transform bases, such as discrete cosine transform, wavelet, or curvelet, the dictionaries learned from example image patches 10,14 adapt better to local image structures and achieve better deblurring performance.
Mathematically, for a given dictionary

However, in equation (3), only the local sparsity is considered; in other words, each exemplar patch is usually regarded to be independent in dictionary learning and sparse coding. Considering this problem, lately, when nonlocal self-similarity which describes the repetitiveness existed in textures and structures among nonlocal image patches is well-known, a series of models regularized by nonlocal self-similarity 16 –18 are emerging.
More recently, the so-called nonlocal sparse regularization models 19 –22 which combine the local sparsity and the nonlocal self-similarity into a unified framework are becoming more and more popular in image deblurring. Among these models, a nonlocally centralized sparse representation (NCSR) model 20 proposed by Dong et al. is superior to others. In this article, our nonlocal sparse regularization-based image deblurring via novel similarity criteria is realized under the NCSR framework.
In the NCSR model, first, many overlapped image patches with similar structures are included in the same cluster using a k-means clustering algorithm. 23,24 Then, Zhang et al. exploit the principal component analysis (PCA) technique 25 and view each cluster as the basic unit to learn a series of compact subdictionaries. Next, during the sparse coding phase, the best subdictionary that is most fitted to code a given patch is selected to obtain the sparse coding coefficients. Last, the sparse coding noise (SCN), defined as the deviation between sparse coding coefficients of the blurred image and a good estimation of sparse coding coefficients of the clean image based on a nonlocal means (NLM) method, 26 is suppressed to improve the performance of image deblurring.
Analyzing the entire process in the NCSR modeling, we can discover that the similarity evaluation for searching similar image patches is involved not only in k-means clustering for dictionary learning and subdictionary selection for each patch but also in estimation of the sparse coding coefficients by the principle of NLM. On this account, the accuracy of evaluating the similarity of image patch pairs is a vital factor for satisfactory deblurring quality. The Euclidean distance as a similarity metric is a usual choice; however, the Euclidean distance is too simple to evaluate the similarity among image patches precisely without capturing the intrinsic structure of patches, which has limited the performance of deblurring. To suppress this problem, in this article, we propose to adopt structural similarity (SSIM) 27 index and the Euclidean distance in a lower dimensional space made by PCA as new similarity criteria. Extensive experiments are conducted on image deblurring, which demonstrate that our nonlocal sparse regularization-based image deblurring via novel similarity criteria under the NCSR framework can outperform significantly the original NCSR model and other state-of-the-art methods both in visual effect and quantitative evaluation via peak signal-to-noise (PSNR), SSIM, and feature similarity (FSIM). 28
With the rapid rise of big data and deep learning in last few years, more and more scholars attempt to utilize deep learning in image deblurring and many worthy works 29 –32 have been done. Though this kind of deblurring methods can deblur images to a certain degree, they are more likely to ignore high frequency information in images and the fine image structures.
Therefore, the following sections are presented to put forward our solutions. “Ideas on our novel similarity criteria” section develops the ideas in our proposed SSIM distance and PCA-subspace Euclidean distance. “Image deblurring via our proposed novel similarity criteria under the NCSR framework” section introduces image deblurring via our proposed novel similarity criteria under the NCSR framework in detail. “Experimental results” section presents extensive experimental results and “Conclusion and future work” section summarizes this article.
Ideas on our novel similarity criteria
For an image
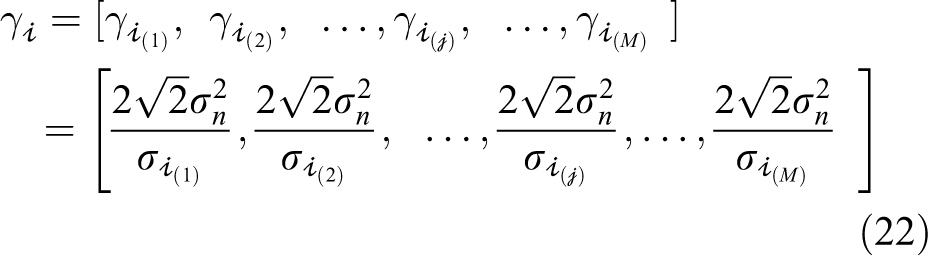
Generally, the Euclidean distance is chosen as a similarity criterion. Given two image patches

Hence, using the Euclidean distance, the computational complexity of evaluating the similarity for any two patches of
Furthermore, the Euclidean distance is so simple that it fails to capture the intrinsic structure of image patches. For this drawback, we replace the Euclidean distance with SSIM distance to make full use of image structure information.
SSIM index as a similarity criterion
The idea of SSIM index can be traced back by Wang et al. 27 In that article, the author pointed out that natural image signals are highly structured, that is, their pixels exhibit strong dependencies, especially when they are spatially proximate, and these dependencies carry important information about the structure of the objects in the visual scene. And then SSIM is developed as a well-known quality metric used to measure the similarity between two images.
Given a reference image

where
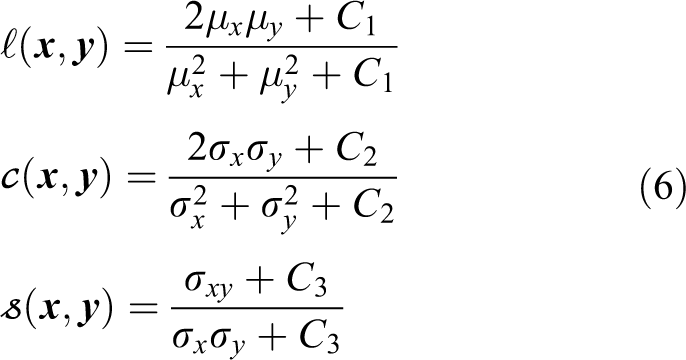
The first formula in equation (6) is a function ℓ(
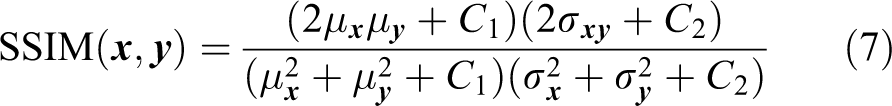
The value of SSIM ranges from 0 to 1, and the closer that the value is to 1, the higher the similarity between
To reveal SSIMs merit that it can assess perceptual image quality better by making full use of structural information of images than the Euclidean distance, a motivating example is given by Wang et al., 27 where the original “Boat” image is altered with different distortions which can be seen to have drastically different perceptual quality. Surprisingly, the distorted images yield nearly identical mean square error (MSE) relative to the original image. According to the same MSE value, the distorted images with drastically different perceptual quality tend to be considered with the same quality level. This unreasonable phenomenon further illustrates the defect of using the Euclidean distance to measure the similarity. By contrast, the SSIM values of the four distorted images are different from each other and can assess perceptual image quality.
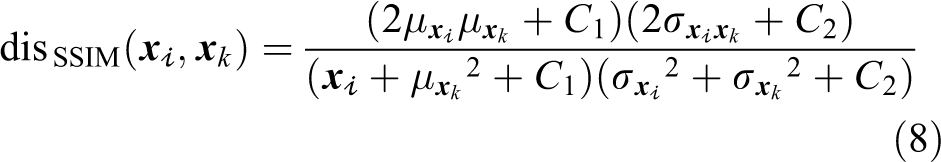
This example inspires us to extend SSIM as a similarity measure to search similar image patches in an image. Consequently, for two image patches
The comparison of the Euclidean distance-based and the SSIM distance-based criteria for searching similar image patches to a given exemplar patch is shown in Figure 1. As shown in the left subfigure of Figure 1(a), the first 18 similar patches (small blue squares) searched by the Euclidean distance-based criterion are mainly distributed in the lower left of the exemplar patch (small red square). However, the first 18 similar patches (small yellow squares) searched by the SSIM distance-based criterion are more likely to be distributed in the upper right of the exemplar patch (small red square), as shown in the right subfigure of Figure 1(a). Figure 1(b) represents the first five similar patches extracted from the 18 similar patches showed in the left and right subfigures of Figure 1(a), respectively. We can observe that based on the Euclidean distance metric, a good few configurations of the patch intensity on the corresponding positions of each patch are mismatched. In contrast, with the SSIM distance metric, most of the configurations of the patch intensities on the corresponding positions are the same or similar. Therefore, the patch searching method based on the SSIM distance can differentiate the patches more precisely than the one based on the Euclidean distance.
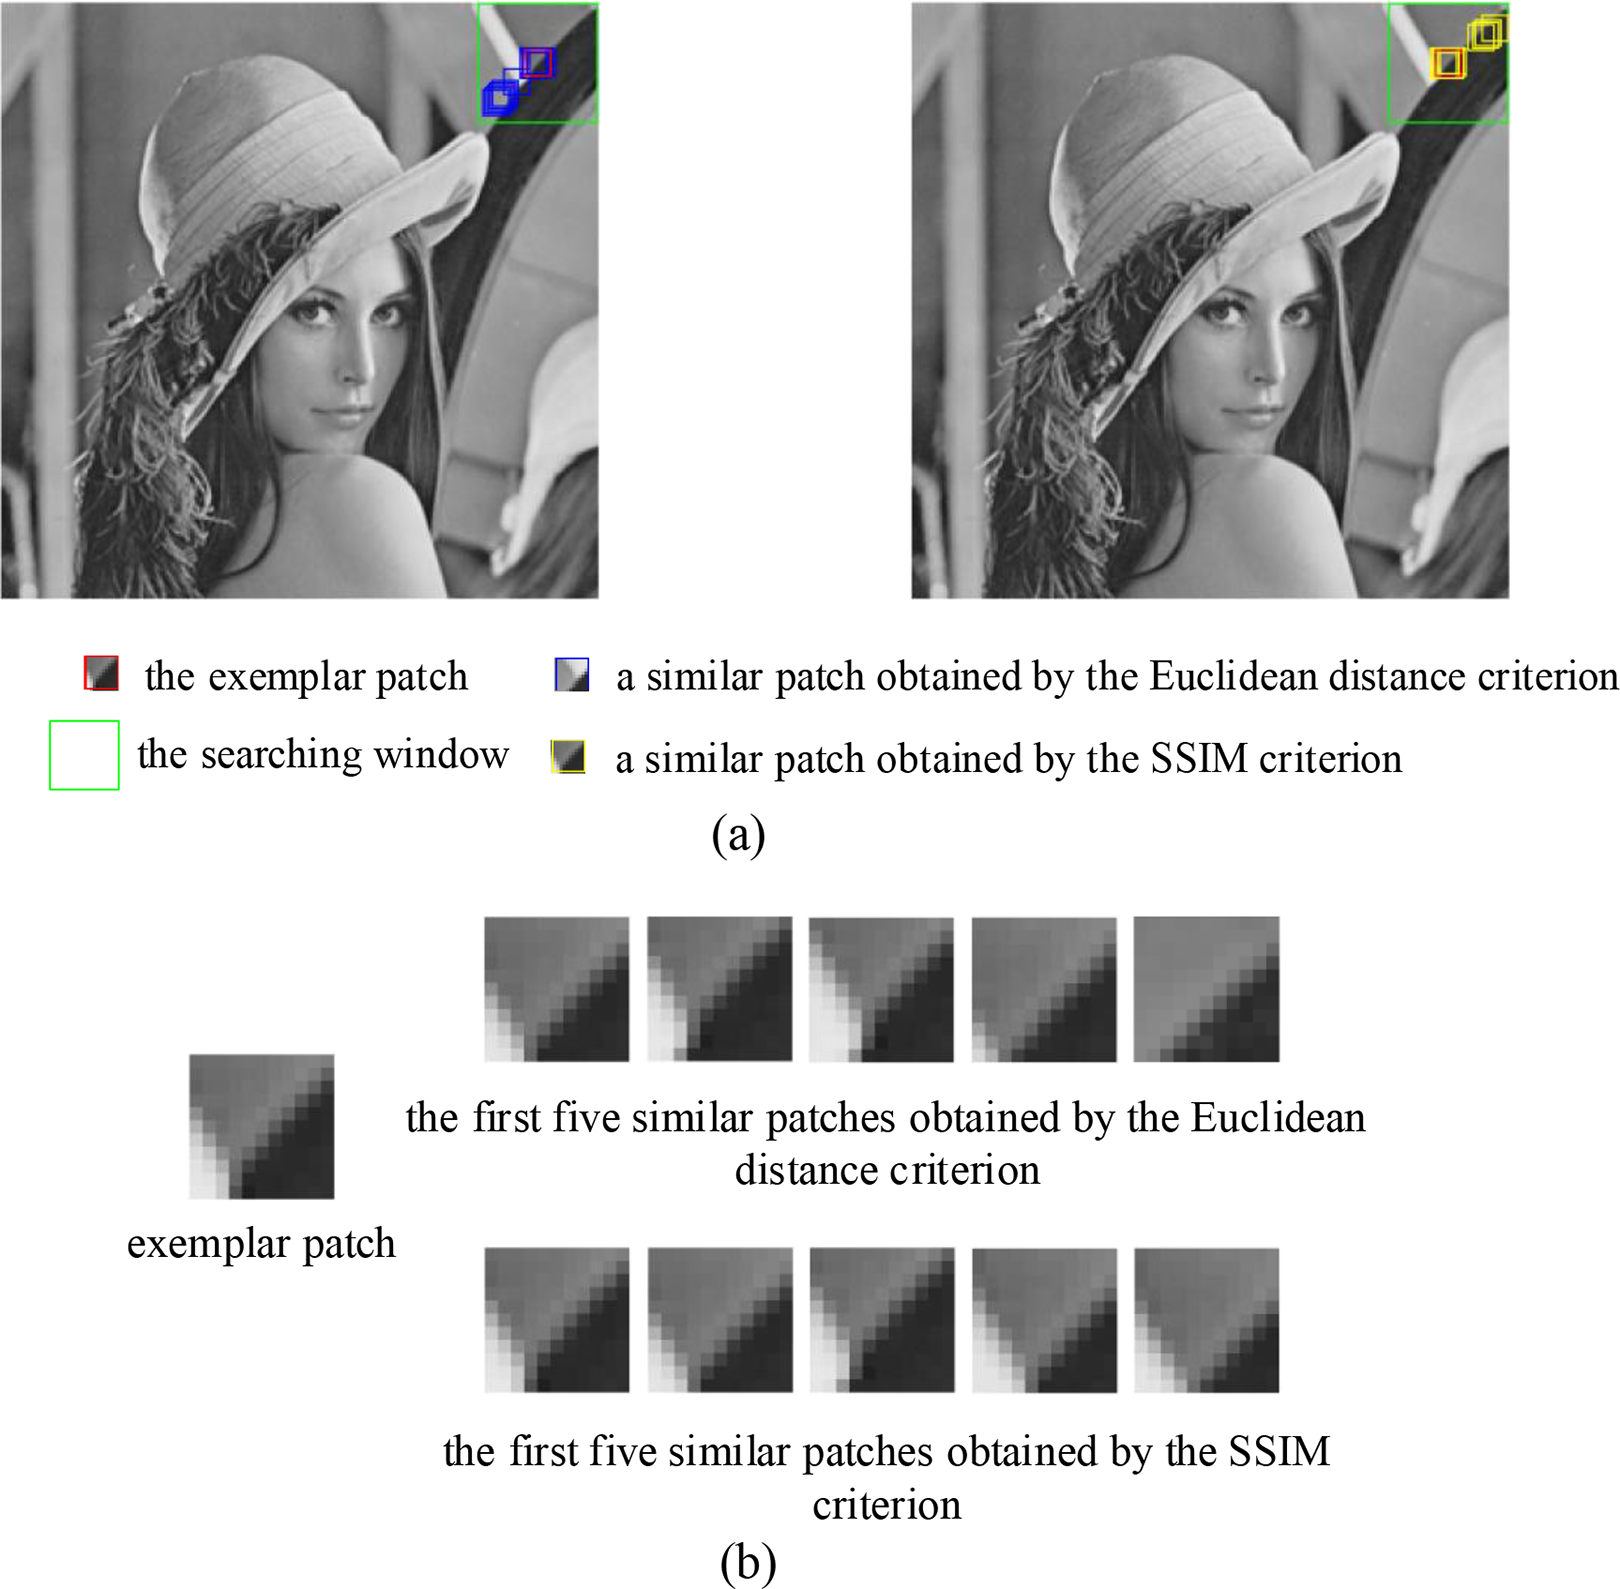
Comparison of searching similar image patches with the Euclidean distance-based and the SSIM distance-based criteria for the same exemplar patch. (a) Left: The first 18 similar patches searched in a search window by the Euclidean distance criteria. Right: The first 18 similar patches searched in a search window by the SSIM distance criteria. (b) Top: the first five similar patches extracted from the patches (in the searching window of the left image of (a)). Bottom: the first five similar patches extracted from the patches (in the searching window of the right image of (a)). SSIM: structural similarity.
PCA-subspace Euclidean distance
What inspires us to propose this criterion is the assumption that image patch vectors focus on a lower dimensional manifold rather than the full space. This assumption stems from the researches done by Huang and Mumford 33 and Lee et al. 34 who found the distribution of data is extremely “sparse” with the majority of data points concentrated on clusters and nonlinear low-dimensional manifolds.
Meanwhile, PCA has been widely used in numerous image processing applications. When applied in image denoising, 35 PCA is computed as a proper local basis set for acquiring the noisy signal projection on it, and denoising is achieved by safely setting the small high-frequency coefficients to zero. This further encourages us to think whether PCA can be used to dramatically reduce the dimensionality of image patch vectors before evaluating their similarity. Based on the above consideration, some works 36,37 have been done.
With all the above worthy work done by predecessor, we propose to replace the Euclidean distance as a similarity metric defined in equation (4) with a PCA-subspace Euclidean distance computed from projections of
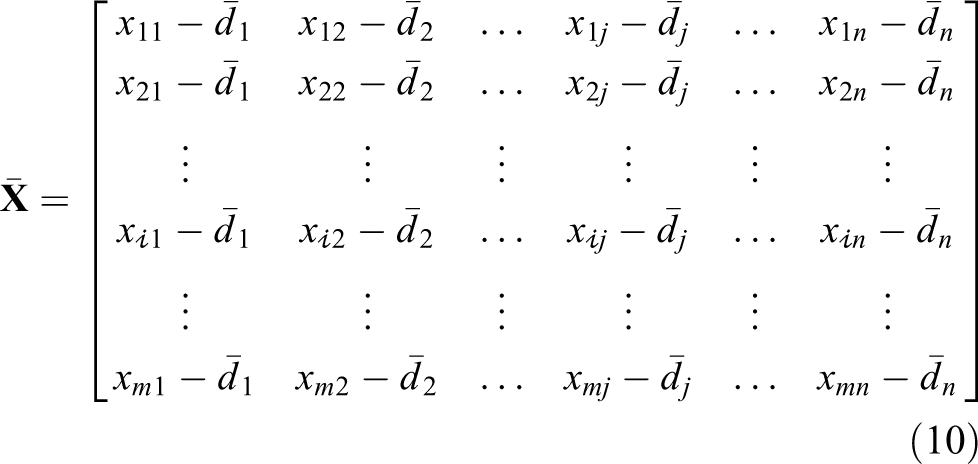
Let a matrix

where each row of
First, we calculate the mean value of dimensions one by one and get a vector
Next, we can estimate its covariance matrix

Last, we compute the singular value decomposition
38
of
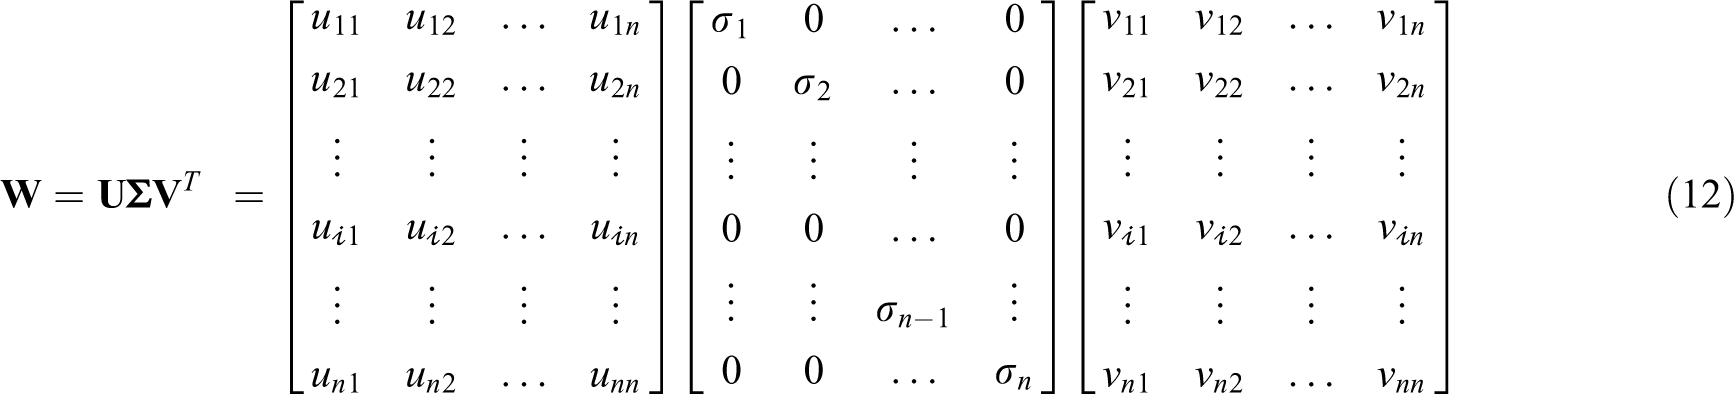
where the matrix
We can find a proper threshold δ to set the singular values

Now, given two image patches

Figure 3 shows the top six eigenvectors of
The original images used in Figure 3.

The top six eigenvectors for 6 × 6 image patches.
Image deblurring via our proposed novel similarity criteria under the NCSR framework
The deblurring model under the NCSR framework
For an image

Then, the entire image

where
In the process of image deblurring, however, what we have is just the degraded observation

Then the image
It’s obvious that if we want to obtain a higher quality image reconstruction, we must make the sparse coding coefficients

Some experiments performed by Dong et al.
20
show that the SCN
Now, another problem is that

In addition, in this article, considering that the contents can vary significantly across different images or different patches in a single image, we adopt an adaptive subdictionary selection strategy that learn a series of PCA subdictionaries from pre-collected k clusters of image patches and then, for a given patch to be processed, select one subdictionary adaptively to characterize the local sparse domain. Consequently, the sparsity of

Let’s define

Compared equation (20) with equation (21), we have
The deblurring model solving via our novel similarity criteria
The deblurring model can be solved in an iterative way, and the main procedures can be generalized in algorithm 1, which is corresponding to Figure 4.
An improved nonlocal sparse regularization-based image deblurring


The flowchart of nonlocal sparse regularization-based image deblurring via novel similarity criteria.
Experimental results
In this section, extensive experimental results are showed in detail to verify the performance of nonlocal sparse regularization-based image deblurring via novel similarity criteria. The parameter setting is as follows: the image patch size is
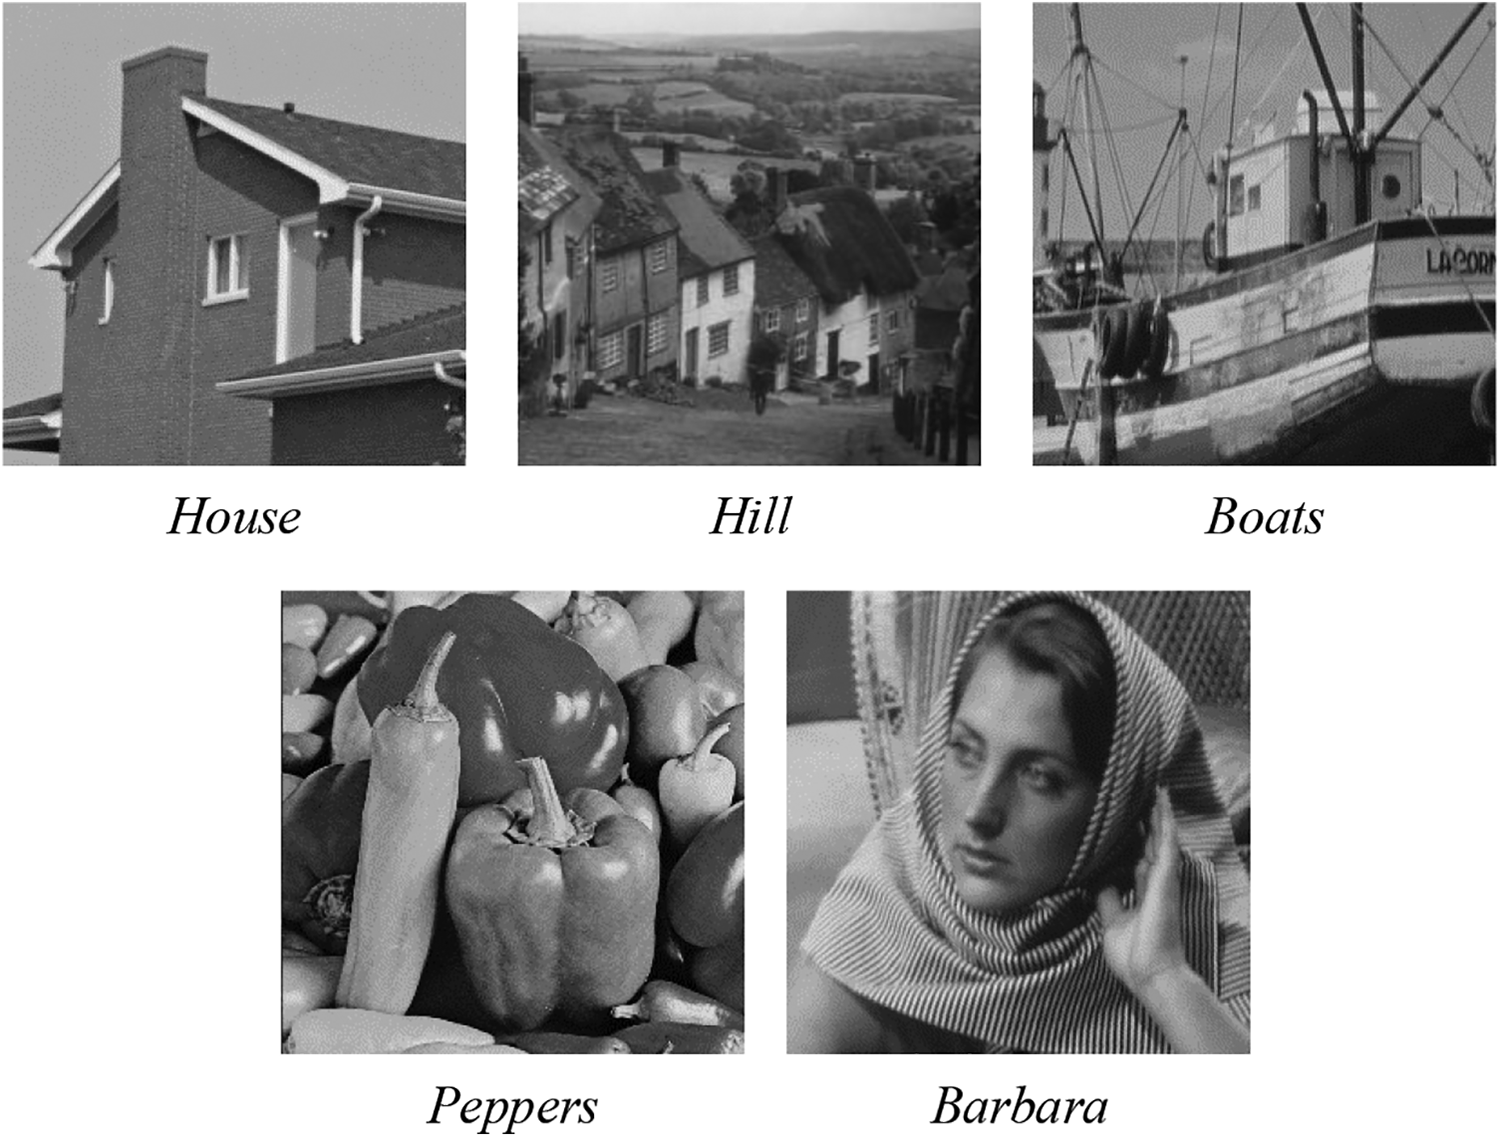
To evaluate the quality of deblurred images, in addition to the PSNR generally used to evaluate the objective image quality, two more powerful perceptual quality metrics SSIM and FSIM are adopted to evaluate the visual quality. For color images, image deblurring operations are only applied to the luminance component. All the experimental test images are listed in Figure 5.They are selected from an image database (available at http://decsai.ugr.es/cvg/dbimagenes/index.php). Due to the limit of space, only parts of the experimental results are shown in this article. Our MATLAB code can be downloaded at the website: https://github.com/wangnannanying/INSR_Deblur-SR.

All experimental test images (256 × 256).
Deblurring experiments for the simulated blurred images
In this subsection, we conduct two sets of experiments to demonstrate the performance of our proposed method for image deblurring. In the first set, two commonly used blur kernels, that is, a 9 × 9 uniform kernel and a two-dimensional Gaussian blur kernel with standard deviation of 1.6 are exploited for simulating. Then, the blurred images are further corrupted by additive Gaussian noise with standard deviation of
Various blur PSFs and noise variances used in six typical non-blind deblurring experiments in the second set.

PSF: point spread function.
We compare our deblurring method with four state-of-the-art deblurring methods, including fast iterative shrinkage/thresholding algorithm (FISTA), 41 iterative decoupled deblurring block-matching and 3D filtering algorithm (IDD-BM3D), 40 NCSR, 20 and group-based sparse representation (GSR). 21 FISTA introduced new gradient-based schemes for the constrained TV-based image deblurring. IDD-BM3D is an improved version of BM3D. 42 NCSR proposed a centralized sparse constraint, which exploits the image nonlocal redundancy to reduce the SCN. 20 GSR sparsely represented natural images in the domain of group and characterized the intrinsic local sparsity and nonlocal self-similarity of natural images simultaneously in a unified manner.
The subjective image visual comparisons of our proposed method and other four deblurring methods on images “House” and “Starfish” are shown in Figures 6 and 7, from which several conclusions can be drawn: (1) FISTA fails to suppress the noise and there exists noticeable ringing effects surround strong edges (see the House contour in Figure 6(b) and the latticed texture in Starfish’s surface in Figure 7(b)). The deblurring performance is unsatisfactory. (2) IDD-BM3D, NCSR, and GSR achieve deblurred images with similar quality (all noticeably better than FISTA), of which NCSR works quite well in clearly restoring large edges without any noticeable ringing artifacts and exhibits powerful ability in removing noise in smooth and low-activity regions. However, the price is paid in loss of some image details, leading to blurs in texture regions. Moreover, there still remains some noticeable noise around edges (see the contour of eaves in Figure 6(d) and the contour of latticed texture in Figure 7(d)). (3) As expected, our proposed method generates near-perfect deblurring results that most of the image edges and textures are restored very well, while the noise existing in image has been effectively suppressed. Compared to NCSR, our method recovers much cleaner and sharper image edges and textures (see Figures 6(f) and 7(f)). Such experimental findings clearly suggest that our proposed model is a stronger prior for the class of photographic images containing strong edges/textures.
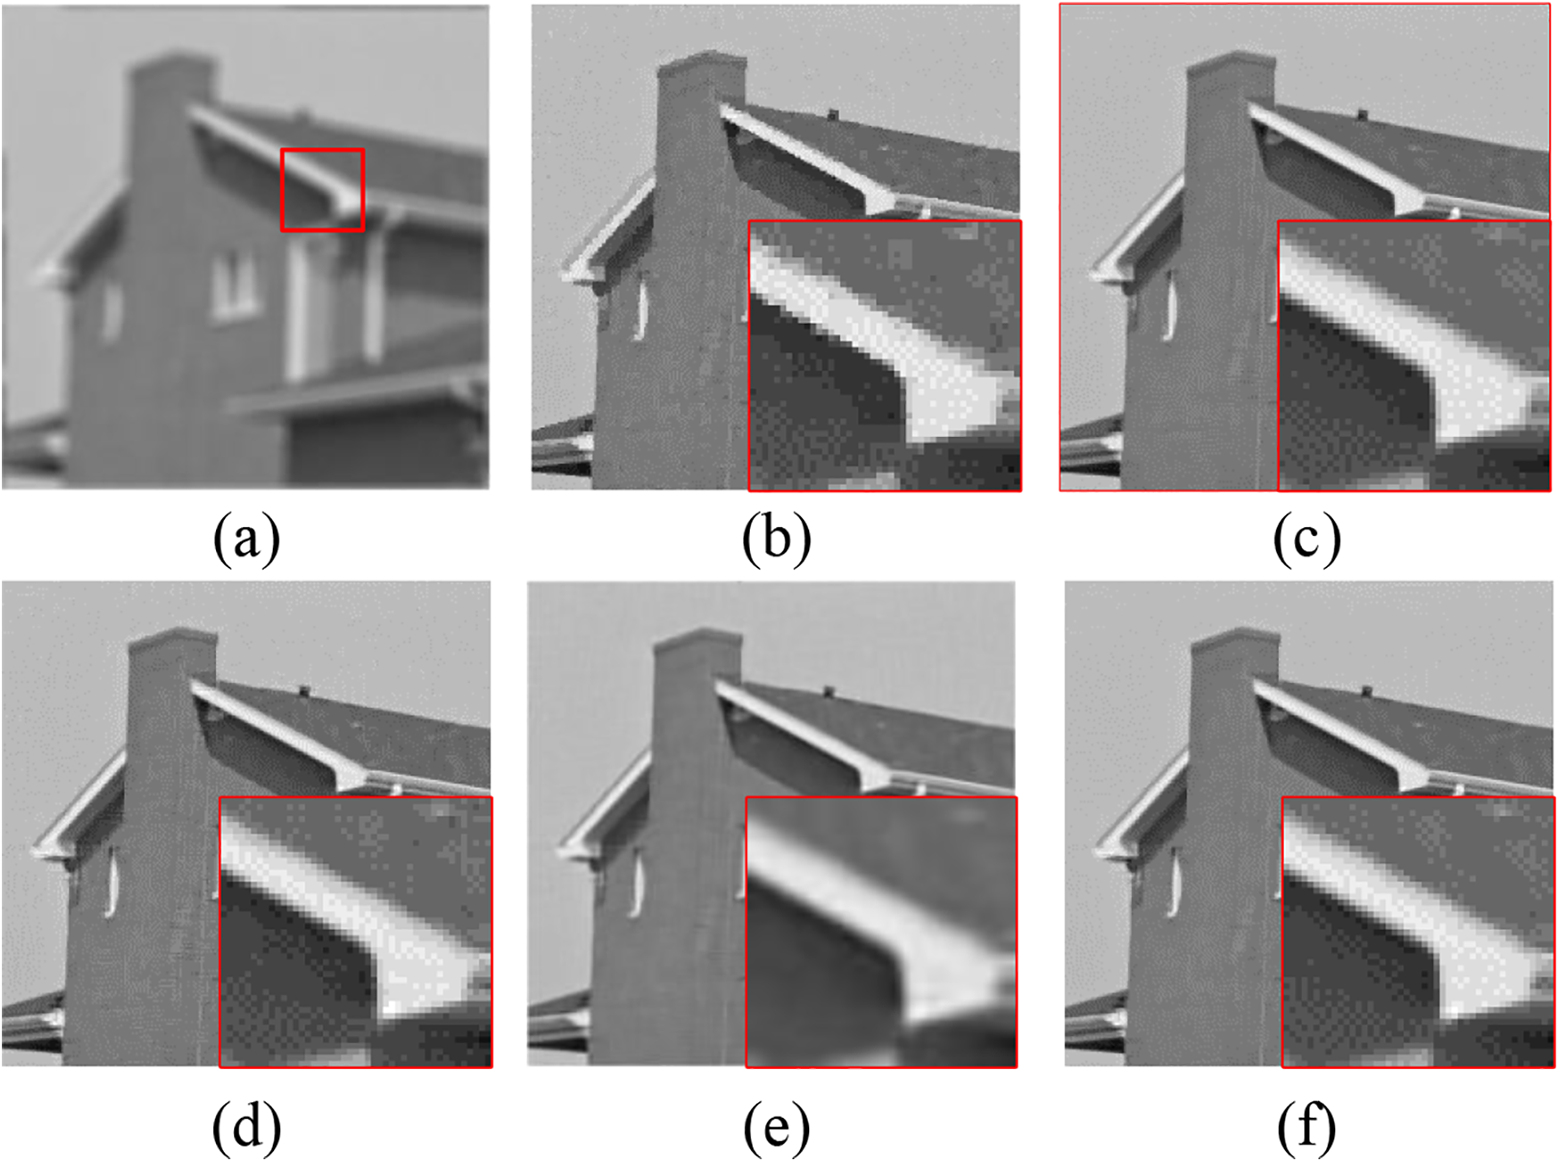
Visual quality comparison of image deblurring on the gray image House (256 × 256). (a) The noisy and blurred image (9 × 9 uniform blur,

Visual quality comparison of image deblurring on the color image Starfish (256 × 256). (a) The noisy and blurred image (Gaussian blur,
The PSNR, SSIM, and FSIM comparison results on 10 test images (see Figure 5) in the first set of experiments among five competing methods are reported in Table 2 for the uniform blur and Table 3 for the Gaussian blur, respectively. From Tables 2 and 3, it can be observed that our method (Ours) clearly outperforms all other four for most of 10 test images. The gains are mostly impressive for “Butterfly” and “Leaves” images which contain abundant strong edges or textures. One possible explanation is that our method is capable of striking a better trade-off between exploiting local and nonlocal dependencies within those images. The proposed method achieves superior performance to other competing methods, and our method outperforms FISTA by 2.56 and 2.13 dB for the uniform blur and Gaussian blur, respectively. It’s obvious that IDDBM3D, NCSR, and GSR produce very similar results and the performance measured by PSNR, SSIM, and FSIM is improved significantly, compared with FISTA. What is exciting is that our model outperforms all these competitive methods, and our model outperforms IDDBM3D, NCSR, and GSR by (0.71 dB, 0.43 dB), (0.41 dB, 0.26 dB), and (0.51 dB, 0.47 dB) for uniform blur and Gaussian blur, respectively, which is consistent with the subjective visual comparisons shown in Figures 6 and 7.
PSNR (dB), SSIM, and FSIM comparisons by different deblurring methods for the uniform blur in the first set.

The bold values mean the largest ones. FISTA: fast iterative shrinkage/thresholding algorithm; PSNR: peak signal-to-noise; SSIM: structural similarity; FSIM: feature similarity; IDD-BM3D: iterative decoupled deblurring block-matching and 3D; NCSR: nonlocally centralized sparse representation; GSR: group-based sparse representation.
PSNR (dB), SSIM, and FSIM comparisons by different deblurring methods for the Gaussian blur in the first set.

The bold values mean the largest ones. FISTA: fast iterative shrinkage/thresholding algorithm; PSNR: peak signal-to-noise; SSIM: structural similarity; FSIM: feature similarity; IDD-BM3D: iterative decoupled deblurring block-matching and 3D; NCSR: nonlocally centralized sparse representation; GSR: group-based sparse representation.
In Table 4, we present the comparison of improvement of signal-to-noise ratio (ISNR) values achieved by each deblurring method for four test images. The ISNR of the image is another common measurement in image restoration and is defined as

Comparison of the ISNR (dB) results of the deblurring methods in the second set.

The bold values mean the largest ones. ISNR: improvement of signal-to-noise ratio; PSNR: peak signal-to-noise; IDD-BM3D: iterative decoupled deblurring block-matching and 3D; NCSR: nonlocally centralized sparse representation; GSR: group-based sparse representation.
From Table 4, it is clear to observe that our method achieves the highest ISNR results in all the six scenarios when deblurring the blurred images “Cameraman” and “Lena” and obtains the highest ISNR values in the four scenarios when deblurring the blurred image House. However, the inferior ISNR results appear when deblurring the blurred image “Barbara,” which we guess is because our method has a possibly high sensitivity to the type of PSF for images with rich textures, which is needed to be ameliorated in our future works.
Ablation studies of SSIM distance and PCA-subspace Euclidean distance
In this article, our method adopts both SSIM distance and PCA-subspace Euclidean distance to attain better performance of deblurring. In order to study further the effects of these two similarity criteria on the deblurring results separately, two experiments, of which one is deblurring only with SSIM distance (called Ours-SSIM) and another is deblurring only with PCA-subspace Euclidean distance (called Ours-PCA), were conducted and compared to our method (see Table 5). As described in “Image deblurring via our proposed novel similarity criteria under the NCSR framework” section, in this article, we merely conduct image deblurring via our proposed similarity criteria under the superior NCSR framework. To highlight the superior performance of our method, we also list the result of NCSR in Table 5. Besides, we simply show the PSNR values for a concise comparison in Table 5. From Table 5, we can conclude that whether using only SSIM distance (Ours-SSIM) or using only PCA-subspace Euclidean distance (Ours-PCA), better performance than NCSR can be achieved, while even better results can be achieved by using both similarity criteria (Ours). This indicates that SSIM distance or PCA-subspace Euclidean distance we have proposed in this article is solely for improving the deblurring performance. In addition, the result using both similarity criteria (Ours) acquired the superior performance shows that the two similarity criteria can promote each other.
Comparison of the PSNR (dB) results of the deblurring methods with different similarity criteria.

The bold values mean the largest ones. PSNR: peak signal-to-noise; NCSR: nonlocally centralized sparse representation; SSIM: structural similarity; PCA: principal component analysis.
Algorithm stability
Here, we provide empirical evidence to illustrate the stability of the proposed method. Take the cases of image deblurring for two blur types in the first sets of experiments as examples. Figure 8(a) and (b) plots the evolutions of PSNR versus outer loop iteration numbers for five test images in the cases of image deblurring for uniform blur and Gaussian blur, respectively.

(a) The changing PSNR (dB) values of five test images as functions of iteration numbers for the uniform blur in the first set. (b) The changing PSNR (dB) values of five test images as functions of iteration numbers for the Gaussian blur in the first set. PSNR: peak signal-to-noise.
It is observed that with the growth of outer loop iteration numbers, all the PSNR curves of five test images increase monotonically when the outer loop iteration numbers increase from one to six and ultimately become flat and stable when the outer loop iteration numbers are greater than six for both the uniform blur and the Gaussian blur, exhibiting good stability of the proposed method. Based on the above results, the outer loop iteration numbers are set to be six in our experiments described in “Experimental results” section.
Effect of number of clusters and number of best matched patches
This subsection will give some discussion about the deblur performance affected by K and Q which are the number of clusters and the number of best matched patches, respectively.
To investigate the sensitivity of K and Q, experiments with reference to various K and Q in the case of image deblurring for three test images “Barbara,” “House,” “Parrot” are conducted. The performance comparisons with various K and Q in the case of image deblurring with 9 × 9 uniform blur kernels are shown in Figure 9. From Figure 9, it is concluded that the performance of our proposed model is not quite sensitive to K and Q because all the curves are almost flat. The highest performance for each image is usually achieved with K and Q in the range (60, 70) and (10, 20), respectively. Therefore, in this article, K and Q are empirically set to be 64 and 13, respectively.

(a) Performance comparison with various K for three test images. (b) Performance comparison with various Q for three test images.
Extensional experiments
In the previous section of this article, we conduct merely image deblurring via our proposed novel similarity criteria under the superior NCSR framework. To demonstrate the universality and extensibility of our novel similarity criteria, we apply our novel similarity criteria in image super-resolution 43 under the same NCSR framework and image deblurring under another GSR framework, 21 respectively.
The corresponding results are shown in Tables 6 and 7, respectively, which forcefully prove that our similarity criteria have advantageous influence on both NCSR super-resolution and GSR deblurring.
The PSNR (dB) results of image super-resolution via our novel similarity criteria under the same NCSR framework.
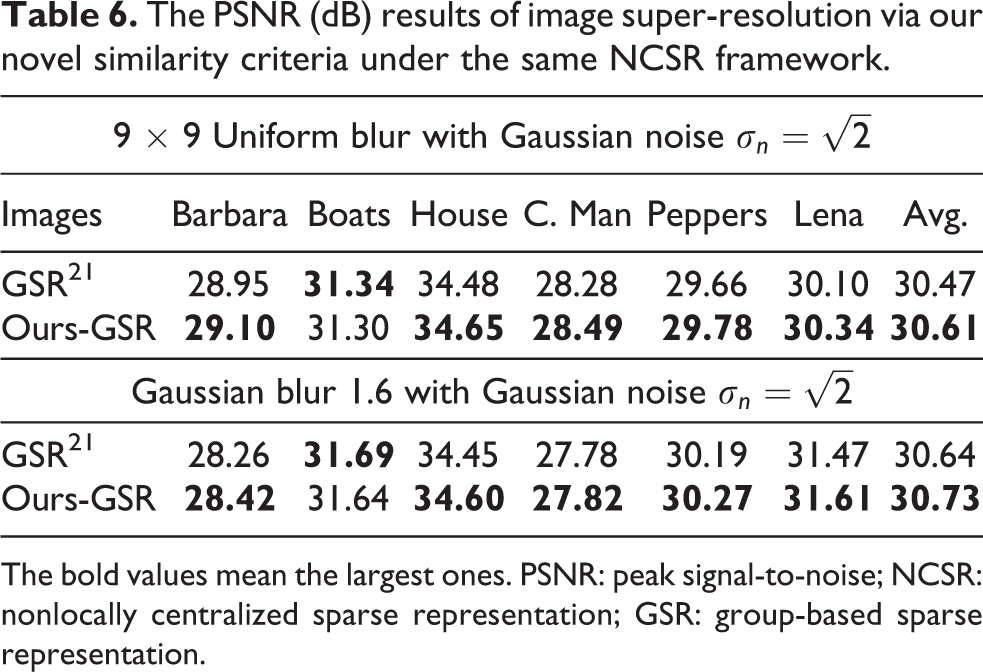
The bold values mean the largest ones. PSNR: peak signal-to-noise; NCSR: nonlocally centralized sparse representation; GSR: group-based sparse representation.
The PSNR (dB) results of image deblurring via our novel similarity criteria under the GSR framework.
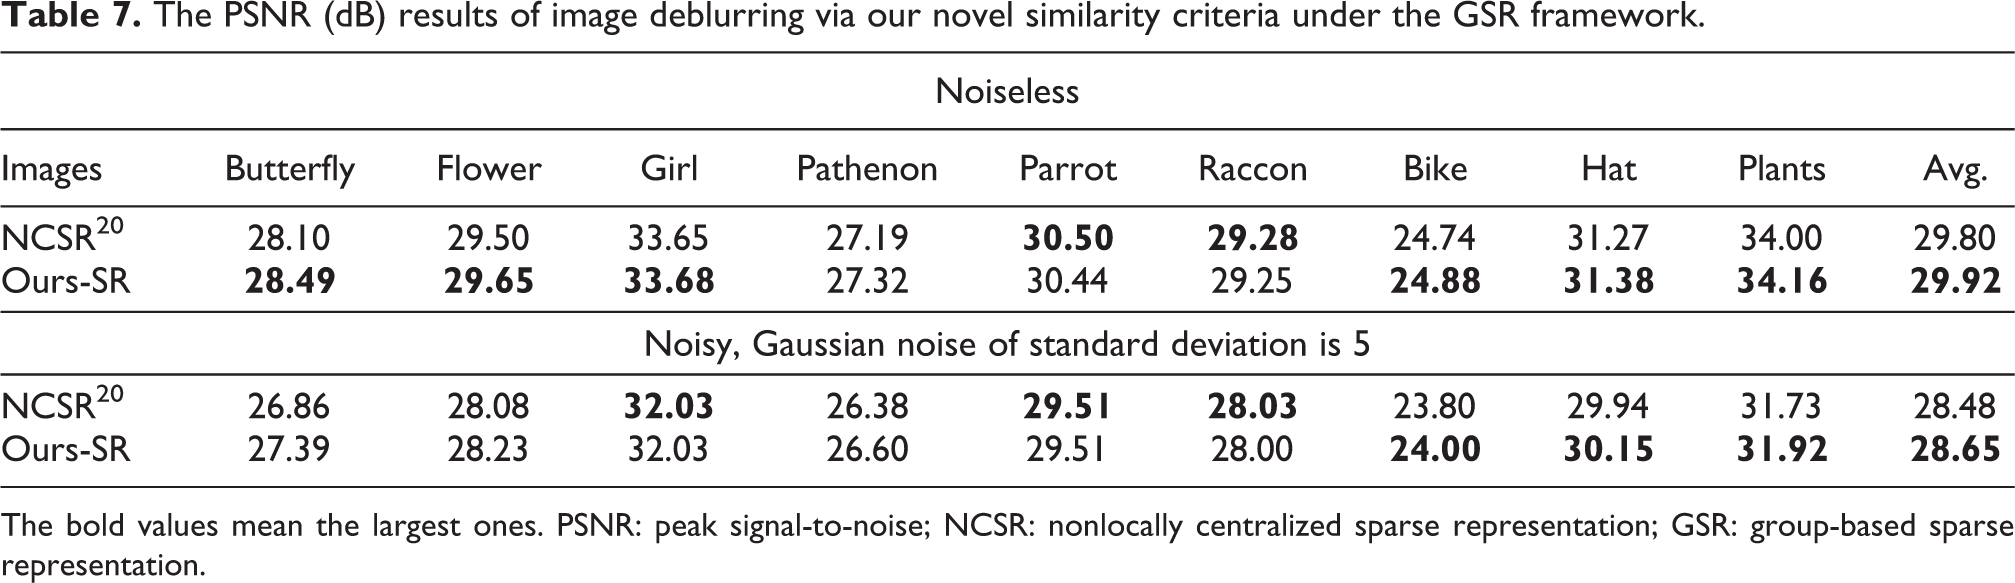
The bold values mean the largest ones. PSNR: peak signal-to-noise; NCSR: nonlocally centralized sparse representation; GSR: group-based sparse representation.
Application in real-time video deblurring
Though deblurring methods, for example, NCSR or GSR, which using nonlocal sparse regularization models, have achieved higher metrics objectively and favorable visual effects subjectively, they are all failed to be real time.
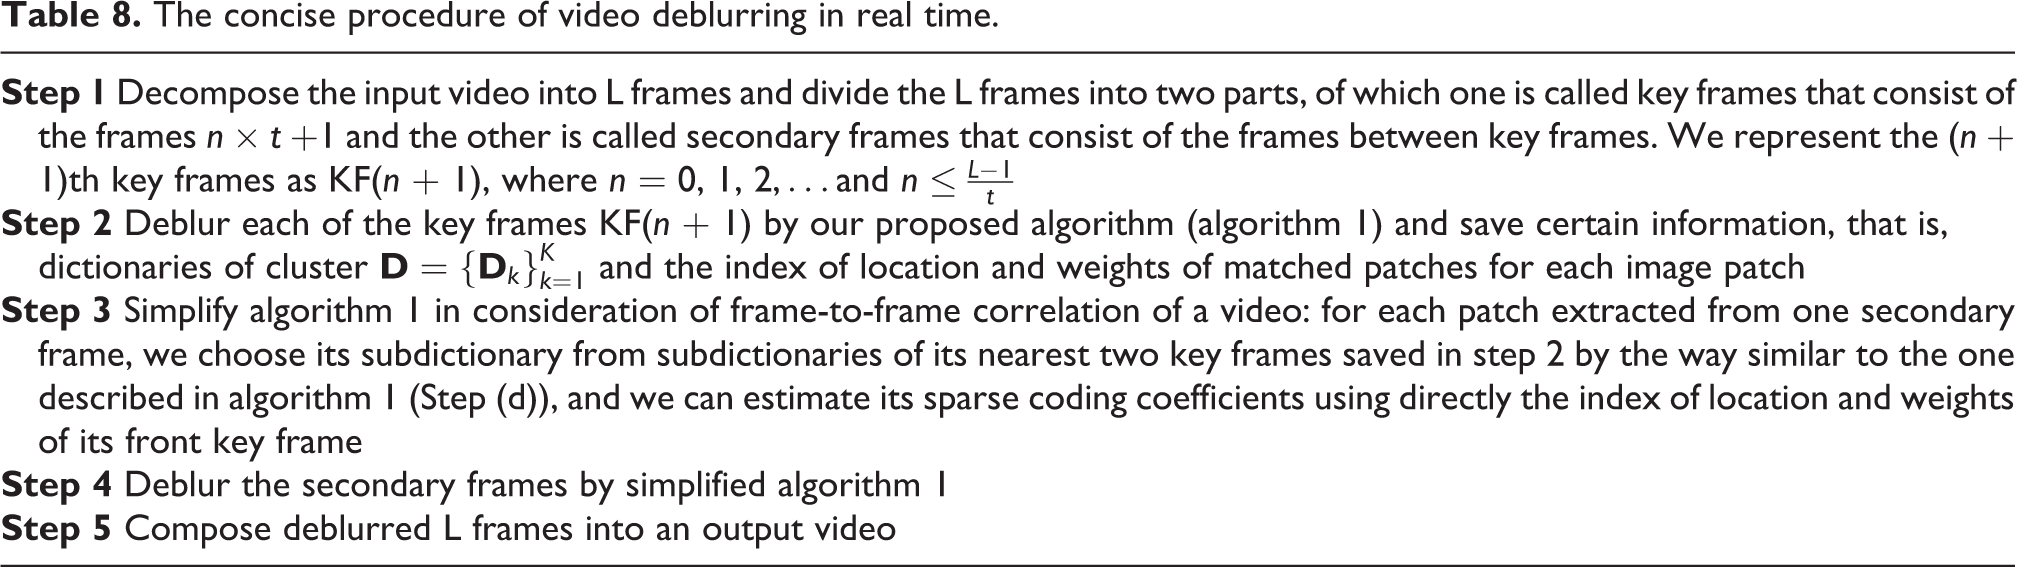
By analyzing the process of this kind of approach, we discover that the clustering and block matching processes introduced in algorithm 1 are so time-consuming that deblurring methods including the two processes can’t deblur a single image in real time. However, considering frame-to-frame correlation of a video which consists of L frames in all, we can perform clustering and block matching processes for every T frames and try to apply our single image deblurring method to video deblurring. Because this is not our main content of research in this article, we introduce this idea simply in Table 8.
The concise procedure of video deblurring in real time.
For a vivid illustration, we show the process in Figure 10. Note that if you expect a better performance of real-time video deblurring, a further research is needed because of the complicated correlation among frames.
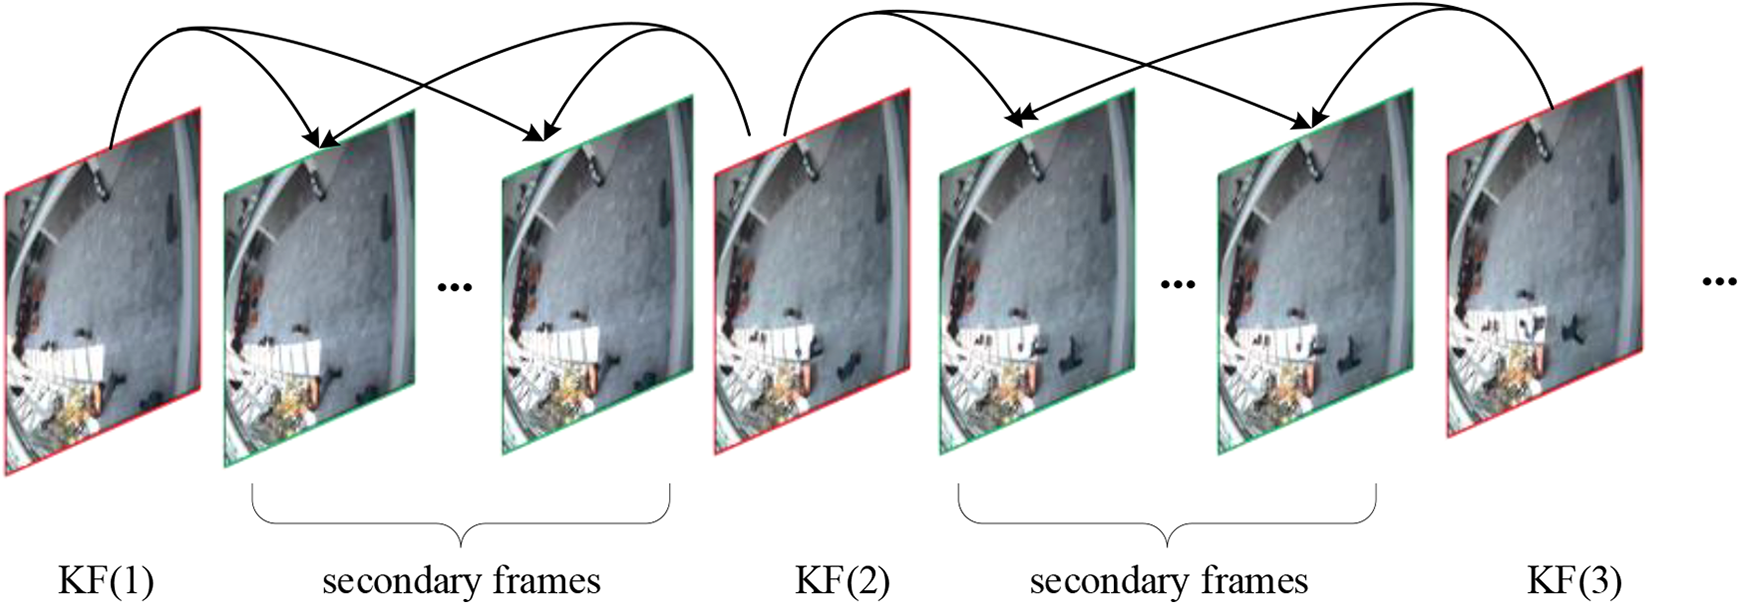
The process of video deblurring by our method.
Conclusion and future work
This article presents a nonlocal sparse regularization model with novel similarity criteria called SSIM distance and PCA-subspace Euclidean distance for deblurring. The deblurring model we proposed is realized under the NCSR framework. The results of experiment on image deblurring have shown that the proposed method achieves significant performance improvements over many current state-of-the-art schemes. Extensional experiments forcefully prove the universality and extensibility of our similarity criteria in other deblurring framework and other image processing applications such as image super-resolution.
Footnotes
Declaration of conflicting interests
The author(s) declared no potential conflicts of interest with respect to the research, authorship, and/or publication of this article.
Funding
The author(s) disclosed receipt of the following financial support for the research, authorship, and/or publication of this article: This work was supported by National Natural Science Foundation of China (no 61501334).