
Abstract
This article presents an autonomous navigation approach based on a transmission tower for unmanned aerial vehicle (UAV) power line inspection. For this complex vision task, a perspective navigation model, which plays an important role in the description and analysis of the flight strategy, is introduced. Based on the proposed navigation model, valuable cues are excavated from a perspective image, which enhances the capability of the perception of three-dimensional direction and simultaneously improves the safety of intelligent inspection. Specifically, for robust and continuous localization of the transmission tower, a developed detecting-tracking visual strategy—comprised tower detection based on a faster region-based convolutional neural network and tower tracking by kernelized correlation filters—is presented. Further, segmentation by fully convolutional networks is applied to the extraction of transmission lines, from which the vanishing point (VP), an important basis for determining the flight heading, can be obtained. For more robust navigation, the designed scheme addresses the scenario of a nonexistent VP. Finally, the proposed navigation approach and constructed UAV platform were evaluated in a practical environment and achieved satisfactory results. To the best of our knowledge, this article marks the first time that a navigation approach based on a transmission tower is proposed and implemented.
Keywords
Introduction
High-voltage transmission lines are vital to economic development; however, they lack regular maintenance. The inefficiency of existing inspection and maintenance methods leads to a considerable amount of wasted resources. With the rapidly expanded scale of overhead transmission lines, intelligent inspection has received an increasing amount of attention. In recent years, many intelligent inspection studies have been conducted on two major platforms, specifically the unmanned aerial vehicle (UAV) and crawling robot. 1 –3 Compared with crawling robots, UAVs provide greater flexibility, a broader operation range, and higher speed.
Autonomous navigation, an important component of intelligent inspection, has been relying on accurate global positioning system (GPS) or reliable recognition of transmission lines. For GPS-based autonomous navigation systems, ground stations and real-time and accurate GPS data of transmission towers and UAVs are indispensable. Lu et al. 4 achieved autonomous transmission-line inspection simply using GPS data of transmission towers and UAVs. To maintain protection of UAVs from obstacles, Hrabar et al. 5 further applied both a stereo camera and light detection and ranging to the navigation system. However, the problem of a collision between a UAV and transmission lines has not been addressed.
Despite the excellent performance of GPS, transmission-line-based navigation studies have also been conducted in many perspectives. Cao et al. 6 proposed a boundary search radon transform approach for real-time transmission-line detection. Chen et al. 7 developed the cluster radon transform, an improved radon transform, to extract lines from a satellite image. Cerón et al. 8 designed a method called circle-based search, which showed better performance on long lines of detection than some traditional methods, such as the Hough transform, 9 a linear-time line segment detector (LSD), 10 and a real-time line segment detection by edge drawing lines. 11 Meanwhile, Araar and Aouf 12 applied two different kinds of control strategies to the inspecting UAV and compared their performances. Zhou et al. 13 proposed a model that solves the problem of automatic selection of the threshold during line tracking. Zhang et al. 14 used a Kalman filter to track the power lines in the Hough space based on the continuity of a video sequence. Compared with GPS-based navigation, navigation based on transmission lines has many limitations and challenges. For example, extraction of narrow transmission lines from a complex background remains a challenge. Some artificial backgrounds cause adverse effects in recognition work. Nevertheless, in terms of existing methods, UAVs must inspect above the transmission lines, whereby overhanging lines are visually parallel, which simultaneously improves the robustness of recognition and navigation. Currently, autonomous inspection still faces severe security risks from the probability of a UAV crash. Thus, existing inspection approaches have not been applied to inspection of high-voltage transmission lines.
The transmission tower is another important visual cue in the electric corridor and has attracted considerable research attention. Steiger et al. 15 adopted the implicit shape model 16 approach for representation of transmission towers. In the detection phase, local maxima in the voting space indicate the likely locations of transmission towers. Sampedro et al. 17 employed histogram of oriented gradient 18 features and multilayer perception neural networks to distinguish transmission towers from backgrounds. By employing a sliding window algorithm, localization of towers is achieved. Moreover, Cerón et al. 19 developed a new descriptor based on a grid of two-dimensional feature descriptors, and they used the support vector machine as a classifier. Their detection required less than 50 ms, which was faster than previous methods. However, the accuracy of existing transmission-tower detection continues to have difficulty meeting the requirements of autonomous navigation. Since 2012, deep learning technology has shown impressive performance in various vision tasks. Some typical approaches, such as a faster region-based convolutional neural network (Faster-RCNN) 20 and a single shot multibox detector (SSD), 21 outperformed other traditional methods and achieved excellent detection performance. Even though deep learning achieves breakthroughs in many fields, their performance in the transmission-tower detection still deserves an expectation, and to the best of our knowledge, an autonomous navigation approach based on the transmission tower has not yet been proposed.
To achieve transmission-tower-based autonomous navigation, UAVs must be capable of directional perception. According to the projection theory, spatial parallel lines intersect at infinity, which is imaged as a vanishing point (VP). By employing the VP, the direction of a spatially straight line can be uniquely determined. VP detection is widely used in road detection 22 –24 and robotics navigation. 25 –27 It can be generally categorized in two groups: edge-based and texture-based. Taking road detection as an example, edge-based VP detection relies on high-contrast edges, which are mainly from clear road boundaries and lane marks. In contrast, texture-based methods with relative high computational complexity show superiority in unstructured off-roads environments. In addition, some road segmentation methods based on deep learning have made outstanding progress. 28 Many new approaches have been applied to the practical automatic driving system with the aforementioned methods as a reference. Nonetheless, practical VP-based navigation methods, which are suitable for UAV autonomous inspection, need to be developed.
In this article, we focus on the problem of autonomous navigation based on the transmission tower, which enables power infrastructure inspection. To improve the navigation scheme description, a navigation model that leverages the perspective relation is introduced first. The scheme is fundamentally comprised of two components: reliable transmission-tower localization and robust transmission-line extraction. To achieve reliable real-time localization of the transmission tower, a detection-tracking visual strategy is employed. It combines faster R-CNN detection and the kernelized correlation filter (KCF) tracking algorithm. For the robust extraction of transmission lines in complex backgrounds, segmentation that applies deep learning is employed, followed by a proposed annotation method. The detected transmission lines are further processed by edge-based VP detection, which consists of LSD, random sample consensus (RANSAC), 29 and linear and nonlinear optimization, to obtain a precise flight heading defined by VP. Moreover, an experiential flight heading adjusted by the proposed navigation model is also adopted when a VP does not exist, which improves the flexibility of the scheme. To verify the effectiveness of the proposed navigation scheme, we built a UAV inspection platform and obtained satisfactory results in an evaluation. Compared with existing inspection systems and navigation approaches, the proposed transmission-tower-based navigation approach has key attributes and advantages. For one, the UAV is not required to navigate above the transmission lines, which reduces the risk of an inspection accident. Moreover, the UAV has a beyond visual range flight capability and requires no GPS or ground station. Furthermore, the presented approach is effective in relatively complex backgrounds. To the best of our knowledge, the presented approach marks the first time that UAV achieves transmission-tower-based autonomous navigation.
The remainder of the article is structured as follows. The whole system design of the inspection UAV is described in “hardware platform and system architecture” section. Details of our autonomous navigation model, detection-tracking visual strategy, VP detection that applies fully convolutional networks (FCNs), and the concrete navigation process are described in “proposed navigation scheme” section. The experimental results and analysis are described in “experiment and analysis” section 4. Finally, the conclusions are summarized in “conclusion” section.
Hardware platform and system architecture
The presented system employs a refitted DJI Matrice 100 (M100) quadrotor as the inspection platform, as shown in Figure 1. It is equipped with an advanced DJI Lightbridge high-definition image transmission system; a DJI guidance visual positioning system, which operates in GPS-deficient environments; and a DJI Zenmuse X3 (X3 pan-tilt-zoom (PTZ)) gimbal and monocular camera for tracking and detection.

DJI Matrice 100 UAV inspection platform: TX2, DJI guidance, DJI Manifold, DJI Zenmuse X3 gimbal and monocular camera. UAV: unmanned aerial vehicle.
In addition, two embedded processors, DJI Manifold (NVIDIA TK1) and NVIDIA TX2, are situated on the M100. TX2 has a high-performance graphics processing unit and is thus the main processor responsible for detection-tracking visual strategy, VP detection, and control strategies. DJI Manifold is simply used to capture sensor data. The robot operating system (ROS) is run on both processors, and an ROS network is constructed by a router to facilitate information exchange, as shown in Figure 2. Specifically, we run the DJI onboard SDK on Manifold, which builds a bridge between M100 and the upper level TX2. It communicates with flight control N1 and returns important data to TX2 via ROS topics, while simultaneously transmitting control commands from TX2 to N1 and X3 gimbal. Our algorithms, which are detailed in the next section, are implemented in TX2. In particular, we compress raw images with the resolution of 1280 × 720 for stable and real-time image transport from TK1 to TX2. In addition, we employ a laptop for the ROS system to initialize all nodes. Additional parameters and related performances of the UAV platform are listed in Table 1.

System architecture of M100.
Performance of the inspection UAV.
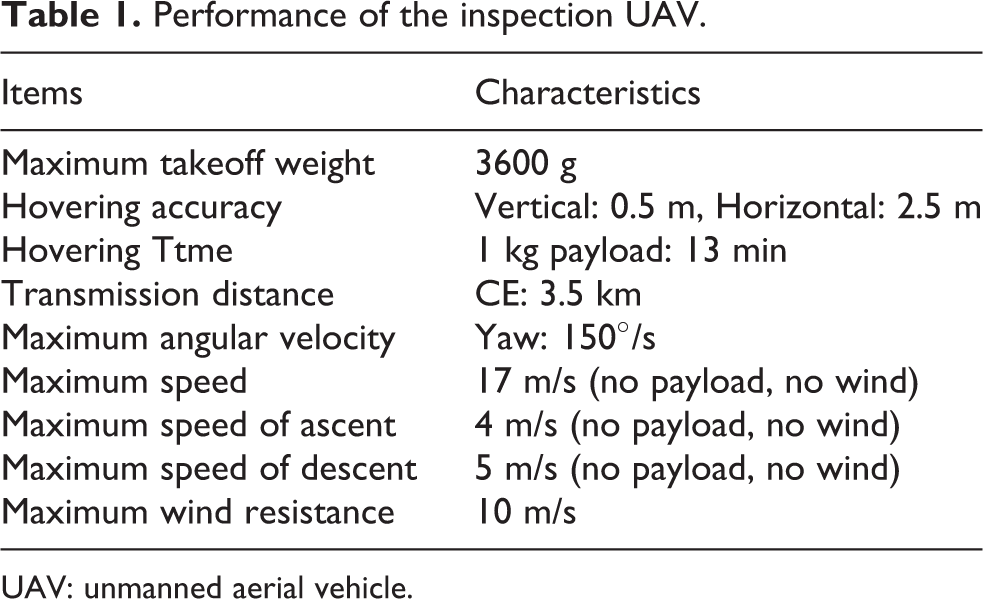
UAV: unmanned aerial vehicle.
Proposed navigation scheme
To have a better description of proposed scheme for transmission-tower-based continuous flight, we first to introduce a perspective navigation model. Thereafter, two key issues comprising real-time reliable transmission-tower localization and robust VP computation are addressed. Finally, we detail the whole inspection process between adjacent towers.
Perspective navigation model
According to previous autonomous navigation models, the UAV has to fly above the transmission lines so that the parallel property of transmission lines can be preserved via the downward facing camera. Navigation depends only on the detected transmission lines. Nevertheless, the performance of these line-based methods is degraded by unreliable line extraction.
By contrast, our model, illustrated in Figure 3, is constructed in three-dimensional (3-D) space and takes the perspective relationship into account. The algorithm employs perspective images as input, and outputs the UAV velocity control amount in 3-D motion space. To better elucidate this concept, we first to introduce three coordinate frames: global inertial frame 

Perspective navigation model.
With respect to the camera coordinate frame Cc, we define two unit 3-vectors β1, β2 separately corresponding to the VP and UAV heading, which are deduced from the following equaitons


where
For a further description of the relationship between β1 and β2, the rotation axis l = (lx, ly, lz) and the rotation angle γ are introduced. They are derived from l= β1 × β2 and γ = arcsin ‖l‖. The rotation matrix

where E is an identity matrix, lΛ is a (3 × 3) skew-symmetric matrix associated with l. By the decomposition of the rotation matrix
Actually, on the one hand, the relative change between spatial 3-vectors can be reflected on the image plane. Such as, on the image plane, we calculate the projection of the UAV flight heading by

where λ is a scalar,
Based on the above analysis, we draw some important conclusions, which are guidelines for our design of navigation scheme and listed as follows: (1) Just by the reliable localization of transmission tower, UAV is capable of autonomous flight along one side of transmission lines between adjacent towers. (2) When UAV flies along the direction defined by VP, the flight route is parallel to transmission lines. (3) Benefiting from this distinct flight route, transmission-line extraction becomes much more robust and observation is much clearer. The detailed navigation scheme will be given in the last subsection after resolving the real-time reliable localization of transmission tower and precise estimate for VP.
Detection-tracking visual strategy
In our navigation scheme, transmission tower, the only landmark in power corridor, must be timely and reliably localized. We select an optimal scheme to resolve this problem, comprehensively considering the limited computational capability of onboard embedded processor, the speed and accuracy of algorithms. Specifically, we picked out the most suitable deep-learning-based object detection algorithm, namely, faster R-CNN. 20 It is the only algorithm that achieves no false detection in our transmission-tower test data set among all tested algorithms. Faster R-CNN presents a region proposal network (RPN) that shares convolutional features with the detection network, thus enabling nearly cost-free region proposals. Shareable features within sliding windows are mapped to a lower-dimensional vector for further object classification and bounding box regression. Nevertheless, for faster R-CNN framework, the currently fastest ZF network 30 is just less than 2 fps on our TX2 platform.
To make up the shortcomings of low speed, we combine real-time tracking with the robust detection. For the tracking, we select the excellent KCFs. 31 KCF obtains training samples by the matrix cycling of images and takes advantage of the Fourier transform to avoid complex matrix inversion operations. These properties of KCF lead to high tracking accuracy and low computational costs. Actually, real-time tracking is more robust in relatively short period due to considering successive property of motion and simultaneously contributes to smooth observation.
When result of tracking exists a significant drift away from target, the tracker is re-initialized from the recent detection result. Further, to address the problem of matching between detection and tracking of different running frequencies, tracking results are recorded in a queue with a first-in first-out property, as shown in Figure 4. The time stamp is attached to the current input frame. When the next frame arrives, the current frame with the distinguishing time stamp and corresponding tracking result is pushed into the queue. The detection result of the current frame will be obtained after several frames due to a delay of computation. According to the time stamp, detection can find the matched tracking in the queue.

Detection-tracking visual strategy.
In addition, in the section of experiment, we will make a detailed comparison and analysis of all tested detection algorithms, and give parameters setting of training faster R-CNN.
VP detection for precise flight heading
The VP of transmission lines is an important visual cue that provides a precise flight heading during autonomous navigation. Although the traditional approach for VP detection has achieved a satisfactory navigation effect, excessive usage of prior knowledge reduces the intelligence and application prospects of the system.
Therefore, inspired by CNN-based methods for semantic segmentation, including crowd segmentation, 32 road segmentation, 28 and retinal vessel segmentation, 33 we adopt the excellent FCNs, which apply a deep learning pipeline and can be trained from end to end. Specifically, we apply this technology before the traditional VP detection method. This simultaneously avoids wasting visual resources caused by a prior-knowledge-based filter and relieves some difficulties involving narrow line extraction from complex backgrounds.
Currently, various FCNs in combination with residual networks 34 have reached state-of-the-art level. Considering both the heavy computational costs and immense manual labeling work—prompted by precise pixel-level segmentation—we decided to apply segmentation on the region level.
In view of the special distribution of transmission lines, we employ a simple but effective means of manual annotation. As shown in Figure 5, transmission lines are divided into several parallel line groups, each of which corresponds to a phase voltage. Transmission lines in the same group are covered with red polygons, which are regarded as ground truth labels for training and evaluating FCNs. With respect to the loss function, we employ an effective cross-entropy approach, which is defined as equation (6) for a binary classification
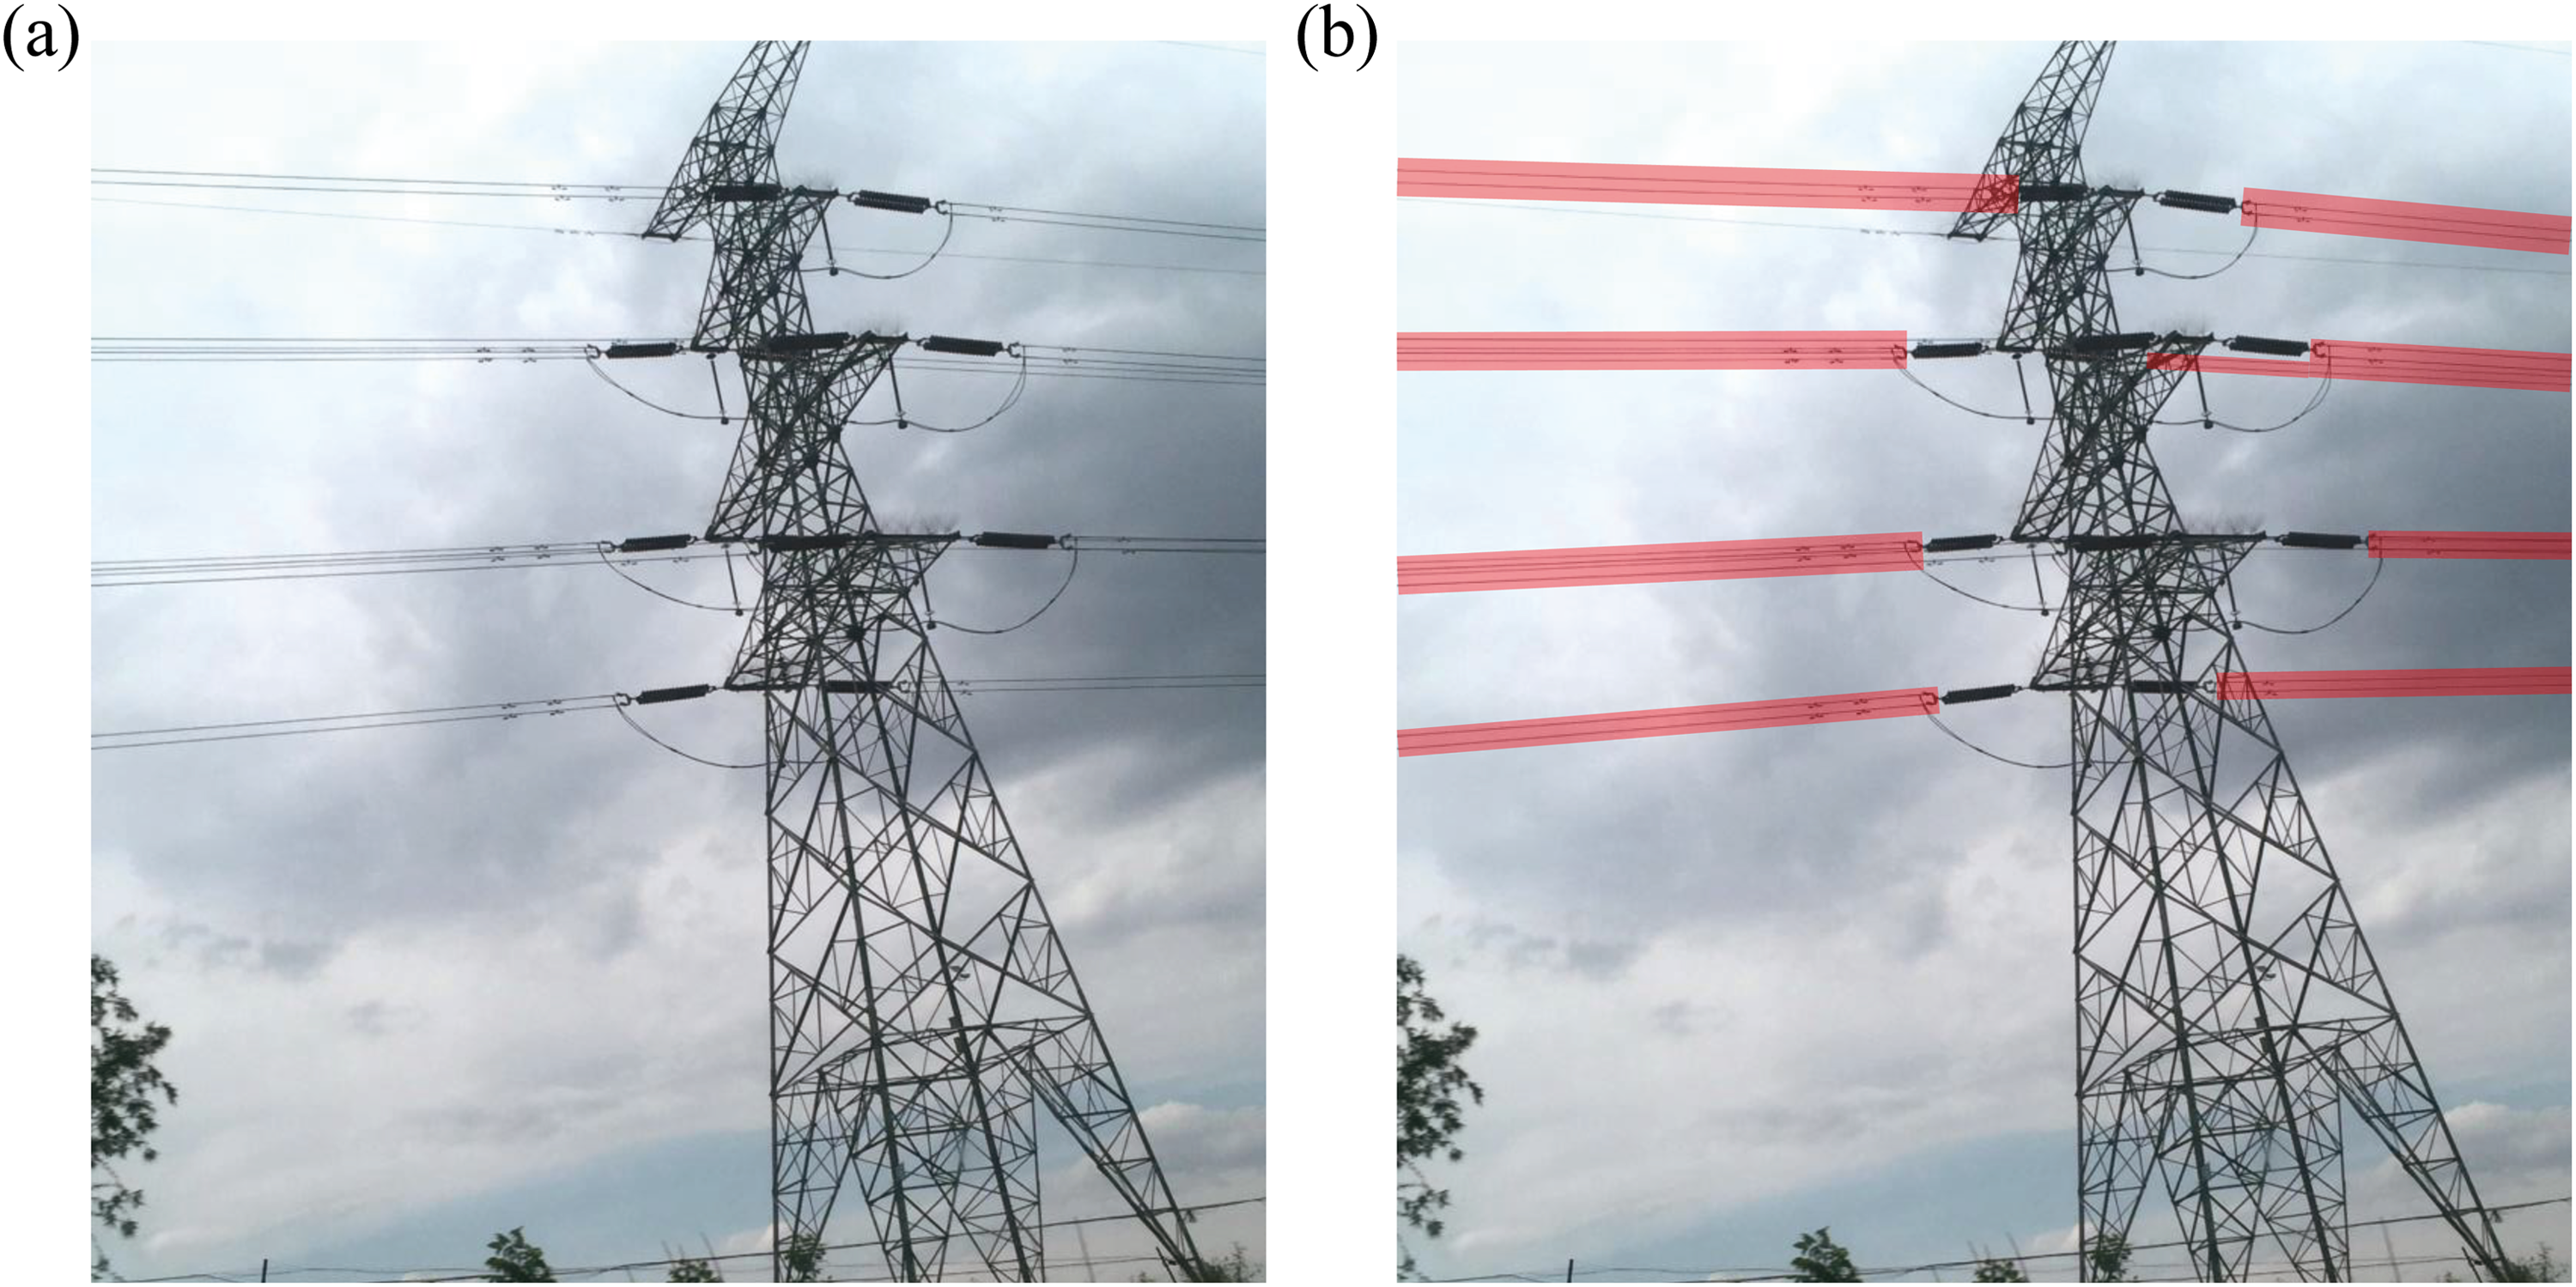
(a) Original picture. (b) Annotated picture (Red polygons correspond to the ground truth).
where No is the number of output neurons, ak is the ground truth, and bk represents prediction.
As shown in Figure 6, FCNs are composed of convolution and deconvolution networks.
35
Regarding the feedforward convolution part, VGG 16-layer networks
36
are employed for multidimensional feature representation. Their fully connected layers are converted to convolutions for the production of a heat map. From that point, to recover the original input size, the heat map, whose size has been reduced to

Structure of FCNs and feature maps for transmission-line segmentation. FCNs: fully convolutional networks.
To combine with the traditional method for VP detection, as shown in Figure 7(b) [(a) is the raw image], within the red transmission-line regions generated by FCNs, LSD 10 is carried out, whose results correspond to the white regions displayed in Figure 7(c). The linear-time LSD, with no parameters tuning required, is regarded as an effective preprocessor, which algorithm is capable of adaption to a certain degree of environmental change. As a consequence, we apply LSD before the Hough transformation, which arrangement significantly improves quality of Hough line-detection. Finally, as displayed in Figure 7(d), the red straight line segments, available for computation of VP, are exactly the result of Hough line-detection.
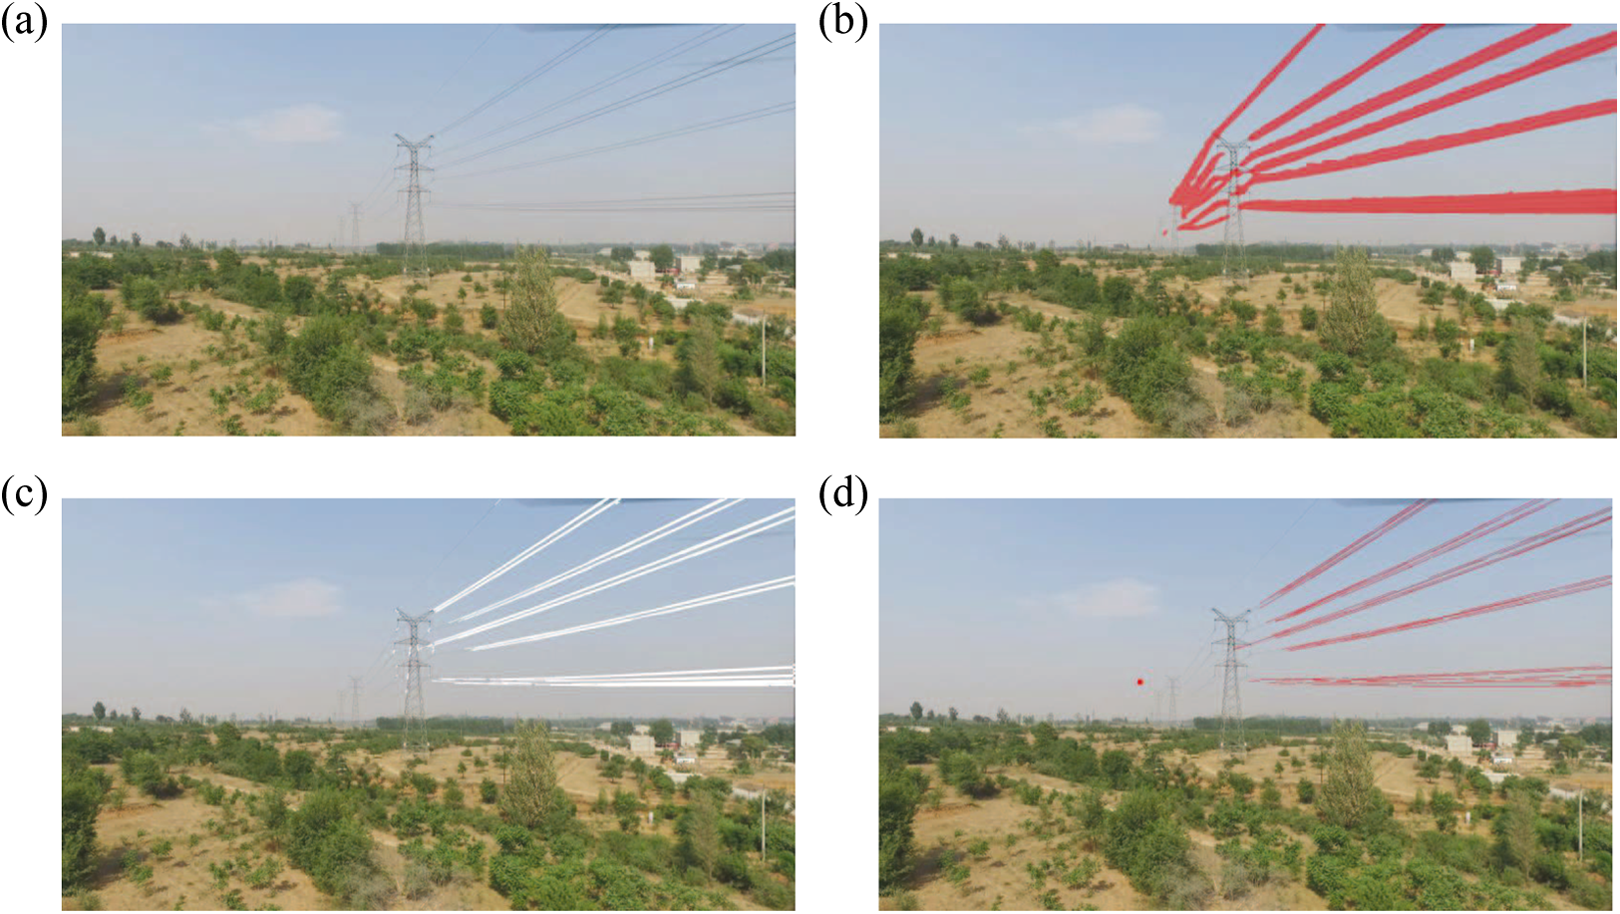
Process of proposed VP detection. VP: vanishing point.
Before estimation of VP, the robust algorithm RANSAC
29
is deployed. RANSAC returns the consensus set, which has the largest number of inliers. Here, an inlier is a straight line segment whose distance to the VP is lower than a specific threshold. For further optimization of VP, a typical consistency measure method is first to be introduced. As shown in Figure 8, 

Illustration of the consistency measure.
where dis() is a distance function from a point to a line and × denotes the cross product of two vectors.
Following the RANSAC result, the VP position is further refined by an iterative nonlinear optimization method. It is worth mentioning that there exist two common refinement models involving least mean square (LMS) model and maximum likelihood estimation (MLE) model. 37 Their objective functions are displayed as follows


where N is the number of inliers and M denotes the number of all the detected lines. Specifically, P(Ik|v) is a prior model that should be learned in advance for different databases and different consistency measure methods.
We finally select the LMS method based on the following consideration. LMS, using only the inlier lines, is faster to compute and does not need the prior probability model from the training set, even though MLE, using both inlier and outlier lines, achieves a slightly higher accuracy. For the initial estimation of the LMS objective function, linear equations Δv = η deduced from the results of RANSAC are introduced. Each row of it corresponds to a straight line equation through VP, which is built by the detected straight segment. According to the Hough result, this n × 2 set of equations has the following form
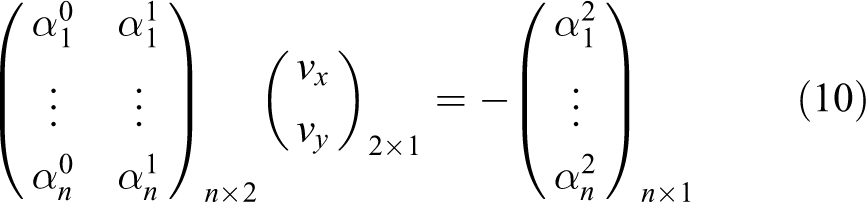
where
The navigation process
Based on the perspective navigation model, the detailed navigation scheme is illustrated in Figure 9. We decompose a long-distance inspection mission into several short subtasks between adjacent transmission towers. The short subtask is further divided into two stages: initialization and inspection.

Flowchart of autonomous navigation between adjacent towers. Initialization stage and inspection stage are distinguished with green and purple dashed bounding boxes. The red bounding box represents the result of detection. The blue bounding box denotes the result of tracking. At the stage of heading adjustment, the blue circle denotes the projection of current heading, the red circle denotes the estimated VP, the green lines represent the estimated straight segments passing through VP.
At initialization stage, by detection, the UAV determines first the position of the next tower. Thereafter, the PTZ adjusts the pitch and yaw angle to make the camera optical axis point to the center of the detected transmission tower. At the stage of UAV heading adjustment, pA is constantly calculated by eqaution (5) until it reaches the same horizontal position as VP. Since PTZ actively tracks tower, VP position has almost no change during the adjustment of flight heading. In a practical application, we just calculate VP once and apply FCNs to the system successfully. In particular, we suggest an experiential flight heading to cope with the case that VP is nonexistent. The horizontal distance from the projection of experiential heading to the center of tower pB is 1.2 times the width of the bounding box. Following the experiential direction, UAV may fly along a z-type trajectory in a power corridor.
At the inspection stage, the UAV flies along the expected heading. With the detection-tracking visual strategy enabled, the PTZ constantly adjusts the yaw and pitch to track the next tower until the relative yaw angle ψpu between camera optical axis and the expected heading reaches 90°. During the flight, once the tracking fails, UAV will immediately brake. After that, the tracker will be initialized again using the recent detection result.
Experiment and analysis
To verify the effectiveness of the proposed approach, three experiments were conducted. First, by comparison among state-of-the-art object detection algorithms, faster R-CNN (ZF) was demonstrated to be most appropriate for reliable localization of transmission tower. The remarkable improvement of both robustness and precision of VP detection by the proposed method was demonstrated by the second experiment. Finally, the whole system was tested in a practical inspection environment followed by a detailed discussion.
Tower detection experiment
For this experiment, we collected 1280 sheets of transmission-tower pictures from aerial photos, 1000 of which are used as training, and the rest of which are used as test. To find an appropriate detection method for reliable localization of transmission tower, we make a comparison among three state-of-the-art object detection frameworks comprising faster R-CNN, 20 SSD, 21 and YOLOv2. 39 Comparison was conducted from the following three aspects: speed, average precision (AP), and the ratio of false detection (precision-recall curve). Following the detection evaluation scheme of the PASCAL visual object classes challenge, 40 precision and recall are defined as:

where true positive (TP), false positive (FP), and false negative (FN) separately correspond to true positive (tower is correctly detected), false positive (background is mistaken as tower), and false negative (tower is not detected). AP is approximate as the area under the precision-recall curve.
As shown in Table 2, at the aspect of speed, SSD300 outperforms other methods and simultaneously achieves a relatively high AP. For the AP, faster R-CNN (VGG16) has a slight advantage over other methods. With respect to the ratio of false detection, as illustrated in Figure 10, overall, faster R-CNN (ZF), denoted by the green solid line, maintains a 100% precision, namely, no false detection, over a fairly wide range of recall, which clearly surpasses SSD and YOLO. At this point, both SSD and YOLO encounter different degrees of false detection, even at a low level of recall. In addition, all the curves break off when the recall is close to one. The reason is that, for all the tested algorithms, there exist some bounding boxes that have not been detected. In fact, detection-tracking visual strategy depends heavily on the detection accuracy. During the autonomous navigation, we can accept a certain degree of missed detection (FN), whereas cannot tolerate the false detection (FP), which brings a significant threat to navigation safety. Thus, we decide to apply faster R-CNN (ZF) to this visual strategy. For the best test result, following the four-step training algorithm proposed by faster R-CNN, we selected 80, 000, 40, 000, 80, 000, 40, 000 iterations, respectively, corresponding to each step. ZF network is pretrained by ImageNet. 41 Other parameters take the default settings.
Speed and average precision.a

AP: average precision; FPS: frame per second; faster R-CNN: faster region-based convolutional neural network.
aFor faster R-CNN, (ZF) and (VGG16) represent two different networks of feature extraction. SSD300 and SSD512 separately correspond to 300 × 300 and 512 × 512 input resolutions. YOLOv2 corresponds to the 544 × 544 input resolution. AP and FPS are is measured on NVIDIA TX2.
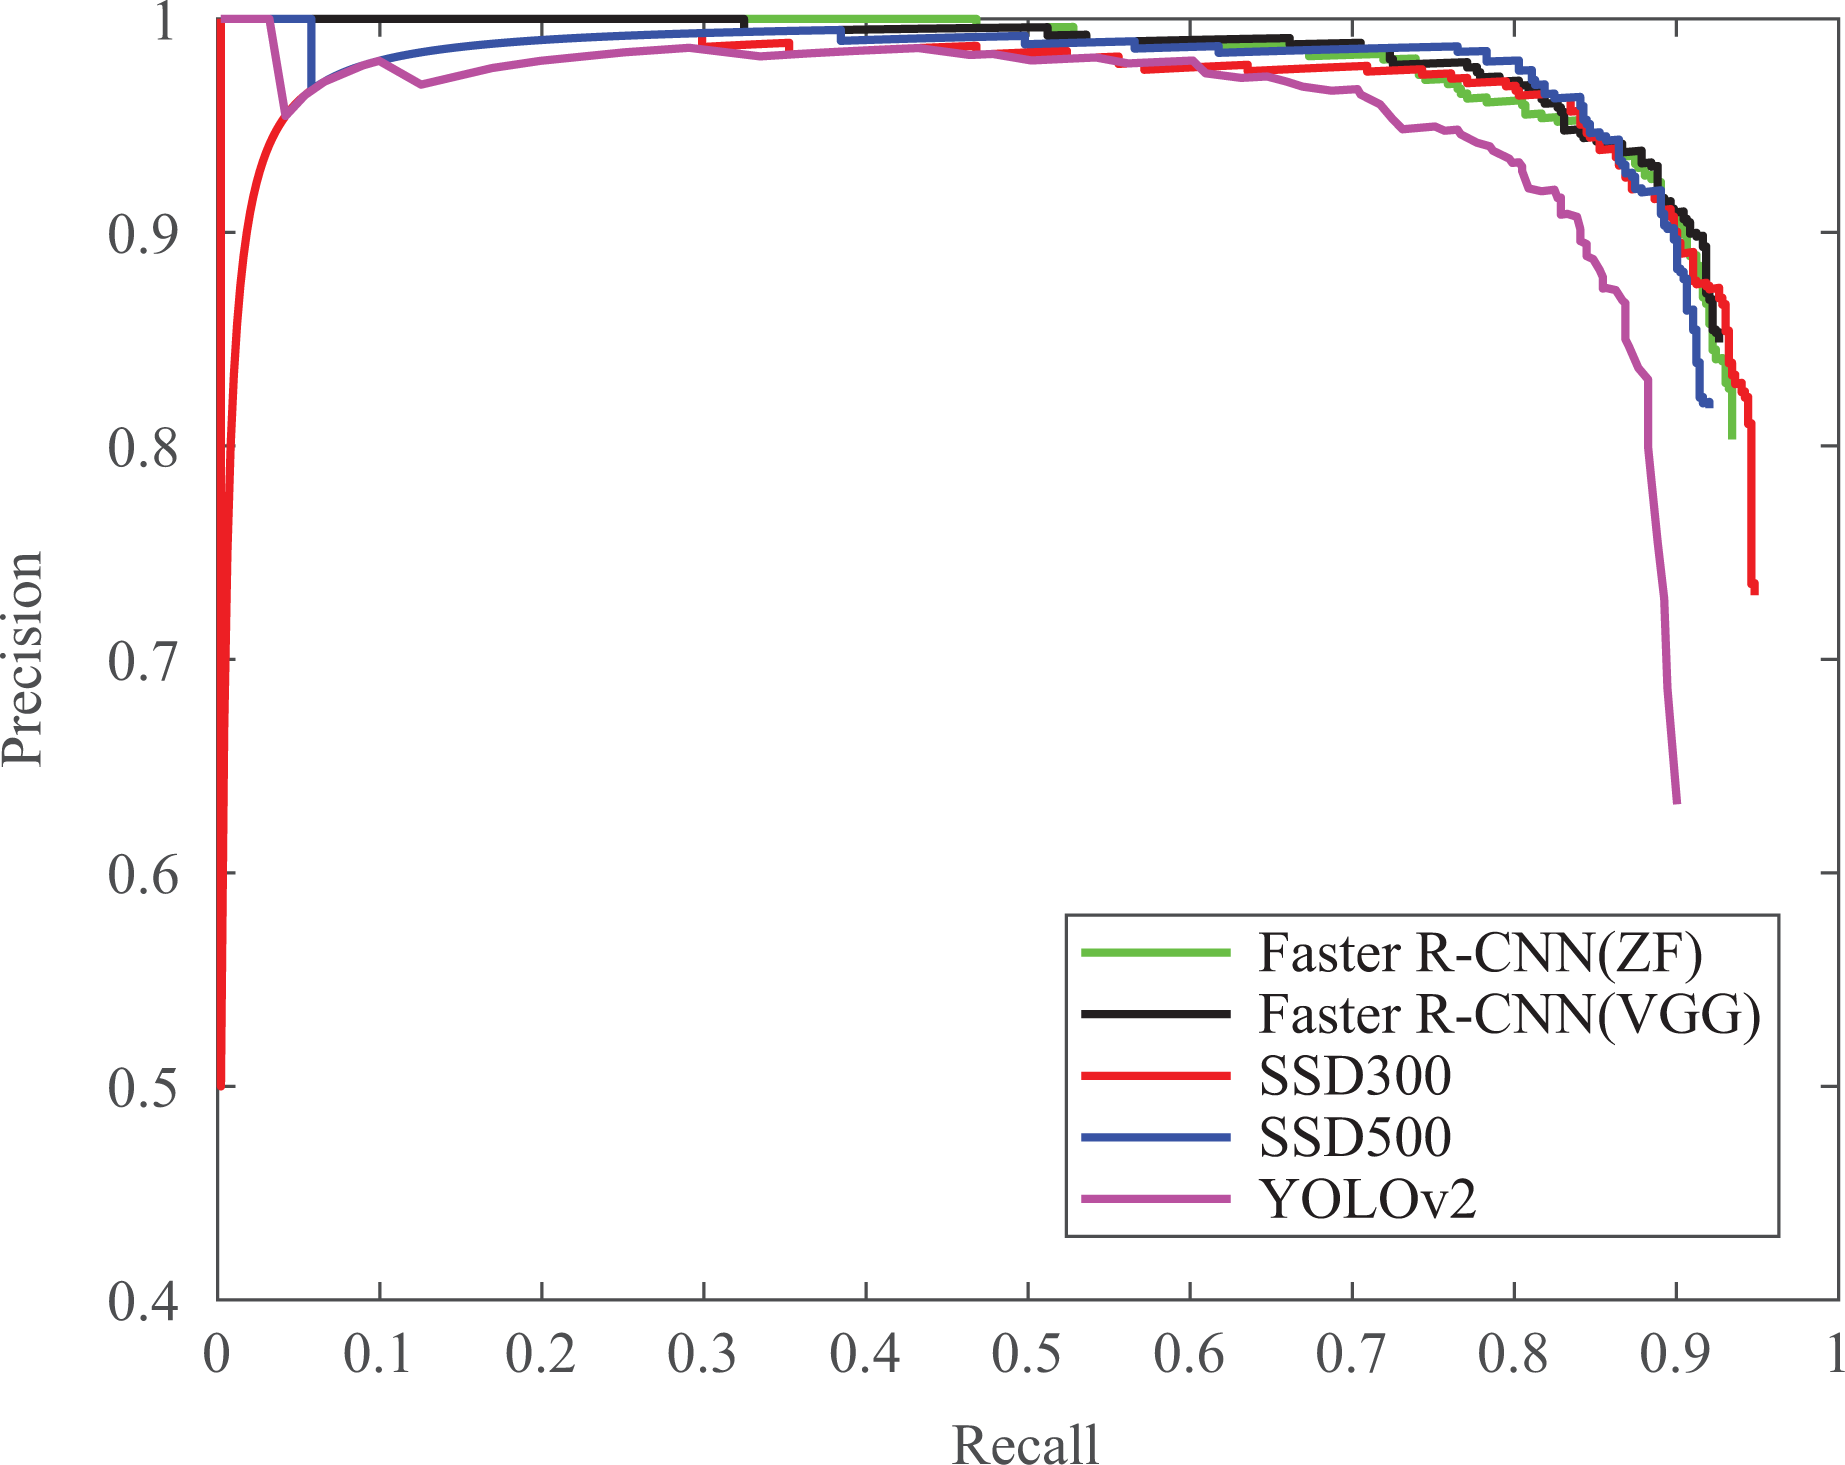
Precision-recall curve for detection.
For a more detailed explanation of the detection-tracking strategy, we selected a short typical excerpt from all the recorded videos, which involves the particular case of the tracking failure and initialization by detection again. In Figure 11, with the changes of visual angle shown in Figure 11(a)–(c), the projection of sun moves toward left relative to the target tower, in which case the tracking fails and the blue tracking bounding box drifts gradually away from the target tower. As shown in Figure 11(d), when the pixel disparity between both bounding box centers of tracking and detection are beyond 120 pixels, the tracking is considered a failure. From that point, UAV begins to slow down until the velocity is zero. At the moment corresponding to the frame 617, as shown in Figure 11(h) by the red detection bounding box, the tracking is initialized again.

Example of detection-tracking visual strategy. The red bounding box represents the result of detection. The blue bounding box denotes the result of tracking. The red character string beginning with character # and displayed in right upper region indicates the frame number. The cyan straight line segment as shown in the upper-left region denotes the horizontal pixel errors between the centers of tracking and detection.
VP detection experiment
In this section, we show first the necessity of applying FCNs in transmission-line VP detection. A comparative experiment was performed to verify that the proposed method improved the detection precision. Unlike in tower detection, we did not draw a precision-recall curve because drawing this curve requires a pixel-level label instead of a region-level label. For VP detection of transmission lines, segmentation is simply a subtask; thus, the pixel-level label is believed to be difficult to use and unnecessary.
To train FCNs, 600 pictures were collected from aerial videos, 400 sheets of which were used for training and validation. The remainder was used as test items. The pictures of the training set were obtained from many different scenes covering rural areas, mountain areas, and suburbs, whose backgrounds included farmland, highways, blue skies, and high mountains. Additionally, changes of illumination, viewpoint, and distance were also taken into consideration. The test results are shown in Figure 12. The first four images were obtained from the PTZ camera with the same resolution of 1920 × 1080. The remaining four sheets were selected from the processed results at the stage of VP detection with a resolution of 1280 × 720 and having JPEG compression. Figure 12(a) shows that transmission lines are partly occluded by the UAV landing gear. In the case of the bright light shown in Figure 12(b), the decreased contrast makes the transmission lines difficult to distinguish. However, the FCNs are still effective and achieves excellent performance. In Figure 12(c), the transmission lines are nearly submerged in farmland. However, the distant highway, which has distinct edges, and the nearby farmland, which has clear textural features, do not cause interference to the correct extraction work. Figure 12(d) shows that, despite the change of the observation distance and angle, the correct extraction can still be guaranteed. Constrained by the router bandwidth, the real processing images must be compressed with JPEG format to ensure a reliable transmission, which means poor image quality. Nevertheless, the outstanding FCNs have not been impacted by this negative factor. We tested the whole system at dusk and early morning, and selected four typical images processed at the stage of VP detection, which separately corresponded to Figure 12(e)–(h). In the course of practical inspection, the detected transmission lines are mostly with the background of blue sky. Nonetheless, the traditional VP detection may often fail on account of adverse weather and poor illumination. As shown in Figure 12(e) and (f), which suffer from cloudy weather, the VP detection combined with the FCNs properly functions. In the condition of dazzling illumination at dawn, as shown in Figure 12(g) and (h), the FCNs successfully extract a few useful straight line segments, which are sufficient for VP detection.

Extraction of transmission lines applying FCNs. The red circles in (e)–(h) are the detected VP. FCNs: fully convolutional networks; VP: vanishing point.
Many VP detection methods serving autonomous driving are effective because pavements, which own clear edges and more pixels, are easier to distinguish from background. In contrast, transmission lines have fewer pixels and are difficult to identify; thus, extraction is more readily impeded. We think that the precision of VP detection highly depends on the number of transmission lines detected. Different methods achieve similar accuracy on the same detection result.
As a consequence, we simply compared the edge-based method with its improvement that is joined with FCNs. As a reasonable contrast, we used the upper-right region of the overall image as input of the conventional method. This approach notably incurred the loss of some valuable transmission lines. Regarding the proposed method, the processing was carried out on the overall image. For the quantitative evaluation methodology, we selected the accumulative pixel error between the real detection and ground truth. This kind of assessment was believed to be meaningful and sufficient to verify the effectiveness of the proposed method for the goal of transmission-line VP detection.
With respect to the test data set, a sequence of images with the resolution of 1280 × 720 was selected. These images were obtained during an autonomous flight between adjacent transmission towers. The curve of accumulative pixel errors is shown as Figure 13. It is shown that the accumulation errors relating to the proposed method are 450 pixels. This result is superior to that of the traditional method with an error of 750 pixels. The average of seven pixel errors is negligible for the 1280 × 720 resolution image, which results from the uncertainty of the annotation due to the intrinsic pendulous traits of transmission lines. In addition, a steep ascent occurs at the end of the curve for the traditional method owing to the change of illumination. In contrast, the curve for the proposed method is relatively smooth, which indirectly proves the capability of the proposed method to resist environmental interference.

Accumulative pixel error between the estimated VP and the ground truth. VP: vanishing point.
Comprehensive experiment
In addition to the performance analysis of each system part, we performed comprehensive experiments to demonstrate the feasibility of the entire system. The test distance was approximately 400 m, which covered two adjacent intervals. Although the method could achieve more distant autonomous navigation, we relinquished the more distant test with consideration of the safety of power infrastructures and UAV. Nonetheless, the test with a limited distance was adequate to demonstrate the effectiveness of our system.
UAV waypoint and PTZ orientation were synchronously recorded with respect to inertial coordinate frame from the initialization stage. The waypoint, which is the fusion result of visual positioning system (DJI guidance) and GPS, was measured relative to the takeoff position. Further, the waypoints were sampled with an interval of fifty to clearly describe the trajectory, as shown in Figure 14. The average flight duration between adjacent waypoints is approximately 4 s. We select four typical positions shown in the figure for a detailed explanation. At the position A, PTZ, whose camera optical axis is denoted by the red arrow, adjusts the yaw and pitch angle to situate the detected transmission tower in the image center. Then, UAV rotates to the expected heading defined by VP. In order to avoid the occlusion to the camera caused by landing gear, from waypoint B, UAV continues to fly along the expected direction and simultaneously begins to rotate. At the position C, the relative yaw angle ψpu reaches 90°, the inspection between adjacent towers ends. After that, the next inspection starts with waypoint C and ends with waypoint D.

Planar view of a trajectory with direction annotation.
Furthermore, at different initial positions, we conducted multiple tests. As shown in Figure 15, a total of nine trajectories were painted, each of which was similar to the trajectory, as shown in Figure 14. Figure 15 is a planar view of flight trajectories. All practical trajectories are in agreement with the expected. Figure 15(b) displays the change in trajectories in terms of height. In particular, there exist skews between the directions of transmission lines and the trajectories 1 and 2. The occurrence of some poor trajectories is attributed to the following factors. Owing to the intrinsic pendulous traits of transmission lines, the difference between the computing orientation defined by VP and the ideal flight heading is inevitable. In addition, the number of detected transmission lines, which relates to many factors, such as the observation distance and angle, illumination, weather, and so on also has a significant impact on the computation of VP. Moreover, during the flight, in view of the general positioning precision, the flight course can likewise be influenced by wind.

Planar and altitude views of multiple trajectories. (a) Planar view of multiple trajectories. (b) Altitude view of multiple trajectories.
Discussion
Owing to faster R-CNN, the false detection never came about during tests. Although the target is occasionally lost during inspection—likely on account of poor illumination—it is not a severe issue because the currently effective tracking result is adequate to aid in navigation. With respect to tracking, a failure occasionally arises at the initialization stage, which is attributed to both the rapid rotation of the camera and the blurry image caused by the poor condition of illumination. In addition, as mentioned in Figure 11, when the background feature is more distinct than the foreground, the tracking may gradually drift with the background. Serious drift eventually causes the tracking to be initialized again by detection. Moreover, the strategy of flying with simultaneous rotation decreases the tracking drift to a great extent. The probability of a simultaneous failure of both tracking and detection is extremely low; thus, localization of the transmission tower is also very robust.
With respect to VP computation, it is actually not always the case that a greater number of detected transmission lines results in a more approximate computation heading to the ideal flight heading. This is because the inevitable pendulous trait of transmission lines becomes much more serious at the start and end of the transmission line. Thus, a determination should be implemented about whether the computation VP is located within the region of the detected bounding box. If the VP quality is poor, the UAV should fly along the direction of the convergence of transmission lines, or the experimental direction. Based on the aforementioned analysis, the extraction of transmission lines by applying segmentation via deep learning plays an important role in the determination of the flight heading.
Despite the excellent autonomous navigation performance of our system based on transmission towers and transmission lines, there exist some shortcomings. First, there is a lack of consideration of the distance to transmission lines; thus, the more distant navigation remains a challenge. Nowadays, at a secure distance of 20 m, it is difficult to directly measure the distance to transmission lines depending only on the existing sensors. Actually, the distance can be estimated by the position of the tracked transmission tower. The position of the transmission tower can be further estimated from several images obtained at multiple different positions. Second, our approach is just effective when meeting the following two hypotheses: the next tower to be positioned at the initialization stage (1) has a maximum detected bounding box relative to other detected towers and (2) must be within view. Navigating in more complex environments may require the assistance of GPS.
Conclusion
In this article, we proposed a safe and robust transmission-tower-based autonomous navigation approach for UAV transmission-line inspection. For the implementation of the proposed method, a UAV inspection platform carrying advanced embedded processors was developed. To the best of our knowledge, it is the first time that transmission-tower-based navigation method is put forward and is put into practice. The transmission tower is regarded as an important landmark, by which the continuous inspection in the power corridor can be realized. Furthermore, the unique means of flying along one side of the transmission lines is adopted, which reduces the risk of inspection accidents. To achieve the aforementioned concept, an important navigation model was herein introduced, which addresses the problem that UAV will be capable of perception of a 3-D world simply by leveraging an image with perspective distortion.
Specifically, to achieve the real-time and robust localization of a tower, a detection-tracking visual strategy that integrates the detection and tracking is used. We finally apply faster R-CNN to the detection-tracking framework for a trade-off between speed, precision rate, and recall. At the stage of flight heading calculation, FCNs are first employed to realize the transmission-line extraction of great importance, which is effective, even in more complex environments. With respect to the precise flight defined by VP, the algorithm based on the RANSAC strategy, together with linear and nonlinear optimization, is employed. Additionally, an experimental flight heading is adopted to cope with the case in which a VP is nonexistent. Finally, with the newly designed experimental platform, continuous flight experiments without GPS demonstrated the effectiveness of the navigation model and proposed methods.
Our ongoing and future work will focus on the maintenance of the safety distance between UAV and transmission lines to further improve the inspection safety. In addition, based on this novel navigation scheme, a transmission-line tracking algorithm is being developed for a high-quality observation of transmission line. Based on the earlier works, an online transmission-line fault diagnose system will come true soon.
Footnotes
Acknowledgements
Declaration of conflicting interests
The author(s) declared no potential conflicts of interest with respect to the research, authorship, and/or publication of this article.
Funding
The author(s) disclosed receipt of the following financial support for the research, authorship, and/or publication of this article: supported by the National Natural Science Foundation of China under grant nos. 61673378 and 61421004.