
Abstract
Intelligent transportation systems and safety driver-assistance systems are important research topics in the field of transportation and traffic management. This study investigates the key problems in front vehicle detection and tracking based on computer vision. A video of a driven vehicle on an urban structured road is used to predict the subsequent motion of the front vehicle. This study provides the following contributions. (1) A new adaptive threshold segmentation algorithm is presented in the image preprocessing phase. This algorithm is resistant to interference from complex environments. (2) Symmetric computation based on a traditional histogram of gradient (HOG) feature vector is added in the vehicle detection phase. Symmetric HOG feature with AdaBoost classification improves the detection rate of the target vehicle. (3) A motion model based on adaptive Kalman filter is established. Experiments show that the prediction of Kalman filter model provides a reliable region for eliminating the interference of shadows and sharply decreasing the missed rate.
Keywords
Introduction
Vehicle detection technology is an important topic in computer vision, image processing, and pattern recognition of vehicle safety driver-assistance systems. Front vehicle detection systems provide the environment information of vehicles in front via sensors, such as millimeter wave radar, laser radar, infrared rangefinder, ultrasonic radar, and camera. The camera is a commonly used sensor device due to its cost, practicality, anti-jamming, and information-rich properties. Charge-coupled devices (CCDs), complementary metal–oxide semiconductors, and other visual sensors can perceive information on the surrounding environment, collect images of the surrounding scene, and pass that information to a computer. The computer then analyzes the geometric properties, motion, structure, and position information of objects to recognize their classes and determine scenes and objects, such as vehicles, pedestrians, and obstacles. This process will aid the system in providing correct decisions.
Several vehicle detection and target recognition systems have been devised recently; these systems are based on the image processing of a vehicle camera, which includes methods based on monocular vision, 1,2 three-dimensional (3-D) vision (binocular), 3,4 and those that combine monocular vision and stereovision. 5 Monocular vision can be improved in many aspects, such as in terms of image segmentation, detection, and tracking. Piccioli et al. 6 and Gao et al. 7 detected and recognized gray road signs and obtained significant results on country roads, freeways, and cluttered city streets. Srinivasa used edge filter for image segmentation and adopted clustering algorithm to reduce computation time after detection. 8 Bertozzi et al. investigated large-scale parallel architecture on vehicle detection systems to improve real-time performance. 9 Vehicle detection and target tracking systems have several applications in different scenes and environments. Lee et al. 10 and Balcones et al. 11 studied vision-based vehicle detection in non-flat roads and multiple-obstacle situations. Trivedi et al. 12 and Broggi et al. 13 developed a vehicle detection system that can detect surrounding vehicles to prevent collision. Milan A. and Dehghan A. have study the driver's alertness system 14,15 and analyzed the pedestrian detection module 16,17 in intelligent vehicles also affected the validity and feasibility.
Video-based vehicle detection and tracking algorithms are subject to several key issues. These issues motivated the present study. The following key problems and difficulties are investigated in this study: (1) The accurate segmentation and improvement of the robustness and real-time performance of the algorithm in the background with gradually changing circumstances. (2) Differences between the angle of view and illumination change the character of the target, thereby increasing the difficulty of real-time recognition and tracking. Selecting and extracting invariant features also require improvement. (3) The shadow of moving vehicles and the mutual obstruction between each target result in incomplete vehicle information, thereby causing difficulty in vehicle identification. 15
We investigate the key problems in front vehicle detection and tracking based on computer vision. The video of a vehicle driven on an urban structured road is used to predict the subsequent motions of the front vehicle. This study presents the following contributions. (1) A new adaptive threshold segmentation algorithm is presented in the image preprocessing phase. This algorithm is resistant to interference from complex environments. (2) Symmetric computation based on the traditional histogram of gradient (HOG) feature vector is added in the vehicle detection phase. The symmetric HOG feature with the AdaBoost classification improves the detection rate of thetarget vehicle. (3) A motion model based on adaptive Kalman filter is established. Experiments showed that the prediction of Kalman filter model provides a reliable region for eliminating the interference of shadows and decreasing the missed rate.
Preprocessing of video frame
Traffic video is recorded through a colored CCD camera. During acquisition and transmission, signals are frequently disturbed by noises, including illumination, shadow, camera imaging errors, and camera jitters. The video frame sequence is a series of colored images. The rich information in colored images involves a large amount of computation time and low processing efficiency. Improving the real-time efficiency of detection and tracking requires de-noising the original image and extraction of relevant information to improve the accuracy of operation and reduce the computation of subsequent modules.
Graying and de-noising of image
Image graying strictly requires real-time performance in vehicle detection and target tracking. However, the complicated computation of colored images decreases the processing efficiency and results in insufficient real-time performance. The conversion of colored images to gray requires amount of computation, increased processing speed, and well-formed features. 6 The weighted average method is used for gray image processing.
Image de-noising is performed when devices and the environment generate high-frequency noise during video acquisition. These low-quality images influence the overall performance of vehicle detection and tracking. Thus, image de-noising is conducted to improve the accuracy of subsequent computations. The Gaussian filter is applied to preserve image information and eliminate noise.
Image segmentation
Image segmentation is conducted to separate the object from complex and unusable backgrounds based on the difference between the target and the background features. At the present time, image segmentation algorithm is used for vehicle detection and tracking applications, such as the optical flow and frame difference methods. The background difference method is only applied in a static background, which indicates that the background does not change significantly. However, the static background model cannot be established during the experiment because of the complex environment. An example of this environment is the varying states of vehicles, such as the state of running at high speed, moving slowly, and stopping at a roadside. The states of front vehicles should be detected and tracked.
To satisfy the requirement of target detection and tracking in dynamic scenes and improve robustness to environmental changes, we adopted a new method of image segmentation, namely, adaptive threshold segmentation. Each video frame is regarded as a scene. The edge and shadow feature underneath the vehicle separate the vehicle from the background. All vehicles have edge features that are clearly distinguished from the background. Pavement elements are relatively smooth and monotonous under normal circumstances, and the edge features of vehicles are noticeable. The shadow features of the vehicle are shown as dark areas, wherein the gray value of the shaded area is smaller than the other parts. The main flow of algorithm implementation in this section is provided below.
Edge detection
Sobel, Canny, and log operators are compared to detect edges. The Sobel operator eliminates noise, but it does not strictly separate the theme and background image and the quality of extracted contours may not be satisfactory. The Canny operator provides significant results that are difficult to achieve. The log operator has a smoothing effect on noise, but it can suppress slight changes in a small-scale image to reduce computation.
Adaptive threshold computation
The log operator cannot sufficiently detect objects on the pavement. For example, the lane line is not detected accurately, whereas the edges of vehicles are easily detected. This feature is used to select road pixels. An adaptive threshold segmentation method based on region growth method is presented. The region of interest (ROI) method is selected using the region growth method, and the threshold according to regional road pixels is computed. The threshold for every video frame according to the current scene is then computed, which is resistant to the changes in the environment background, such as illumination. The process of image segmentation is shown in Figure 1.
Road area selection using region growth method
Region growth method is an ancient image segmentation method proposed by Levine et al. The basic premise of this method is to divide the regions of pixel sets with similar properties. This method can achieve good performance when segmenting complex images, such as natural scenery. The following process is adopted using the regional growth method for road area selection: Image growth is examined from left to right and bottom to top. Pixel is saved to the geometry of the road area to scan one pixel. Scanning is performed from bottom to top until the edges are scanned and the last pixel is saved. This pixel may refer to the edge of the road, a vehicle, or other objects on the road. One pixel is moved from bottom to top. This step is continued until the image is fully scanned. Edge feature comparison is shown in Figure 2.
Extraction of threshold according to road pixels
The final step of image segmentation is to obtain the threshold value of image binarization. First, the Otsu method is used to extract the threshold. However, the threshold is not easily separated from the front vehicle and background. Thus, another method is implemented to compute the threshold according to road pixels. The mean m of road pixels and standard variance σ are used. (m − n × σ) is also used as the threshold for the binary image. The range of n is 0-3. Before and after image processing using region growth method are shown in Figure 3.
Segmentation performance varies based on the selection of n. Adequate illumination provides good segmentation performance with a high value of n. If illumination is inadequate, the value of n tends to be small.

The process of image segmentation.

Edge feature comparison.

Before and after image processing using region growth method.
An existing theory suggested the presence of a shaded area in the bottom of a vehicle regardless of illumination performance. This theory is tested and verified. Figure 4 shows black areas generally exist at the bottom of the vehicles after binary image processing. This area is an underbody shaded area. Target vehicles are separated from the background. The features of underbody shadows are extracted, which can be used as the basis for the hypothesis on the detection and verification phases of front vehicles.

Binary image after adaptive threshold segmentation.
Vehicle detection
Vehicle detection aims to detect the size, direction, and other information of the target vehicle using the geometric and object characteristics of image preprocessing. The current version is the popular method used for front vehicle detection. Most detection methods, such as optical flow and frame difference methods, are not suitable to be used in our videos due to the complex background, illumination changes, and the various states of vehicles. Front vehicle detection based on computer vision is generally divided into two steps. The first step is image feature extraction. The second step is classifier recognition. The presence of potential target areas is assumed by considering the cost of image computation in which features of the regions are extracted to recognize vehicles using machine learning methods. 18
Front vehicle hypothesis
Regions that match the features of the outgoing vehicle are identified, and these regions are considered as front vehicle hypothesis.
19
The result of image segmentation in “Image segmentation” section shows the shadow feature of the target vehicle. Underbody shadow features are considered ROI. The camera angle is adjusted parallel to the road. The target shown in the video frames is the rear image of the vehicle. The bottom image is the shadow and below that is the road. “Image segmentation” section provides the shadow map obtained through adaptive threshold segmentation. The assumed region of front vehicles is obtained with restrictions. These restrictions include the following: No vehicle exists above one-third of the height of video frame. The width of underbody shadow in the shadow map is not less than 1/20th of the image width and not more than one-half of the image width. The ratio of width and height in the shadow map is more than 1.5.
HOG feature extraction
HOG is invariant to geometric distortion and optical deformation of the image. 15 Target vehicles are separated from other objects and background using the HOG feature operator. Stable and accurate results are not easily obtained through HOG operator due to unstable environmental interference and illumination. Stimulated by the combination of several features, 11 a hierarchical HOG symmetrical feature is presented by adding the symmetrical properties of front vehicles to improve HOG features and increase accuracy.
Several detection results at the back of the vehicle are symmetric. The extracted HOG feature is also symmetrical. HOG1 located at the top left corner and HOG2 located the top right corner are symmetric, whereas HOG3 located at the bottom left corner and HOG4 located at the bottom right corner are similar. The symmetry of HOG feature is shown in Figure 5. HOG feature is computed in eight channels. The symmetric vector has eight dimensions. The symmetry of the HOG feature does not indicate that the two features are directly symmetrical. Transformation is performed and shown in Figure 6.

The symmetry of HOG feature. HOG: histogram of gradient.

Transformation of HOG feature. HOG: histogram of gradient.
Recognition of AdaBoost classifier
Target vehicles are recognized using the improved HOG feature. The AdaBoost algorithm has better real-time performance, fewer parameters, lower complexity, and stronger generalization ability than artificial neural networks and support vector machines. 20
Experiments are conducted involving 2000 positive samples and 4000 negative samples. The samples are derived from results that do not contain AdaBoost classifier. These negative samples can improve the classifier, because mistakes may occur during image preprocessing. Negative samples are more important than positive samples during the training process of AdaBoost classifier algorithm. “Pure” negative samples and relevant images are downloaded from the Internet. The number of negative samples is established.
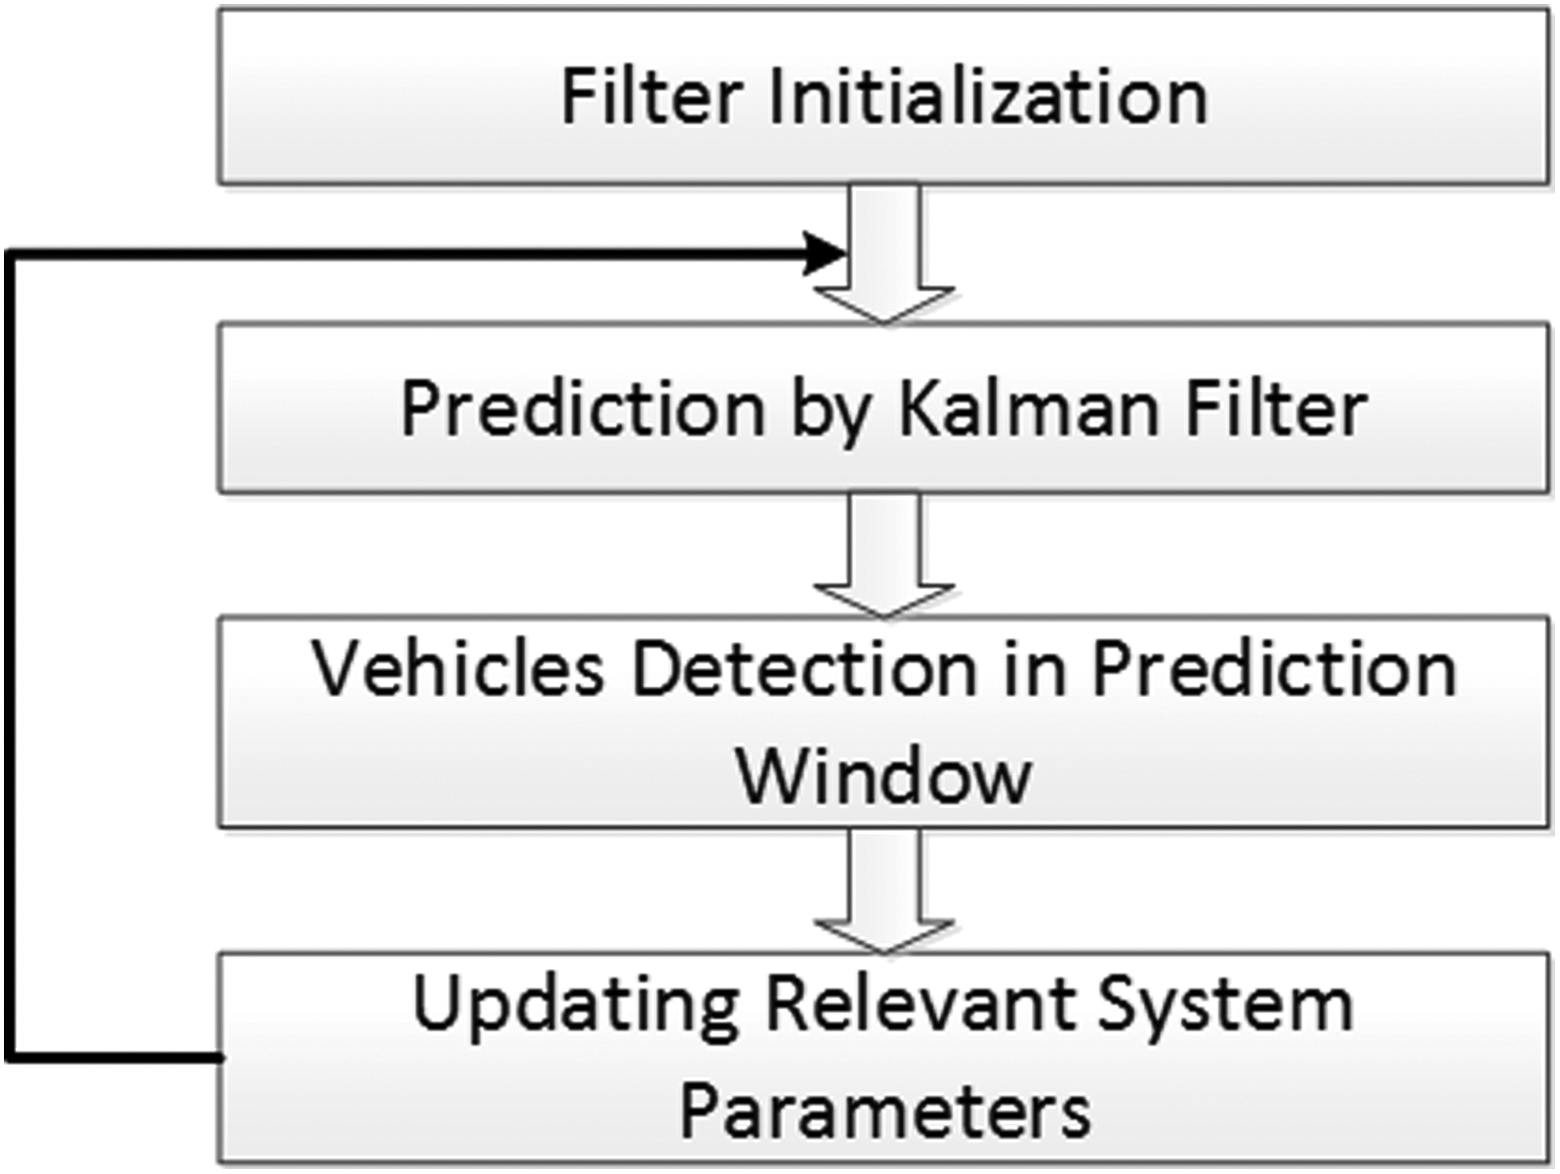
Target tracking
Video-based target tracking predicts the existence of the target, location, size, velocity, and other information of the detected location, size, and velocity of target vehicles from previous frames. Current video-based target tracking algorithm is divided into several categories, namely, feature-based tracking, 3-D model-based tracking, and region-based tracking methods. Feature-based tracking method involves simple computation. However, complex motions are not easily determined using this method. This method is also sensitive to noise during initialization. 21 The computation of 3-D models based on tracking algorithm is complicated, which leads to poor real-time performance. 22 Region-based tracking method relies on two dynamic and interactional systems, which capture state changes. This algorithm is not sensitive to obstruction and improves image segmentation. 23,24 Currently, the studies on obstacle detection and tracking mainly focus on computer vision, a wide range of approaches relies on the recursive update of tracks with the most recent detections. For instance, Kalman filtering is an efficient way to address multi-target tracking. 25,26 Vision-based object detection using deep learning method has been developed a lot, particle filtering can address some of the limitations of Kalman filtering by exploring multiple hypotheses. 27,28
Kalman filter is selected to improve the tracking algorithm. The Kalman filter is described by dynamic and observation equations, which facilitate prediction and automatic correction. The current state is predicted according to the characteristic of the moving object in the previous state regardless of the precise motion of the target. The next state of the moving object is then predicted. Computing the state transition equation of the Kalman filter requires accurate data to correct the estimated value of parameters. Historical data are not required. This process significantly reduced the storage and computation of the filter and ensured real-time performance. The Kalman filter overcame the mutual obstruction problem of target vehicles and reduced the uncertainty of measured noise. 6
The result of vehicle detection is the minimum window of the vehicle in the entire video frame or the ROI. The detection result in the whole image (large window) contained noise and involved complicated computation. Detecting the presence of the target vehicle in the tracking window is only required. The Kalman filter predicted the target with small tracking window and facilitated speed and precise location. The number of interesting vehicles in the scene is more than one. Thus, multiple target tracking is achieved.
Kalman motion model
The main tracking information in the current scene is the location, size, and speed of the target vehicle. The position of the target vehicle in the Kalman filter is represented by two-dimensional coordinates (x, y). Speed is expressed by (vx , vy ); thus, the state vector is expressed as X(k) = (x, y, vx , vy ) T . The position of the target vehicle is observed in the image. Thus, the observed value is defined as vector Z(k) = (x, y) T . In our experiment, the interval between adjacent video frames is only 1/25 s per frame. The vehicle speed is assumed as constant and the state transition matrix is

where Δt = tk − tk − 1

The observation matrix is obtained by the system and observation state. The Kalman motion model based on the scene is established. Figure 7 shows the specific steps of Kalman tracking.
Specific steps of Kalman tracking.
Multiple target tracking
The four states of a target vehicle are defined as active, tracked, lost, and inactive. If the target is detected in the first frame, the state is active. The target is then pushed into stack, which indicates that a new Kalman filter is needed for tracking. Specific steps of Kalman tracking are shown in Figure 7. If the target is tracked in the next frame, the state is set to “tracked” and the parameters of the Kalman filter are updated with the new observed values. If the target is missing in the predicted location, the state is set as “lost” and the parameters of the Kalman filter are updated continually.
If the target state in consecutive two video frames is lost, the state is set as “inactive” and the life of the target stops. Each Kalman filter corresponds to one target. The lifecycle and state of a Kalman filter are equal to one target. The parameters of Kalman filter are updated with the corresponding new observation. Lifecycle and state transition of detected and tracked objects are shown in Figure 8.

Lifecycle and state transition of detected and tracked objects.
Experiment results and analysis
Data set and evaluation parameters
Several videos are used to test the performance. Video sources include Toyota Motor Europe (http://cmp.felk.cvut.cz/data/motorway/) motorway vehicle database, a video shot in a structured road in Henan, Zhengzhou City, and another video shot in North Fourth Ring Freeway in Beijing. Positive samples include the back of vehicles selected from video frames, whereas negative samples include background regions recognized by mistake without machine learning recognition. These areas include vehicles with 4000 negative samples and 2000 positive samples. All samples are normalized to 64 × 64 pixels during training.
Our experiment obtained three results. (1) The first set includes the vehicles that were detected correctly. (2) The second set includes undetected vehicles, namely, missing vehicles. (3) The third set includes vehicles that were not detected correctly, namely, falsely detected vehicles. The performance is assessed according to the average scores of multiple tests. Four indicators are defined, namely, correct detection rate (detection rate), false detection rate (false rate), missing rate, and frame rate (video frames processed per second or fps)


where DP is the number of target vehicles detected correctly, NP is the number of all target vehicles that can be found in one frame, FP is the number of false detected target vehicles, T is the program operation time, and N is the total number of video frames processed.
Results analysis
The videos contain three scenes. Scene A shows the structured road in Zhengzhou City, scene B shows the structured road in Beijing City after rainfall, and scene C shows the North Fourth Ring Freeway in Beijing.
The apparent problem in the hypothesis is the high false detection rate, which is easy to recognize, because the detected objects are the potential targets obtained from the binary image. Shadows on the road cast by trees, buildings, and roadside signs led to a high false detection rate. However, the correct detection rate and frame rate are high. The two indicators proved the excellent performance of the target hypothesis algorithm, validity of the image segmentation process, and good real-time performance.
Compared with the scores in hypothesis phase, the scores in the detection and verification phases using AdaBoost classifier have more accurate detection rate, declining false detection rate, and smaller frame rate. The accuracy of AdaBoost classifier did not reach 100%. Thus, the number of correctly detected target vehicles decreased. The majority of falsely detected target vehicles are removed in the phase without recognition. The number of target vehicles slightly declined because of the AdaBoost classifier. The frame rate is decreased with the decreasing rate of correct detection and increasing rate of missed detection. False detection rate declined to meet the real-time requirement of the system.
The overall performance is improved when the target tracking phase is added to the Kalman filter. Without tracking, false targets are detected continuously, thereby increasing the number of falsely detected objects. Tracking decreased the number of the falsely detected target in the next frame. The decreased number of falsely detected targets enabled the detection system to explore front vehicles due to accurate detection of the near vehicle in front. This process improved the detection rate. Tracking improved the value of frame rate and diminished the search region, thereby computation load of detection is reduced. Before and after the detection and verification phases are shown in Figure 9.
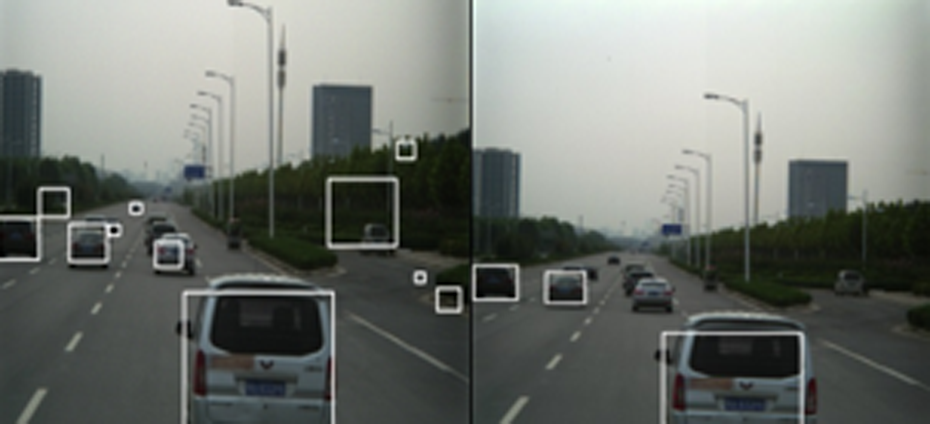
Before and after the detection and verification phases.
Scene C is the best target, whereas scene B is the worst target. Scene C is a test video that passed international standards. This video showed good environment, general illumination conditions, and pavement without abrupt changes, thereby significant results are provided. Scene B was shot after rainfall. Thus, this scene featured wet roads, weak reflections, and dark pavements, thereby difficulty in extracting road elements is increased. Moreover, pavement puddles are incorrectly detected as vehicles. The three scenes differed, but their detection results did not differ significantly. This finding suggested the robustness of the algorithm to outside environment with high detection rate at a frame rate of 16 fps. This result satisfied international standards and the requirements for practical application.
The performance of the detection and tracking algorithm is evaluated by the correct rate, that is, the performance of the algorithm is evaluated in terms of detection and tracking probability. For the detection and tracking of each frame in the detection and tracking sequence, the evaluation value Mi is

Then, the effective evaluation of target tracking and detection algorithms is presented
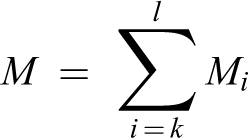
where k, l, and i are k, l, and i frames of image sequences.
According to the above evaluation method, compared to the DuEye’s accuracy rate of 92.65%, 29 the accuracy rate of the algorithm is 99.20%. Although the data set is inconsistent, the algorithm has an advantage in a specific situation.
Conclusion
This study investigated the vision-based front vehicle detection and tracking technology using driving videos on urban structured roads. This study predicted the next driving state of the front vehicle from the point of view of safe driving. ROI is selected during image segmentation using region growth method based on log operator. This method is used to compute the threshold. This method is resistant to interference from a complex environment. The back features of vehicles are extracted on ROIs during the detection and verification phases using HOG features. These features are classified by machine learning method to increase the correct detection rate. An object model is added to the tracking phase based on Kalman filter, which improved the overall performance of the model.
Footnotes
Authors’ contribution
X. Y. Zhang and H. B. Gao contributed equally to this work.
Declaration of conflicting interests
The author(s) declared no potential conflicts of interest with respect to the research, authorship, and/or publication of this article.
Funding
The author(s) disclosed receipt of the following financial support for the research, authorship, and/or publication of this article: This work was supported by the National High Technology Research and Development Program (“973” Program) of China under grant no. 2016YFB0100903, the Beijing Municipal Science and Technology Commission special major under grant nos D171100005017002 and D171100005117002, the National Natural Science Foundation of China under grant no. U1664263, the Junior Fellowships for Advanced Innovation Think-Tank Program of China Association for Science and Technology under grant no. DXB-ZKQN-2017-035, and the Project funded by China Postdoctoral Science Foundation under grant no. 2017M620765.