
Abstract
This article offers a new object recognition approach that gives high quality using synthetic aperture radar images. The approach includes image preprocessing, clustering and recognition stages. At the image preprocessing stage, we compute the mass centre of object images for better image matching. A conjugation index of a recognition vector is used as a distance function at clustering and recognition stages. We suggest a construction of the so-called support subspaces, which provide high recognition quality with a significant dimension reduction. The results of the experiments demonstrate that the proposed method provides higher recognition quality (97.8%) than such methods as support vector machine (95.9%), deep learning based on multilayer auto-encoder (96.6%) and adaptive boosting (96.1%). The proposed method is stable for objects processed from different angles.
Introduction
There is a growing interest in using synthetic aperture radar (SAR) images for object detection and recognition. It can be explained by the fact that in cloudy weather, the use of SAR gives better data of observed ground objects than visible, near-infrared and radar satellite data. 1 –3 For example, Defense Advanced Research Projects Agency (DARPA) obtained SAR images of ground targets in different poses, which contain the moving and stationary target acquisition and recognition (MSTAR) public release data set, 4 which many researchers use. 5 –15 In the majority of cases, they apply a double-stage approach for object recognition.
At the first stage, image preparation processing extracts features to form training and testing sets. Articles mainly describe two methods of typical image feature extraction: finding angles of target poses 7 and finding scattered centres of objects in the images. 8 Moreover, elliptical Fourier descriptors, 9 Zernike moments 10 and two-dimensional (2D) Discrete Fourier transform (DFT) coefficients 11 are also used as features invariant to object poses. The results and findings of MSTAR image segmentation using different principles were presented in articles by Gao et al. 12 and Zhang et al. 13 The principal component analysis (PCA) is frequently used in such studies as 7,11 to reduce feature space. For example, Sun et al. 11 reduce a feature space of 6400 to 150 features in a vector using PCA.
At the second stage, various recognition methods are widely used, such as using support vector machine (SVM), neural network, deep learning, adaptive boosting (AdaBoost) and so on. For example, Wang et al. 16 applied neural network algorithm for human posture recognition. SVM is the most popular recognition method. It is applied in optical, multispectral, hyperspectral image and LiDAR data classification. 17,18 In the works described above, 1 –3 SVM was applied for land-use classification of a set of satellite images. In the study by Liu and Feng, 19 faces were recognized using SVM with different kernel functions. For example, in the work by Qian et al., 20 a comparative analysis was carried out using four methods: SVM, normal Bayes, classification and regression tree and K-nearest neighbour. It was established that SVM provides higher classification accuracy compared to the other discussed methods. SVM is usually the best choice for quality classification. In the above work, a comparison was made of classification accuracy between SAR images and optical data using the SVM technique. 1 The availability of SVM explains its high classification quality. However, the authors indicate the main disadvantage of SVM, in that algorithm parameters need adjustment.
Another popular method is AdaBoost. Sun et al. 11 present the research results of object recognition quality by SAR images using AdaBoost algorithm with a radial basis function (RBF) network as the base learner. It has been shown that its recognition quality is between 5% and 10% higher on average than using SVM and a neural network algorithm. In the same study, 11 it is proved that the AdaBoost method 21 can successfully solve the recognition problem without prior object pose detection. This is an advantage for an object recognition system in real time. Nevertheless, with the aim of improving performance, the authors added the pose estimation algorithm to their system. The authors achieved a result of 99.6% correct recognition by training on seven models of three types. Besides, training only on three models (one model for each type), they achieved a result of correct recognition of 96.1%.
This study further develops the ideas of Zherdev and Fursov. 22 In addition, a proposed support plane method is viewed in case of subspaces that are formed by three and more vectors. The aim of this study is to test a new approach, which includes image preprocessing, clustering and object recognition stages. We chose MSTAR data set in order to compare our results with the results from other works. 7,11,15 The pixel-based features of SAR images are used in this study. We suppose that the proposed object recognition method can also work with other feature sets.
Analysing the literature in the field shows that the main problem in SAR image recognition consists of a priori ambiguity in conjunction with high sensitivity to changing an obtained object pose, an object shape, ground plane properties and so on. Therefore, there is a need to develop a method and an algorithm with less sensitivity to the changing pose of an obtained object. In this work, we suggest and examine a method based on the use of conjugation indices as a distance function and support subspaces.
The main objectives and formalization of conjugation index are explained in section ‘Problem statement’. Afterward, in section ‘Image preprocessing’, we discuss the image preprocessing procedure: deleting noise and estimating common centre of mass. Then, the clustering procedure based on computation of conjugation indices are given in section ‘Clustering and training set reduction’. Next, in section ‘Support subspace forming’, we give the detailed description of how to form the support subspaces for object recognition. The results of recognition experiments are brought in section ‘Experiment results’. Finally, potentials of proposed technology are summarized in section ‘Conclusion’.
Problem statement
In this work, we will use SAR images from MSTAR data set, which were obtained by an airborne radar in spotlight mode. These images have a resolution of 0.3 m × 0.3 m with horizontal-horizontal (HH) polarization. Figure 1(a) to (c) shows examples of SAR images of the corresponding ground targets from the MSTAR data set: tank, bmp, btr.

Using SAR images of (a) tank, (b) bmp and (c) btr. SAR: synthetic aperture radar.
Let a radar image with j index be established in relation to a feature vector, with a size of N × 1

and components each of a magnitude N = W × H pixels; here, W and H are the sizes of an image. Vectors are formed by scanning through lines or columns of images.
The vectors are used in the algorithm to estimate a conjugation index. In the study by Fursov, 23 the use of a conjugation index was offered. In the work by Fursov et al., 24,25 approach was shown to be effective for object recognition where patterns have significant variability in the class. In particular, in the articles by Kozin and Fursov 26 and Fursov and Kozin, 27,28 examples of successfully applying the distance function for face recognition were given. In the research by Fursov et al., 29 it was shown that the conjugation index allows a higher thematic classification quality of hyperspectral images than the well-known spectral angle method. 30
In the work done by Fursov,
23
a mathematic formalization of conjugation index estimation was given. Let K classes be specified and for each class of k index, a matrix

where feature vectors

are matrices of size N × M for whole possible (K) classes. To make a decision on distinguishing the vector between K classes, the conjugation index is calculated.
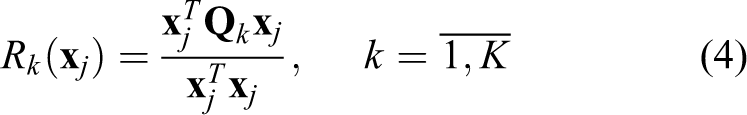
Take into consideration that vector

In the case of matrices
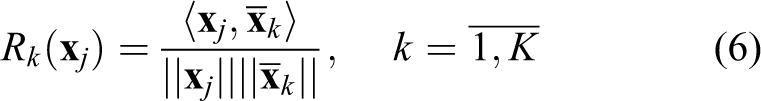
The average vector is used as a class member in equation (6), which can lead to essential information drop, when there are large variations in observing conditions. However, a large number of vectors are used in matrices calculation
It is important to forming matrices of class with minimum dimension from the training sets. These matrices preserve all information about a class. In this case, the issue is complicated, because the SAR image characteristics of objects appreciably depend on the observing mode. The observing mode is identified by a bearing angle, depression angle, ground surface properties and other factors.
Among the most important factors which influence recognition quality, Mossing and Ross 5 and Keydel 6 analyse the sensitivity of SAR images properties; for example, SAR image changeability in different target poses. Images or according vectors can have significant differences even within one model or one object. It can depend on unavoidable errors of positioning, medium property changeability and other conditions. This can lead to errors in the recognition process. Therefore, it is necessary to use a sufficiently large number of feature vectors for training.
The specified problems require an effective solution: to investigate the sensitivity of the described recognition method using the conjugation index as the distance function to change the observing object pose; to investigate which set of training data provides higher recognition quality and how to construct data sets with a minimal size that provide high recognition quality.
In addition, we answer the questions about image preprocessing approaches to compare the ability of those provided. We further shed light on the following compound parts of general technology: computing common centre mass for all images; clustering and reducing the number of training vectors; constructing support subspaces.
In the last section, we give the results of experiments using algorithms corresponding to the described stages. We review the results and give more detailed information on the raised objectives.
Image preprocessing
Image processing procedures enabling comparison have gained a pivotal role in recognition. The procedures should provide low sensitivity to dependence on the object pose in a SAR image, average brightness of image and so on, which is necessary for the responsible identification of distinctive properties. At the same time, the information about the object shape must be highlighted in the image.
In the present article, we compare the quality of offered technologies with results that were obtained in research by Sun et al. 11 Therefore, image preparation procedures were implemented on SAR images from the data set developed in the process of the DARPA experiments. In Figure 1(a) to (c), SAR image examples are presented for three objects, which were exported from the data set: tank, bmp and btr.
The data set for tank and bmp has images for three different models. In Table 1, SAR image data of the different object models are given. The SAR images were obtained from an airborne radar flying under two depression angles (15° and 17°). For both discussed depression angles, the bearing angle was changed in a range from 0° to 360°. As seen in the table, the full number of images, which can be used for training and testing the recognition algorithm, is 2987.
The MSTAR data set sizes.

MSTAR: moving and stationary target acquisition and recognition.
Sun et al. 11 bring all images to a common pose at image preprocessing stage. They determine rectangles for all images that cover the bright region corresponding to the object image in the SAR image. Then, all images are rotated so that all rectangles have the same direction as the pattern rectangle. This method works well on an extensive image with a clear border. If the extent and shape of the object image strongly depends on pose, this approach can make different errors, both at the training and testing stages.
We offer another way of comparing images that were obtained using different poses. We clustered a model in one class to subclasses. High proximity of vectors within the subclasses is provided using the specified distance function. However, we need to provide conditions of compared images of different classes and subclasses. These conditions, on the one hand, reduce the impact of image shift on the training and recognition process. On the other hand, it is necessary to provide high sensitivity to differences in object image shapes.
In order to provide these conditions, we prepare image regions with highest signal intensity (brightness) to the common centre of mass. We introduce thresholding procedure for noise impact exception on an object centre of mass location in different observation series. Notice that, in respect of object distinction in the SAR image, the radar shadow shape has important information. A radar shadow is highly dependent on the observation direction. It is an obstacle in the centring process. Thereby, by thresholding, we separately allocate the brightest areas of the object image, which are used for image centring. Furthermore, we find the threshold of the shadow areas.
We give the finding procedures of two thresholds: one for the shadow and another for the object. Before finding the thresholds, the image is smoothed to reduce the noise impact in the image (speckle, thermal noise of radar, etc.). We used the same method of smoothing that Kottke et al. 31 used. Two steps are used to carry out smoothing: the image is down sampled four times, and then it is up sampled to instance size using linear interpolation. Figure 2(a) gives an example of a SAR image histogram of bmp. Figure 2(b) shows a histogram of the same image after the smoothing process.

(a) Histogram of initial bmp SAR image and (b) threshold finding on histogram of a smoothed image. SAR: synthetic aperture radar.
We used a triangle method for thresholding
32
to find a threshold on the histogram of a smoothed image. In this method, first, a point corresponding to a maximum of the histogram is estimated. Then the threshold for the bright image area on the right side from maximum point
The results describing the double threshold image processing are presented in Figure 3. The smoothed image in Figure 3(a) is the same as the histogram shown in Figure 2(b). Figure 3(b) shows a separated bright area of scattered signal (white), while Figure 3(c) presents a separated area of radar shadow. Figure 3(b) and (c) emphasized the areas of background (ground surface) which are shown in black. As can be seen on the black background area, unfortunately, there are white spots which indicate the source is from different noise.

Results of image preprocessing: (a) smoothed image, (b) object and (c) shadow.
The image preprocessing was used for all images from the data set. We computed the average image using a binary object and shadow images (0 is the value of black brightness, 255 is the white region brightness). It is evident that average images have a pixel value ranging from 0 to 255. Image averaging also allows to delete noise at a significant rate. A noise reducing process was applied to the object and shadow images with average binary masks (Figures 4(b) and 3(c)).

Averaging areas (a) of object, (b) of shadow.
Noise can be reduced by scanning with different sized windows. The results are shown in Figure 4. Image averaging process leads to finding the rectangle border that includes the image of an object and a shadow in all data set images. Image examples with average areas of object and shadow binary masks are presented in Figure 5(a) and (b).

Results of image filtering (a) object, (b) shadow image.
The bright areas (Figure 5(a)), corresponding to the object in the SAR images, are estimated to be the centre of mass locations. Here binary image centres of mass can be computed by the following equation
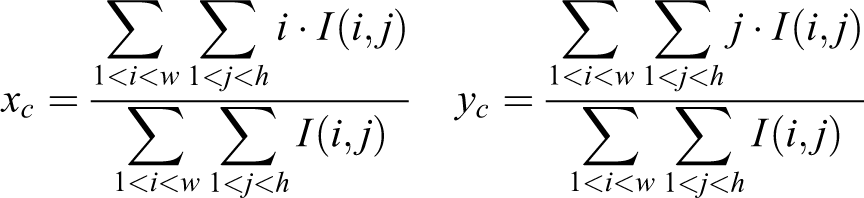
in which i, j are the positions of pixels in the image and

Image of btr (a) before and (b) after image preprocessing.
A covering rectangle is formed for the binary mask of the averaged image, which matches the centre of mass with the centres of mass of all images. Areas out of bounds from the rectangle are removed from each centred image of the data set. A data set of minimal sized images is constructed, on which complete areas of object and shadow images exist. An example of such an image is presented in Figure 6(b).
We highlighted that presented technology realizes automated image preprocessing of SAR images. The technology of image preprocessing has significant difference at the centres of mass of bright backscatter finding. As a result, this technology provides localization of an object and deleting an object outside area. The effectiveness of this technology is proved by the high recognition quality presented in section ‘Experiment results’.
Clustering and training set reduction
Clustering and reducing training sets can be the last stage of image preprocessing. This stage is not specifically required and is implemented only if necessary. However, in order to improve recognition quality, we propose the clustering procedure, which allows to increase image matching into subclasses. We examine clustering algorithms since they are used in the following experiments.
We use the same procedure as was used by Fursov et al. 29 for thematic classification of hyperspectral images. In the first step, from the whole set, for example, M vectors, two are chosen (let us label them as x1, xM) as the most remote vectors, with minimal normalized correlation rate value.
In this case, for initial vectors x1, xM, it is possible to use a priori information about a pose in which objects are observed. Specifically, since the pose of the objects on images changes in the range from 0° to 360°, any two vectors can be accepted as initial vectors corresponding to highly different bearing angles.
The algorithm is used in the same way as was used by Fursov et al. 29 Vectors (x2, xM − 1) are joined to the remaining vectors of an initial set for which the expressions


obtain maximal values. Pairs of vectors x1, x2 and xM − 1, xM
As a result, two matrices of sizes N × (M/2) are formed, corresponding to two subclasses. For example, we suggest that M is an even number. Clustering of each subclasses can obtain four or more subclasses. In recognition, the vector that is nearest in the sense of the decision-making rule (equation (5)) to one of the subclasses is considered as belonging to the initial class of the subclass.
If the initial vector count, available for training, remains large even after clustering, matrices
Let S be a number of training vectors in an initial set of k class. A conjugacy index of S count is measured for all

where

is excluded from the index k class.
The procedure described is repeated for all the classes,
The described technology is based on the following reasoning. As a result of excluding vectors that have a maximum of conjugacy index, the remaining vectors form borders between classes. Therefore, recognition is implemented using equation (5), as it is evident that vectors within this border will be recognized successfully. In many cases, the vectors located close to this border will also be recognized. In section ‘Experiment results’, we give experiment results which prove that excluding vectors with equation (10) show better recognition quality.
Finally, we notice that demonstrated procedure of clustering is unrelated to the scheme, which is described in the following section. Further description about the method of support subspace forming works well with initial classes and their subclasses. Therefore, we will not make distinction between classes and subclasses, and everywhere refer to them as classes.
Support subspace forming
In this section, we describe how to find the most informative sets of vectors in each class and/or subclass formed from the training data set. We call the subspaces formed by these vectors as ‘support’. Let us consider the procedure of constructing the support subspaces in terms of binary classification. To make a decision on distinguishing vectors, it is necessary to form a subspaces pair, which belongs to these classes.
Let us suppose that for both classes, appropriate matrices
The number of vectors forming the matrices in pairs can be different. However, an exhaustive search of all possible combinations of subspace dimensions in pairs requires large computational resources. For example, the number of different combinations for 10 vectors in each class proves to be more than 106. Therefore, we are limited by cases when the subspace dimension d in each pair of support subspace is equal.
To emphasize that matrices

We assume that class contains M vectors. Therefore, the set, which includes all possible dimensions, contains M − 2 integers:

For pair matrices

where

and n is a general number of correctly recognized vectors from the training set using the matrices in equation (14).
Thus, we have the following assumptions for two specified classes: D is a set of permitted dimensions of the subspaces in equation (12); the equation (13) is the quality rate.
In the training set, among all possible pairs of matrices (subspaces) formed on the set for constant d ∈ D

it is necessary to find out the pair of subspaces (matrices)

where
Now we discuss the algorithm of support space construction with constant dimension d. In accordance with equation (15), the algorithm is realized by the following steps. For two specified class indices, k, l are formed as an initial pair of support subspaces (
Therefore, the algorithm searches all possible pairs of combinations of training matrices. In the results that can be obtained, there may be either one best pair of matrices by rate (equation (13)) or a set of matrices pairs having the same rate values (equation (13)). At the last stage for constant d, the best pair of support subspaces is chosen.
Consider the solution to the problem of finding the best pair of support subspaces. For clarity, let us assume that at the previous stage for two classes, P pairs of subspaces
Let


be the conjugation indices of the support subspaces with 

Inequality in equation (17) sets a limit on vector usage with a higher conjugation index value at its own class than at another class. The pairs of subspaces
The essence of equation (16) is similar to SVM conception, in which the distance between the nearest placed vectors from different classes is maximized. In this case, the best support subspaces pair is chosen so that the conjugation index is higher for vectors having minimal conjugation indices with both classes. In other words, the best pair of subspaces is determined for the worst pair of vectors.
This construction of the support subspaces method was developed based on a binary recognition problem. The recognition algorithm is developed by a one-to-one approach. The decision about vector distinguishing between classes is given by voting between them. 21 The vote is joined to the class in binary recognition using a decision-making rule (equation (5)).
Let us add vote if, in an episode of binary classification, the conjugation index of the current vector with subspace representing the current class turns out to be higher than with another class. Some distribution of class votes is organized as a result of such a procedure under the whole K(K − 1)/2 pairs of classes. The current vector belongs to the class that has gained the highest number of votes.
Experiment results
In experiments, we solved the recognition problems by the SAR images of three types of objects. As mentioned above, the SAR images are from a data set that was obtained in the DARPA experiments. The information on the size of the data set was presented in Table 1. Following the work by Sun et al., 11 training was carried out on the following models: sn_c71, sn_c21 and sn_132. The training and testing sets were obtained under 17° and 15° angle of depression, respectively. Note that we purposely carried out experiments under the same conditions as are used in the research articles. 7,11,15 We can conclude that the results, which are shown in this section, are comparable with results obtained in the work by Zhao et al. 7 and Sun et al. 11,15
In the work by Xing et al., 14 it is shown that sparse representation method reached the average result on the same data set of 98.6%. However, we do not use the result obtained by Xing et al. 14 for comparison, because in the experiments of recognition, authors used a priori information at the training stage, that is not considered as the real-time recognition scenario. For the estimation of sparse vector coefficients, they used vectors from testing set. In the real-time scenario, a test set generally is unknown; therefore, we do not use testing vectors at the training stage.
In our experiments, SAR images are formed as vectors as it was described in section ‘Problem statement’. A vector is constructed by pixel values of a 2D image scanned by lines. In each experiment, image preprocessing is implemented in accordance with the described approach in section ‘Image preprocessing’. Classes, corresponding to a set of one-model vector, are divided into subclasses to provide greater ‘similarity’ of vectors.
Support subspaces are formed for all K(K − 1)/2 pairs of classes in the training process, where K is a common number of classes with respect to clustering. The algorithm of multi-class recognition is realized in one-to-one approach. Two series of experiments are performed by implementing a training and recognition scheme as described previously. We studied the sensitivity to the object pose changing in the first series of experiments.
In Table 2, comparative results of recognition quality using the conjugation index method (CIM) and SVM are shown. In this experiment, the decision about class recognition is measured using a full training set, without using the support subspace. The results in Table 2 show that CIM is stable to object pose changing. It is emphasized by the fact that recognition quality with two to eight subclasses is equal. As it can be seen, the recognition quality of SVM is more sensitive to object pose change. At the same time, even though in SVM the recognition quality is raised when the number of clusters is increased, the CIM showed better quality.
Recognition results using CIM and SVM.

CIM: conjugation index method; SVM: support vector machine.
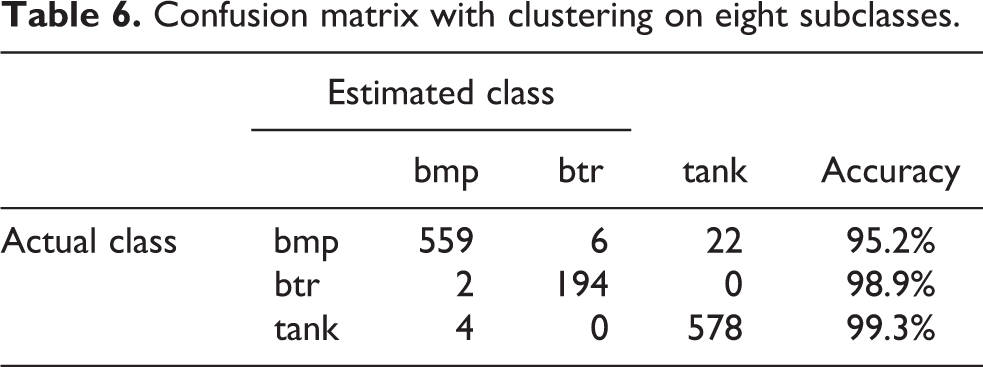
Tables 3 to 7 show confusion matrices with more explicit information on the results of object recognition. There are results of recognition using CIM with different numbers of subclasses. We have a better result than that shown by Sun et al., 11 although some of the feature vectors from the testing set, about 10% of non-appropriate vectors, were removed. Our method works better without removing non-appropriate vectors.
Confusion matrix without clustering.

Confusion matrix with clustering on two subclasses.

Confusion matrix with clustering on four subclasses.

Confusion matrix with clustering on eight subclasses.
Confusion matrix with clustering on 16 subclasses.

In Figure 7, graphs of recognition quality change depending on the number of training vectors in each class. The training set was taken with clustering on 16 subclasses. Thus, in one subclass, the vector count is 14. The training sets are consecutively reduced by removing vectors using the equation (9). Curve 1 conforms to the case when the decision rule (equation (10)) is maximum, and curve 2 is the case of a minimum in the decision rule (equation (10)). Notice that recognition quality is found to be higher (curve 1) when removing vectors that have a maximum conjugation index with their own class (equation (10)). This result explains the effect of low sensitivity of CIM to object pose changing when all training vectors were used. We save information about the most remote vectors from their own classes by removing the vectors with ‘good’ conjugation indices.

Graphs of recognition quality depending on the number of training vectors.
The second series of experiments is carried out with the aim of answering the second question, whether we can have the formation of small training data sets without significant loss of recognition quality. In other words, the performance of the support subspace method is checked. The following experiments were carried out with clustering on 16 subclasses using the algorithm described in section ‘Image preprocessing’ with equations (7) to (10). Since training is released on three models, these are obtained under a depression angle of 15°. The complete value of the training class is 48, and 14 images are in each class.
In Figure 8, the results of recognition measured using support subspaces of different sizes are presented. In that the recognition result of SVM for comparison (dotted curve 4) is given. The SVM algorithm was trained on the same training set including 48 classes, formed by the approach described above. Notice that SVM results are found nearest to the published results of Sun et al. 11 Curve 3 in Figure 8 is the same for given curve 1 in Figure 7.

Graphs of recognition quality depending on support subspace dimension.
Curves 1 (dotted) and 2 (solid) show the recognition quality change using support subspaces of different dimensions. Curve 1 is obtained by forming support subspaces from the initial training vector set. Curve 2 is obtained by prior removal from all classes by four training vectors in such a way that equation (10) was used as maximum.
A comparison of the curves confirms once more that removing vectors of a training set with maximum conjugation index leads to a smaller loss of set informativeness. This effect impacts so that with an increase in support subspaces dimension, the recognition quality on the whole decreases, but sensitivity to object pose changing increases.
We give the comparison with other results obtained on the same data set with recognition and training on the same models. The recognition results were compared to the results of four other methods: SVM shows a recognition result of 94.8%, neural network of 94.0%, template matching methods of 89.7% and that described in article by Zhao et al. 7 According to Sun et al., 11 result of correct recognition quality is 96.1%, obtained using AdaBoost with RBF method. Trained using the same MSTAR data set, the deep learning algorithm based on the multilayer auto-encoder model shows the result of 96.6% correct recognitions. 15
The obtained results need to be analysed in details. Zhao et al. 7 and Sun et al. 11 estimated the poses of objects on SAR images and bring all images to common pose. In section ‘Image preprocessing’, it was mentioned that this can lead to errors in recognition. Our approach of automatic identification of object mass centre and clustering process shows good influence on the effectiveness of further recognition. At the recognition step, we developed a new support subspaces method, which ideologically is similar to SVM. Using training vectors, we construct a subspace that is similar to support vectors of SVM. The other similarity, which was explained in section ‘Support subspace forming’, we find best pairs of subspaces called support using equation (16).
As expected of this study, recognition quality falls when the number of subclasses decreases. In addition, the percentage of correct recognition using support planes (subspaces with dimension d = 2) is rather low (from 81.3% without clustering to 95.6% with clustering on 16 subclasses that are higher than using SVM). In this work, the success result reached 97.8% of correct recognitions using the support subspaces method with subspaces dimension equal to 9 (curve 1 in Figure 8) and a training set clustering by 16 subclasses. This result is higher than results obtained in other compared works.
Conclusion
In this study, we have offered a new object recognition technology using SAR images. We discussed all the principal stages: image preprocessing, clustering and object recognition. Image preprocessing of different objects in the SAR image set includes reducing noise and finding a bright area centre for better image matching. The results of the proposed object recognition technology show that the proposed stage is effective. The offered clustering procedure allows dividing one class, which includes an object obtained under different aspect angles. We have shown that our clustering procedure leads to an increase in object recognition quality. The results of the experiments show that clustering is necessary if object images into one class have significant difference with object poses. The main intention of the study is construction of recognition algorithms based on using a conjugation index as a distance function.
Firstly, method that uses full set of training vectors for recognition (CIM) is constructed. We have shown that CIM is less sensitive to object pose changing and have higher recognition quality than SVM and deep learning based on multilayer auto-encoder model.
Finally, we improved CIM method by constructing the training algorithm of the support subspaces method. The support subspaces method has shown good results. In particular, subspaces with dimension between 6 and 13 vectors have shown a better recognition quality rate than using CIM. Sensitivity of the recognition algorithm depending on object poses increases when support subspaces dimension is reduced. At the same time, recognition quality comparable to the quality of CIM is achieved. Furthermore, it shows that full matrices of classes can be reduced without essential recognition quality lose using the support subspaces. This procedure is necessary for decreasing the algorithm computational complexity.
The support subspaces method consists of forming the best, in the sense of recognition quality, subspaces of a small dimension, including training vectors ‘at the border’ of the class. The advantage of the support subspaces method is adjusting of algorithm. Moreover, it involves algorithm retraining as in neural network.
The obtained results are encouraging for future research. The method showed good results in the recognition task of SAR images with a strong shape changeability. We emphasize that proposed method is stable for recognition of objects observed under different aspect angles. It is benefit for the real-time operating system that the proposed technology can be made automatic. The specified properties are important in the radar remote sensing system construction. Suggested approach can be applied for recognition of different objects.
Footnotes
Acknowledgement
The publication is realized in the framework of the Ministry of Education and Science of Russian Federation.
Declaration of conflicting interests
The author(s) declared no potential conflicts of interest with respect to the research, authorship and/or publication of this article.
Funding
The author(s) received no financial support for the research, authorship and/or publication of this article.