
Abstract
Mobile robots frequently navigate through corridor environments. When implementing graph Simultaneous Localization and Mapping in a corridor environment, it is important to construct a precise pose graph. However, scan matching fails owing to the lack of features, resulting in false edges. To address the false edges issue, we propose a Validation Grid Map Network (VGM-Net) as a Convolutional Neural Network (CNN) based approach to enhance the robustness of scan matching validation. We suggested the VGM based on the Gaussian model to be used as input data for VGM-Net. In our approach, the VGM provides a grid-based Gaussian representation of raw light detection and ranging data, effectively capturing the spatial clustering and key geometric features that are essential for reliable scan matching. This enhanced representation not only preserves critical structural information but also enables efficient feature extraction within the CNN framework. This results in improved discrimination between valid and erroneous scan matches. The VGM transforms previous and current scan data into a grid map based on a Gaussian model. The VGM is computed by combining the hit ratio with the Gaussian-modeled grid map. The VGM-Net classifies scan matching failures with high accuracy by learning situations in scan matching failures and successes. We evaluated the rejection performance accuracy for false edges using an open data set and the scan data measured in a practical corridor environment. We carried out experiments in a real environment to show the performance of the VGM-Net. The experimental results demonstrate the robustness of the proposed VGM-Net approach.
Introduction
Indoor mobile robots are now being employed in diverse settings, such as warehouses, industries, and ports, while autonomous vehicles face similar navigation challenges in outdoor traffic environments. 1 Maps play a crucial role in facilitating autonomous navigation in both domains, which necessitates the use of Simultaneous Localization and Mapping (SLAM) for generating maps. There are studies2,3 that update maps when the environment has changed over the long term. Other research4,5 focuses on tracking and mapping in the environment with numerous dynamic obstacles. The purpose of SLAM is to obtain accurate maps that are representative of the environment.
The SLAM methods6–10 are widely used in robotics and computer vision for simultaneously estimating the location of a robot or vehicle 11 and constructing a map of its surroundings, particularly in places that are unfamiliar or unknown. In recent times, researchers have investigated SLAM extensively by using graph-based methodologies.12–14 Recent advances in multisensor fusion have significantly improved SLAM robustness, particularly through tightly coupled approaches such as LIO-SAM 15 and LVI-SAM, 16 which integrate light detection and ranging (LiDAR), visual, and inertial sensors to achieve superior performance in challenging environments.
However, in indoor corridor environments where distinctive features are sparse, conventional scan matching often yields false edges due to the accumulation of failed matches or missing edges caused by local minima. To overcome these challenges, we propose a robust front-end validation procedure that incorporates the Validation Grid Map (VGM) method. The VGM is a grid-based Gaussian representation of 2D LiDAR data that focuses on spatial clustering and preserves critical geometric information. Constructing the front-end by applying scan matching in an indoor environment becomes challenging when the results of Graph SLAM fail owing to storage of failed scan matching edges or the storage of missing edges in the local minimum. Hence, it is important to construct a robust front-end for the validation procedure. Odometry data are required to construct the front-end.
To obtain accurate odometry data, the LIDAR scan matching method is mainly used. Accurate odometry data help construct a robust front-end. By optimizing the front-end graph with the methods of the back-end, it is possible to obtain accurate maps.
The Normal Distributions Transform (NDT)17,18 and Iterative Closest Point (ICP)19–21 methods have been investigated for obtaining precise LiDAR odometry data. To obtain accurate odometry data, a Gaussian model was used in conjunction with the NDT method to represent registered scan data. This modeling approach aimed to maximize the score function along the desired direction. While these Gaussian-based methods have proven effective for odometry estimation, they do not directly address the challenge of validating scan matching results in feature–sparse environments.
The ICP algorithm searches for point pairs by calculating the closest distance and, subsequently, calculates odometry data by minimizing the objective function along the optimal direction. The approach of rejecting outlier points at the nearest point was adopted to realize robust odometry, as described in Jo and Moon. 22 The generalized ICP algorithm, which was proposed in Segal et al., 23 was demonstrated to be robust owing to its utilization of a point-to-plane approach. TrICP 24 utilized rearranged point pairs in ascending order in the point matching stage to achieve robustness. In recent years, Kiss-ICP, which includes a motion compensation method and a subsampling scheme, 25 has been adapted to various real-world environments.
However, scan matching does not always ensure success. Outlier constraints are crucial to optimizing the factor graph. The lack of a validation process during the construction of the factor graph might fail the optimized factor graph. During the construction of the front-end of Graph SLAM, the presence of false-positive (FP) constraints leads to a distorted map in the back-end of Graph SLAM. The topology of the factor graph of the switchable constraint approach 26 is applied to obtain robustness against outlier edges. The Max mixture model 27 ensures robustness by characterizing the outlier of edges as non-Gaussian behavior. The GTk intermediate layer system was proposed by GraphThinker 28 to eliminate outlier constraints. The SubMap matching approach 29 is validated twice using the remove dynamic objects method and unique factor graph structure that accounts for initialization bias and employs an advanced algorithm, which enhances the robustness of Graph SLAM. The Graph-Cut RANdom SAmple Consensus method 30 for identifying and eliminating outliers is characterized by low computational cost and limited complexity.
The validation system of scan matching results, one of the edge validations, involves determining the outcome of scan matching and, subsequently, organizing it into edges. Although the scan matching validation system is simple, it performs consistently, especially when used with a laser sensor. To validate scan matching, the ICP covariance matrix was computed using the point-as-landmarks approach. 31 In another study, the performance of scan matching was analyzed by focusing on the features of point clouds. 32 That study examined the effects of many factors on the performance of scan matching, including overlap ratio, distance, angle, and noise of points. Recent comprehensive surveys on 3D LiDAR SLAM 33 have highlighted the critical importance of robust validation mechanisms in maintaining system reliability across diverse environmental conditions. In recent years, deep-learning-based SLAM has increasingly attracted researchers attention.34–36 Several researchers have approached the scan matching validation challenge in graph SLAM as a classification problem.
In He et al., 37 a Convolutional Neural Network (CNN) was used to effectively address the categorization problem with a notable level of accuracy. The CNN has demonstrated remarkable efficacy in many applications. However, it is challenging to integrate laser sensor datasets with CNN because the endeavor leads to the disorder problem. In Jeong and Lee, 38 scan matching methods were utilized to address unordered problems by training the result of scan matching on plot images. Subsequently, a validation process was executed to assess the effectiveness of this approach. As a result, it was possible to store LIDAR registration data and transform scan data as RGB image data, a straightforward and precise approach.
Recent advances in deep learning–based loop closure detection 39 have demonstrated the effectiveness of neural networks in handling challenging environmental conditions, including illumination changes and dynamic objects, which traditional methods struggle to address. However, RGB images of scan data are distorted when SLAM is executed in a corridor environment. The limitations of this approach are its dependence on the plot's viewpoint and its sensitivity to option parameter settings. In the presence of unstable picture data obtained under varying environmental conditions, network optimization is challenging, and the efficacy of scan matching validation is affected adversely.
Furthermore, emerging graph neural network–based approaches 40 has shown promising results in addressing spatial consistency verification for SLAM applications, particularly in complex indoor environments where traditional feature-based methods often fail. To realize robust Graph SLAM, reliable preprocessing of scan data is imperative, even during operation in corridor environments.
To enhance the robustness of graph SLAM, we propose the VGM-Net to validate the scan matching results. Existing validation methods face significant challenges in corridor environments, particularly when dealing with feature–sparse conditions and measurement uncertainties. Traditional RGB-based approaches suffer from viewpoint dependency and parameter sensitivity, while conventional grid-based methods often lose critical geometric information through binary discretization. Our approach addresses these fundamental limitations through a novel probabilistic framework that preserves the inherent uncertainty characteristics of LiDAR measurements.
Unlike the previous method, 38 which converts LiDAR data into RGB images and suffers from viewpoint dependency in corridor environments, we introduce a novel VGM based on a Gaussian model that preserves the probabilistic nature of LiDAR measurements and spatial clustering information. Our VGM transforms raw 2D laser scan data into a grid-based Gaussian representation that effectively captures essential geometric features while reducing data dimensionality through a specialized convolutional layer for enhanced computational efficiency. The main contributions include (1) a novel Gaussian-based grid representation that handles LiDAR measurement uncertainty, (2) a CNN architecture designed for probabilistic grid data, and (3) experimental validation in challenging corridor environments. While this study focuses on indoor mobile robot applications, the proposed validation approach is applicable to autonomous driving systems, where accurate scan matching validation is equally critical for reliable localization and safe navigation in complex traffic environments.
The remainder of the study is structured as follows. In “Graph SLAM using VGM-Net” and “Validation scheme with VGM and VGM-NET” sections, we explain the application of VGM-Net to Graph SLAM and the proposed VGM-Net and Input data VGM. In “Experiments and results” section, the proposed validation system is compared to the existing validation system based on a neural network scheme by carrying out a series of experiments. Finally, we review the results and summarize them in “Conclusion” section.
Graph SLAM using VGM-Net
The graph SLAM without a validation method has the problem of inaccurately posing the graph. False pose graph hinders optimization in back-end. The scan matching validation method distinguishes between successes and failures in scan registration by comparing current scan data with previous data.
Failures of scan matching are caused by error function problems and local minima. Scan matching failures due to error functions result in no matching of points. In Xie et al., 28 the robustness of SLAM was enhanced by determining scan matching failures caused by the error function problem. Scan matching failure by a local minimum represents a state where a subset of points is not matched. Local failures due to local minima lead to a situation in which the back-end is not optimized, and the mapping process fails with the accumulation of errors.
Figure 1 illustrates the comprehensive framework of the proposed VGM-Net validation system integrated with Graph SLAM. The framework operates through a sequential pipeline that begins with LiDAR sensor data acquisition, where consecutive scan frames are captured for processing. The raw scan data undergo scan matching to establish point correspondences between the previous and current frames, generating matched point pairs that serve as input for the subsequent validation process.

Graph SLAM framework with VGM-Net.
The VGM generation stage transforms the matched point data into a VGM representation. Unlike conventional approaches, the VGM preserves the probabilistic characteristics of LiDAR measurements by encoding spatial clustering information and geometric features through Gaussian distributions. This probabilistic representation effectively captures the inherent uncertainty in sensor measurements, which is particularly crucial in feature–sparse corridor environments.
The generated VGM serves as input to VGM-Net, a specially designed CNN architecture that performs binary classification to determine scan matching validity. The VGM-Net leverages the probabilistic information encoded in the VGM to distinguish between successful and failed scan matching results with high accuracy. The network identifies not only complete matching failures but also detects subtle local failures that conventional validation methods often miss.
Based on the VGM-Net classification result, the framework follows two distinct paths. Valid scan matching results are integrated into the Graph SLAM frontend as reliable edges, contributing to robust pose graph construction and subsequent backend optimization. Conversely, invalid matches are immediately discarded, preventing the accumulation of erroneous constraints that would otherwise degrade mapping accuracy. This selective validation mechanism significantly enhances the overall robustness of the Graph SLAM system, particularly in challenging indoor environments where traditional scan matching methods frequently fail.
Validation scheme with VGM and VGM-NET
Validation grid map
In this section, we describe how to transform the continuous scan data into a Gaussian distribution in the grid. This transformation enables the preservation of spatial clustering and the inherent uncertainty of LiDAR measurements, providing a more informative representation than traditional occupancy models. The Occupancy Grid Map (OGM) 41 defines each grid state that is calculated by scan data. Grid states are determined by threshold probability value.
In contrast, instead of using an occupancy threshold, our VGM approach differs from traditional methods through its probabilistic foundation. The advantage of VGM over OGM lies in its probabilistic representation of spatial uncertainty. While OGM uses binary or discrete probability values that may lose critical geometric information, VGM preserves the continuous distribution of LiDAR measurements. In corridor environments, scan matching failures often occur due to insufficient geometric features causing ambiguous correspondences, noise in LiDAR measurements creating uncertainty in point locations, and repetitive structures leading to multiple local minima.
The VGM addresses these issues by encoding measurement uncertainty through Gaussian parameters, preserving spatial clustering information that indicates feature density, and maintaining geometric relationships between consecutive scans. The mathematical distinction is significant. For a grid cell containing LiDAR points, OGM assigns a discrete probability based on the ratio of hits to total rays, which essentially quantizes spatial information. In contrast, VGM computes a continuous Gaussian distribution where the mean represents the central tendency of measurements, and the covariance captures the spatial spread. This Gaussian representation captures both the central tendency and spread of measurements, providing richer information for scan matching validation that better reflects the inherent uncertainty in sensor measurements.
A set of data points Z, such that
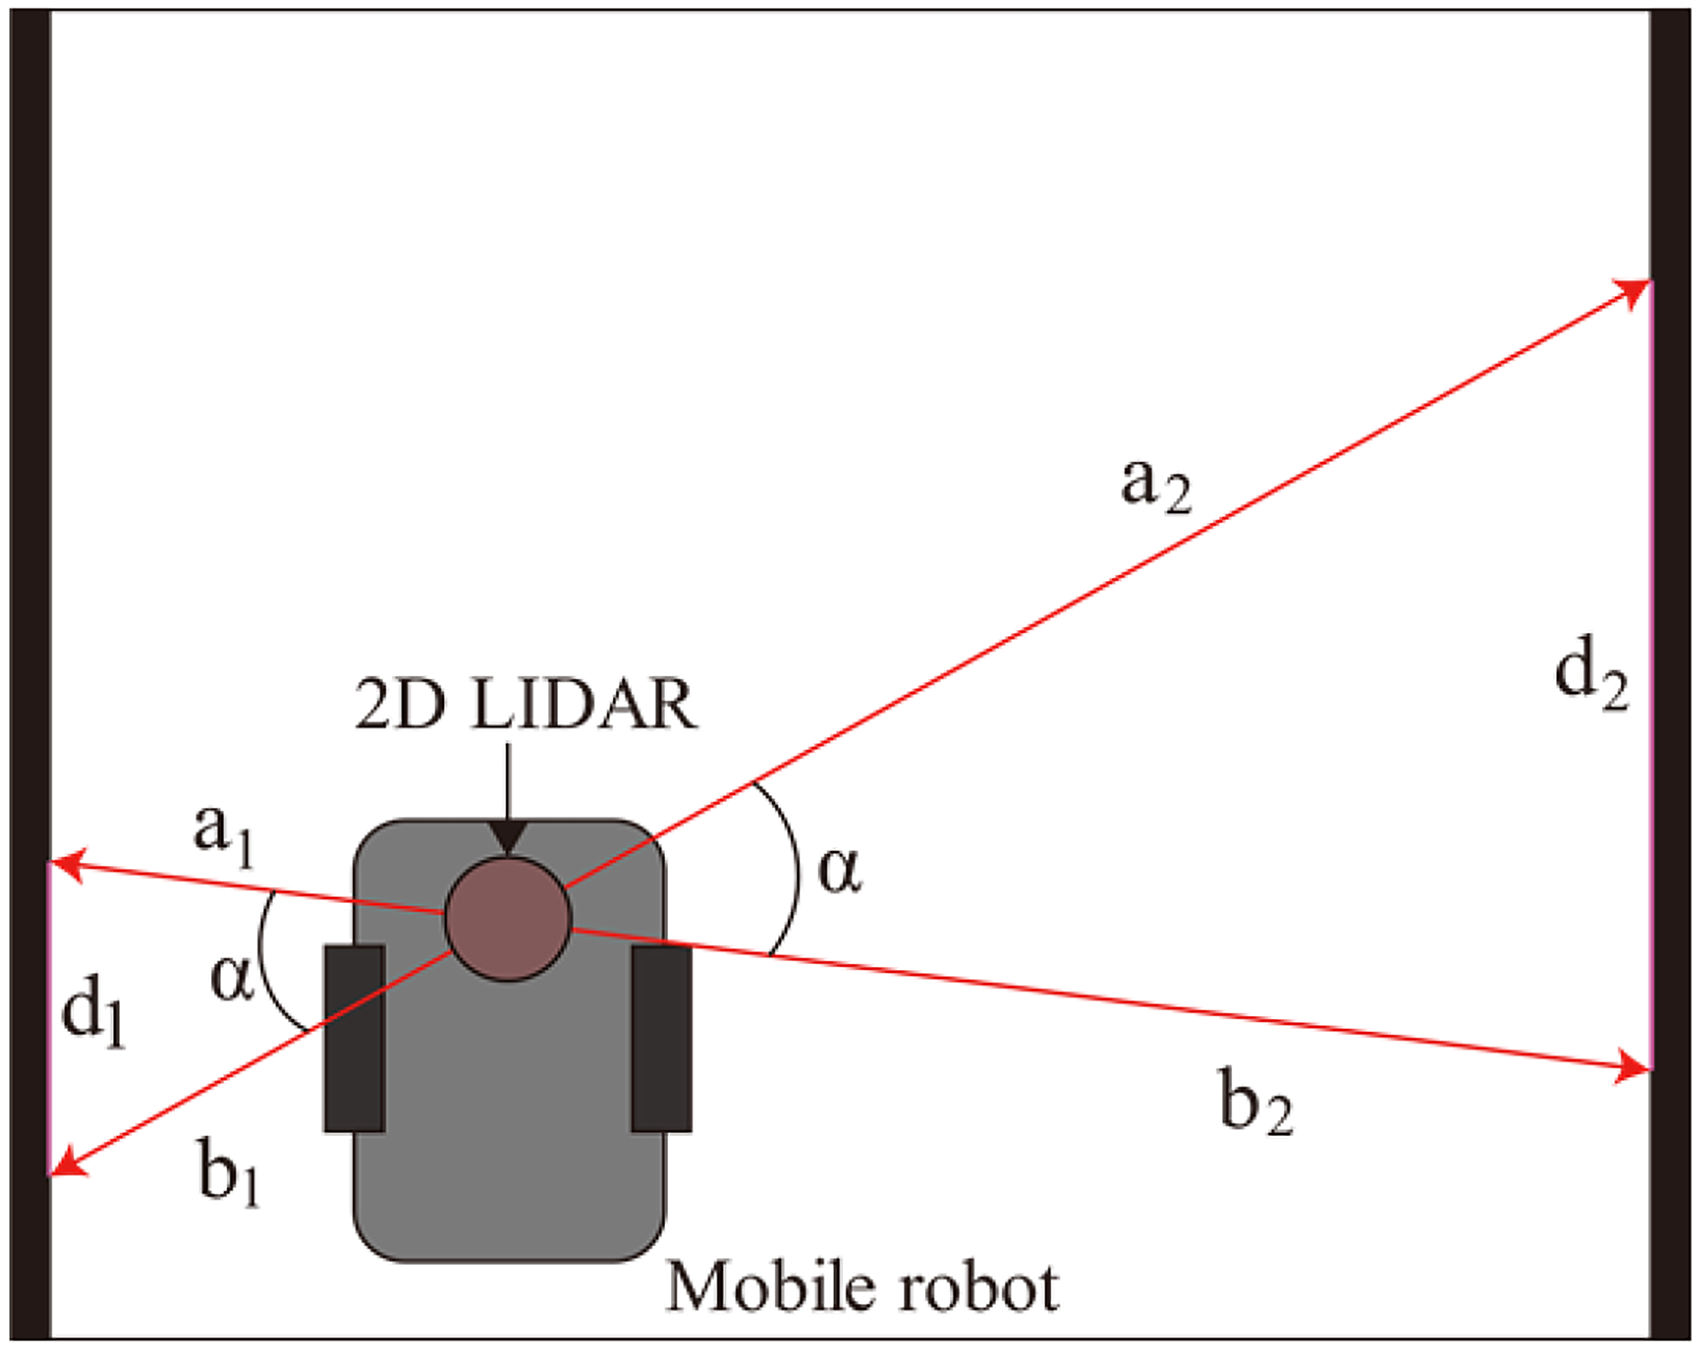
Characteristics of a 2D LiDAR sensor.
Given that

Given that α is constant,
Let
Subsequently, we perform point clustering by grouping all LiDAR points that fall within each grid cell. The clustering operation is defined as

The covariance matrix, which captures the spatial dispersion of measurements within the cell, is computed as equation (3):

These parameters fully specify the Gaussian distribution for each grid cell. In equation (4),
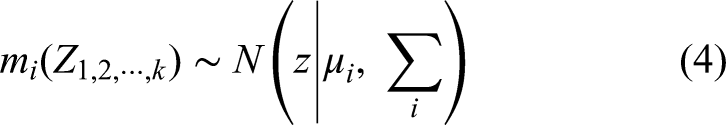

To assign a probability value to each grid cell, we evaluate the Gaussian distribution at the geometric center of the cell. The center point of grid cell
Figure 3(a) shows the initialization of the grid cells. 2D LiDAR data are black dots, and G is VGM grids that have empty values. The 2D LiDAR data are discretized to cluster the LiDAR data on a grid in the grid cells. For scan data within a grid, calculate the mean and covariance as shown in equations (2) and (3). Subsequently, each grid will have a Gaussian distribution. The position value is sampled from the center of the corresponding grid from the Gaussian distribution and calculated as shown in Figure 3(b). In Figure 3(b), we represent the low probability areas with light gray and the high probability areas with black. On the other hand, G8 has a higher probability calculated and black colored because the average value is closer to the center.

An example of how the grid becomes stochastic values. (a) 2D LiDAR data and empty VGM, (b) Calculated VGM.
We exploit the characteristic property of 2D LiDAR measurements, wherein scan points cluster densely around nearby obstacles, to generate the VGM representation. To emphasize grid cells with higher measurement density, we introduce a normalized hit ratio that quantifies the relative point concentration within each cell. The hit ratio for grid cell

The final input data used in VGM-Net is calculated through the weighted combination of probability and hit ratio as shown in equation (7):

The VGM input I for VGM-Net is thus calculated as the element-wise product of the hit ratio
Validation Gaussian grid map-network
The design of VGM-Net addresses fundamental limitations in existing validation approaches through systematic architectural considerations. Traditional RGB-based methods 38 suffer from viewpoint dependency and lose critical geometric information during LiDAR-to-image conversion. Geometric verification methods rely on fixed thresholds that perform poorly in feature–sparse environments. Our design process began by identifying the core requirements: preserving probabilistic information, maintaining computational efficiency, and capturing spatial correlation patterns.
The transition from VGM representation to neural network processing requires careful consideration of the data structure and computational efficiency. The VGM provides a two-dimensional grid where each cell contains Gaussian parameters along with hit ratio information. The key insight driving our network design is that successful scan matching should exhibit consistent spatial patterns in the VGM representation, which can be learned through deep feature extraction.
When scan matching succeeds, the Gaussian peaks from previous and current scans align spatially, creating coherent patterns across the grid. Conversely, when scan matching fails, the Gaussian distributions show significant spatial displacement or exhibit low correlation between consecutive frames. This observation led us to design a network that could effectively distinguish these spatial correlation patterns.
The choice of a 1 × 1 convolution layer as the initial processing step is theoretically motivated. This layer operates on each grid cell independently, computing a weighted combination of the Gaussian distributions from previous and current scan data. This operation is mathematically equivalent to creating a Gaussian Mixture Model at each spatial location, where the learned weights capture the relative importance of historical versus current measurements. The 1 × 1 convolution preserves the spatial structure of the VGM while reducing computational complexity by processing each grid cell independently without considering neighboring spatial relationships, which is appropriate for our probabilistic representation where each cell contains complete Gaussian information.
Figure 4 depicts the architecture of VGM-Net. The VGM serves as the input data for the CNN model, while the processed features from the 1 × 1 convolutional layer are subsequently passed through the network. This architecture ensures computational efficiency comparable to conventional scan matching algorithms while achieving improved feature discrimination for robust validation of scan matching results.

Architecture of VGM-Net.
According to equation (8), the VGM is computed as it passes through the 1 × 1 convolutional layer:

The parameter weights w in the 1 × 1 convolutional layer yield results similar to those of a Gaussian mixture model because the VGM represents scan data as a Gaussian model. The main difference between equation (8) and a Gaussian mixture model is that the summation of weights does not necessarily add up to 1. The use of a 1 × 1 convolutional layer reduces the two-dimensional space of VGM to a one-dimensional representation. In successful scan matching cases, the values in equation (8) are smaller than in failed scan matching cases because scan data are dispersed over a wide area. The performance of scan matching validation is influenced by variations in data distribution during data transfer through the network.
Experiments and results
Experimental setup
To evaluate the performance of our proposed method, we compare the results with the method in Jeong and Lee 38 using the Intel dataset 42 and data from a practical office environment. The selection of 38 as the primary baseline is carefully justified by several methodological considerations. While recent SLAM research has explored various approaches including scan-matching optimization methods11,25,43 and robust backend optimization techniques, 44 these methods address fundamentally different aspects of the SLAM pipeline and do not provide comparable validation frameworks for direct performance comparison.
Our method is specifically compared against 38 because it represents the most relevant baseline for neural network–based scan matching validation in graph SLAM. To the best of our knowledge, Method 38 represents the most methodologically relevant existing approach that employs neural network–based validation for scan matching results in graph SLAM construction, providing the most appropriate baseline for evaluating deep learning–based front-end validation performance. Furthermore, 38 employs comparable edge construction strategies based on scan-matching results and operates under similar computational constraints, ensuring fair comparison. Alternative approaches such as switchable constraints, 26 max-mixture models, 27 and graph-cut RANSAC 30 fundamentally differ in their validation philosophy—they identify outliers during backend optimization rather than performing front-end validation, making direct accuracy comparison inappropriate. The Intel dataset12,45 serves as a widely used benchmark that ensures consistent comparison conditions, while our practical office environment data demonstrate real-world applicability across diverse indoor scenarios with varying geometric complexity.
To obtain sensor data for a typical office space, we collected measurements from multiple locations as shown in Figure 5. In a practical office space with a corridor, we obtained data while navigating the mobile robot.
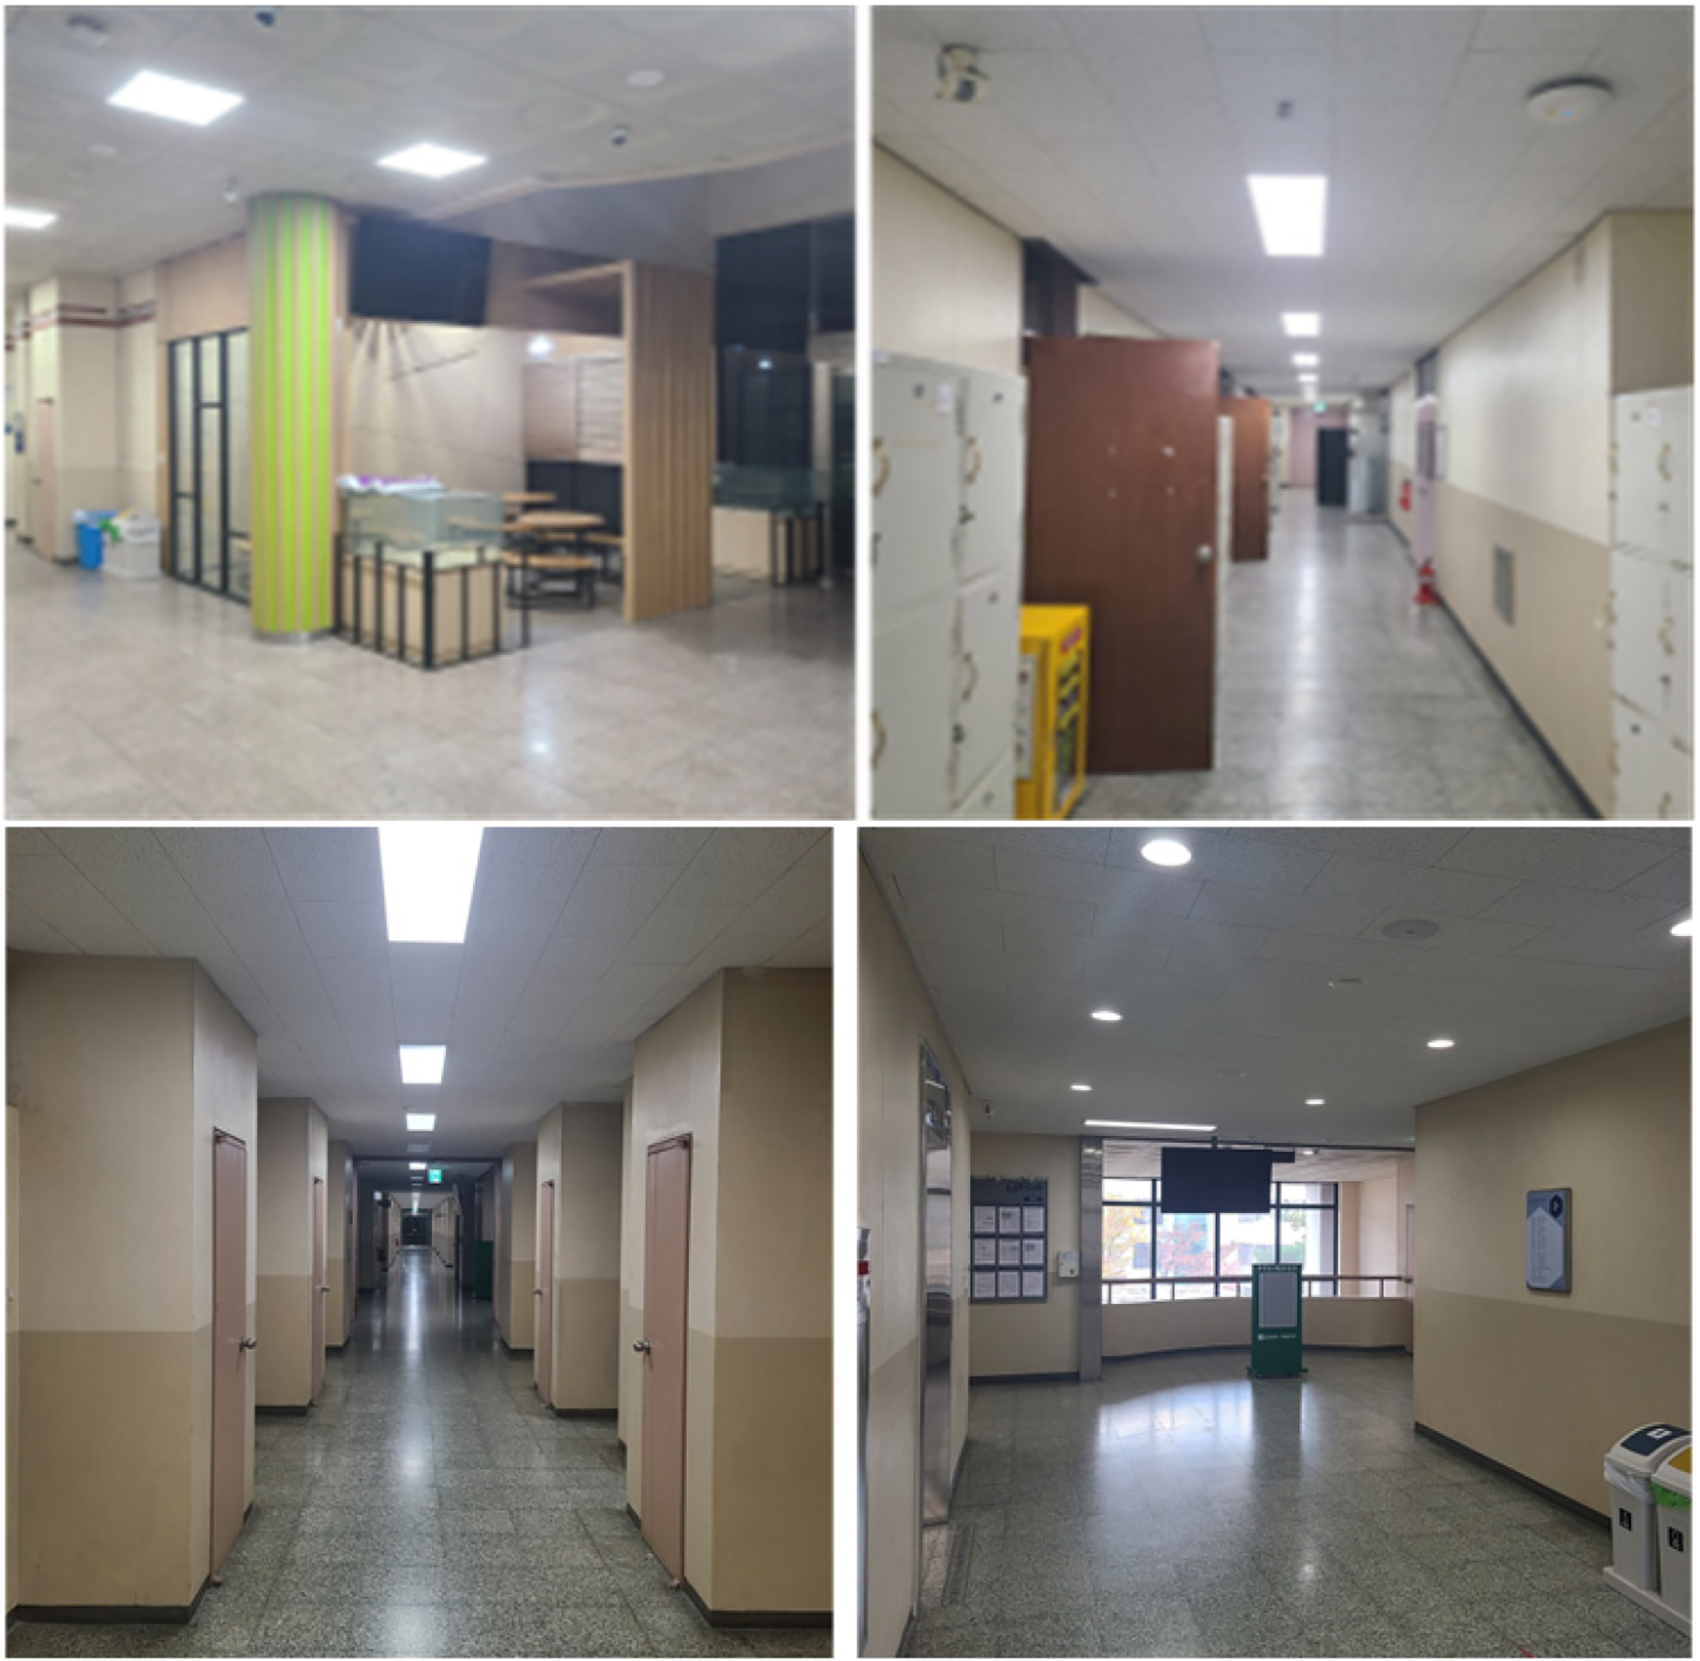
A practical office environment with hallways for obtaining training data and performance verification.
Figure 6 depicts a reference map of the experimental location. The experimental area measured 68.0 m in length and 14.0 m in width. The results obtained using the proposed method was compared to those reported in He et al. 37 to ensure the accuracy of the proposed method. Subsequently, the VGM-Net method was implemented for validating scan matching to demonstrate the robustness of graph SLAM. The LiDAR data of the experimental area were acquired using an NAV350, a 2D LiDAR sensor designed for indoor use. This sensor has a wide aperture angle of 360°, which allows for broad coverage. Moreover, the sensor has a high resolution of 0.25°, meaning that it is capable of precise detection and measurement. Furthermore, the maximum measurable distance of this sensor is 250 m, which is adequate for extensive data acquisition.

Reference map of performance verification environment, including hallways.
The NAV350 LiDAR sensor was installed on a mobile robot (RB1), and laser scan data of the environments were collected, as illustrated in Figure 7. Figure 7(a) shows the NAV350 LiDAR sensor mounted on RB1, and Figure 7(b) presents the scan data obtained from the NAV350 LiDAR sensor during the operation of the mobile robot. The network was trained on a PC equipped with an i9–13900KF CPU and a GeForce 4090 GPU.

Measuring experimental data with NAV350. (a) A robot equipped with the NAV350, (b) The example of measuring data in an experimental environment with the NAV350.
Results of the VGM
Light detection and ranging scan data were acquired by operating the mobile robot in the selected indoor environment. The scan matching procedure was executed using the measured scan data, resulting in a total of 1,941 scan matching results. 22 The scan matching results were transformed using the VGM. The dimensions of the VGM were established as 400 × 400 scales, while its resolution was set to 0.05 m.
The detailed parameters of VGM-Net are shown in Table 1. The names of the layers are represented as in the architecture in Figure 4. The detailed parameters of the network layers were set to 1 × 1 convolutional layer with 16 filters, convolutional layer 1 with 32 filters, convolutional layer 2 with 64 filters, and finally convolutional layers 4 and 5 with 128 filters each. The last multilayer perceptron in Figure 4 used 256 weights. In addition, the sigmoid activation function was exploited and the network was optimized employing the Adam optimizer. Training was performed with a batch size of 128 over 90 epochs.
Detailed parameters of VGB-Net.

Figure 8 and Figure 9 demonstrate the effectiveness of the proposed scan matching method. The actual experimental environments are shown in Figures 8(a) and 9(a), while the corresponding scan matching results are presented in Figures 8(b) and 9(b). In these figures, black dots represent registration point data, and red dots indicate the transformed point data after applying the matching algorithm.
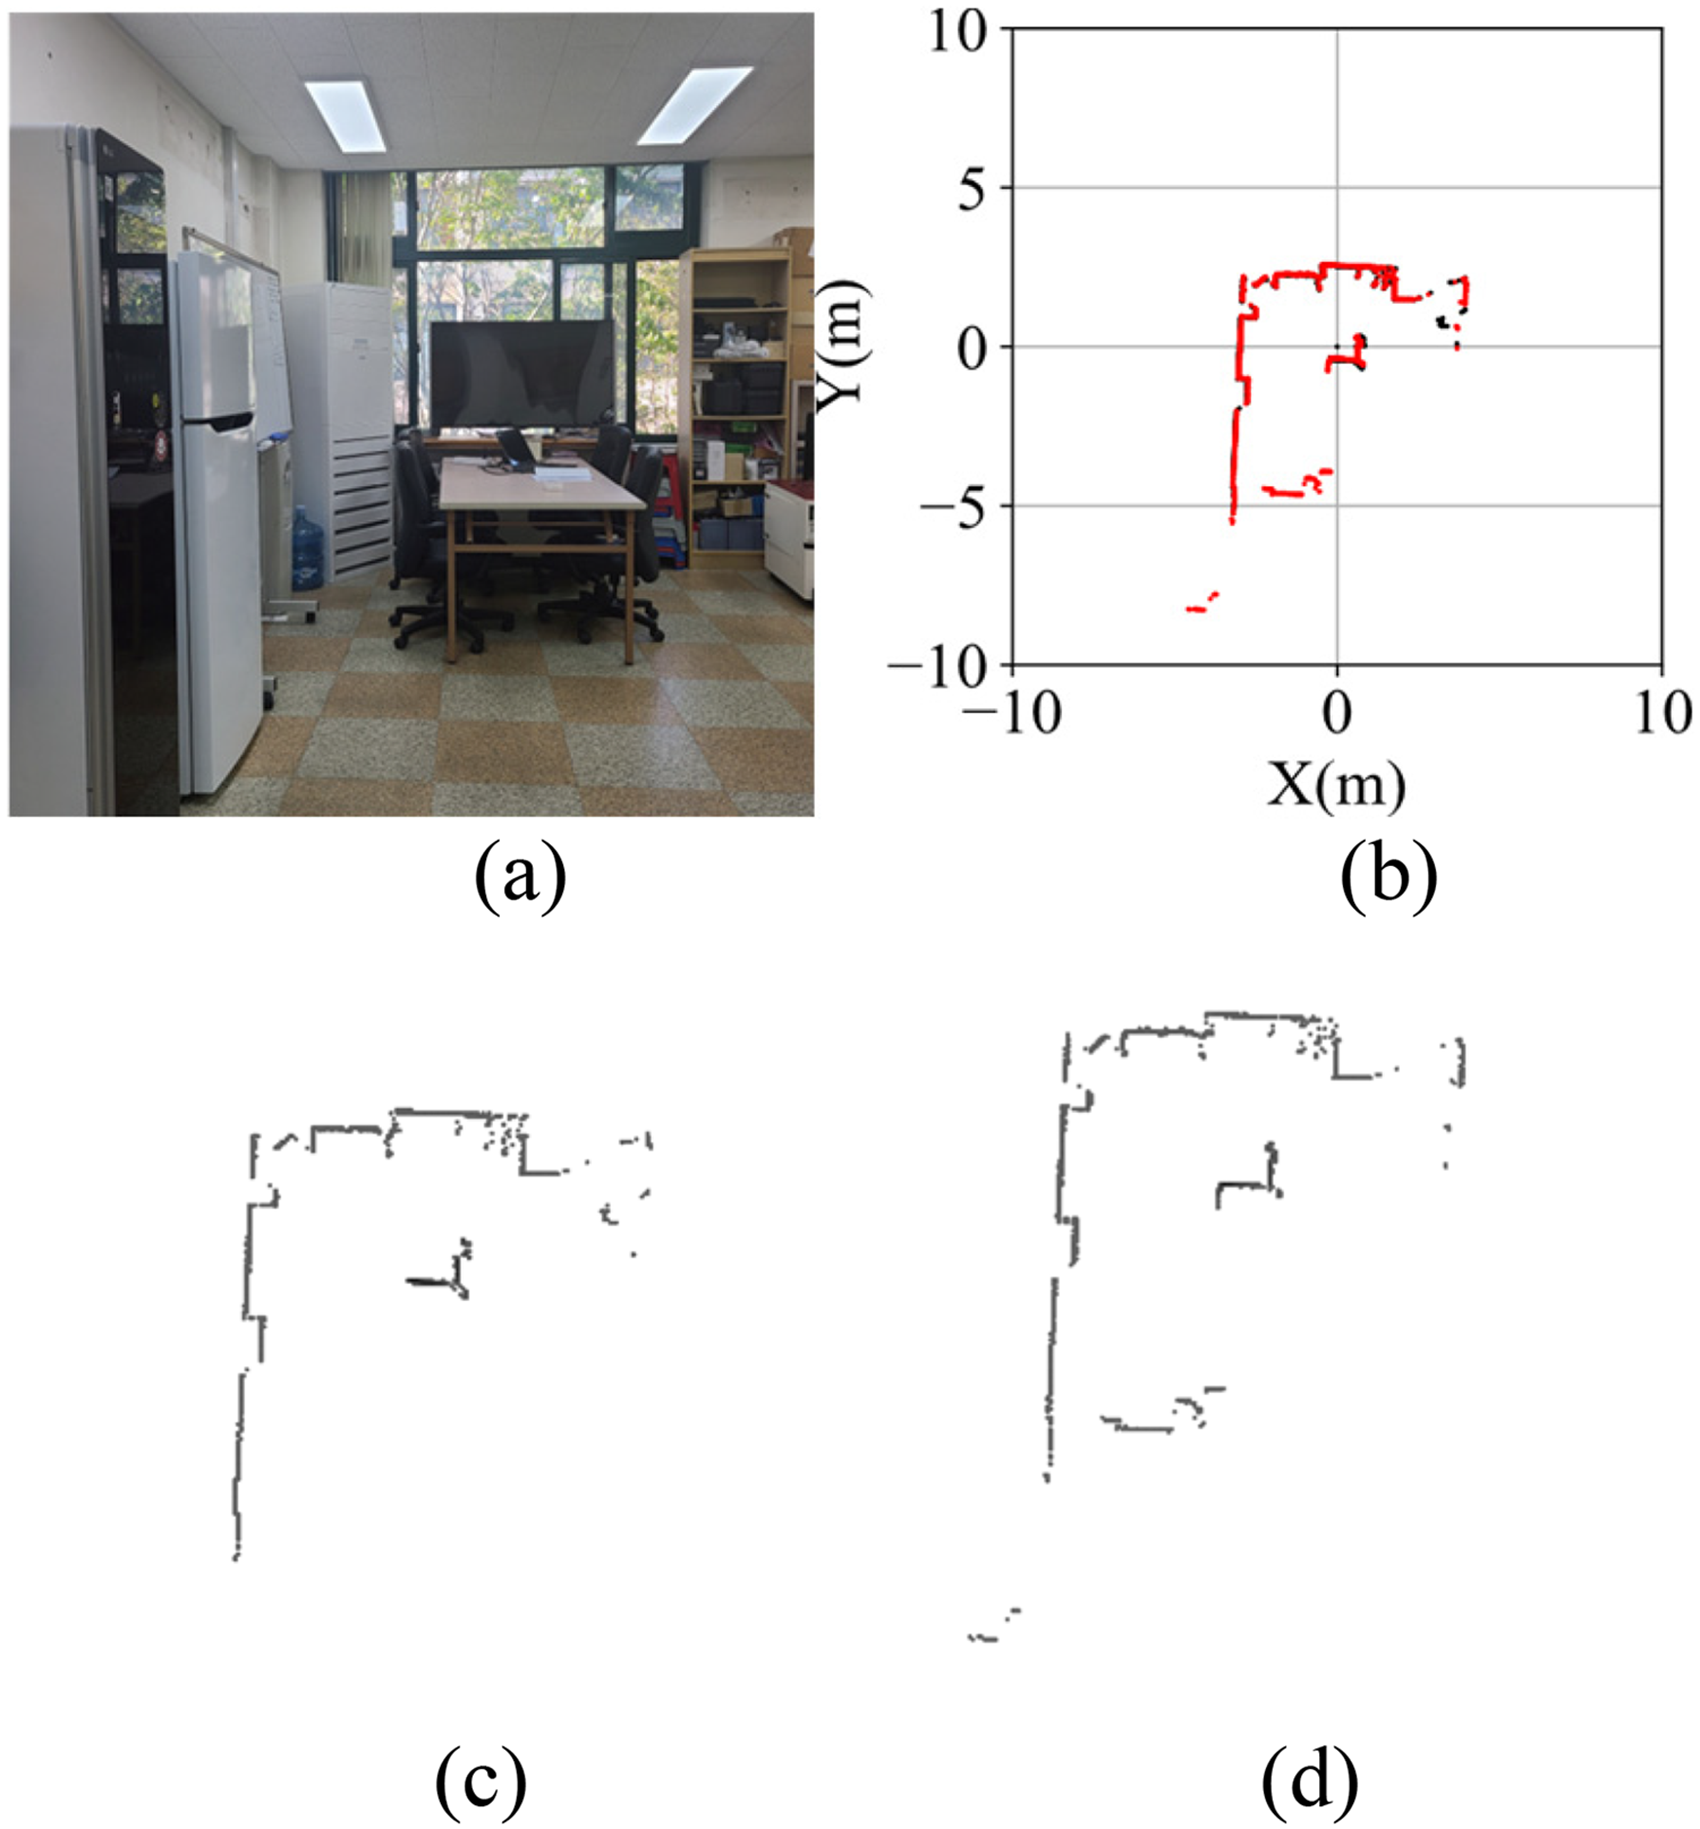
Scan matching result and VGM image 1. (a) Real experimental data, (b) Scan matching result, and (c and d) VGM images.

Scan matching result and VGM image 2. (a) Real experimental data, (b) Scan matching result, and (c and d) GM images.
The VGM-transformed results, displayed in Figures 8(c), (d) and 9(c), (d), visualize the VGM generation process by overlaying previous scan data with current scan data. This representation clearly shows the spatial alignment achieved through the proposed method.
Comparison of accuracy and precision
To evaluate the accuracy and precision of scan matching results validation, we selected 410 loop closing edge candidates from 1,301 scan data frames measured in an office LiDAR data. We chose the 254 loop closing edge candidates from 3,900 scan data frames in the Intel data set.
The comparison between the results method 38 and the proposed VGM-Net in office LiDAR dataset is shown in Table 2. The VGM-Net demonstrates superior performance with 92.34% accuracy compared to 85.32% for the baseline method, representing a significant 7% improvement in challenging corridor environments.
Comparison of accuracy and precision in practical office environment.

The performance stems from VGM-Net enhanced representation capabilities. Table 3 reveals the underlying mechanisms behind this improvement. The reduction in false negatives from 50 to 10 cases indicates that VGM-Net successfully preserves valid geometric alignments that are lost in RGB-based approaches. This occurs because the Gaussian representation maintains continuous spatial relationships, whereas RGB conversion introduces discretization artifacts that cause valid matches to be incorrectly rejected.
Detailed comparison results in practical office environment.

The reduction in false positives from 10 to 5 cases demonstrates VGM-Net's superior discrimination capability. Analysis of these cases reveals that 80% of the baseline method false positives occurred in repetitive corridor structures where geometric patterns appear similar but are spatially distinct. The VGM-Net probabilistic clustering effectively distinguishes between these ambiguous cases by preserving the continuous distribution of measurement uncertainty.
The false negative reduction is particularly critical for graph SLAM performance. False negatives represent the removal of valid edge connections, which destabilizes front-end connectivity and leads to optimization failure. The VGM-Net's significant reduction in this error type (from 50 to 10) directly translates to more robust pose graph construction and improved mapping accuracy, as demonstrated in the subsequent mapping experiments.
While both methods achieve identical true positive detection (347 cases), VGM-Net's lower false negative rate indicates superior sensitivity to valid geometric alignments in feature–sparse environments. The slight reduction in true negatives reflects VGM-Net's more conservative approach to edge rejection, prioritizing connectivity preservation over aggressive outlier removal.
The comparison between the results method 38 and the proposed VGM-Net in the Intel dataset is shown in Table 4. The VGM-Net achieves higher performance with 80.71% accuracy compared to 68.77% for the baseline method, representing a substantial 12% improvement that exceeds the office environment results.
Comparison of accuracy and precision in intel dataset.

The Intel dataset presents more challenging conditions compared to practical office environments, including longer trajectory sequences, larger loop closures, and higher cumulative odometry drift. These characteristics make scan matching validation particularly difficult, as geometric patterns become increasingly ambiguous over extended sequences.
Table 5 shows the detailed breakdown of 254 edges, where VGM-Net demonstrates exceptional improvement in false positive reduction from 33 to 9 cases. This 73% reduction is particularly significant given the Intel dataset propensity for false loop closures due to repetitive indoor structures and accumulated drift. Method 38 loses critical geometric nuances in these challenging long-term scenarios, while VGM-Net continuous Gaussian representation preserves essential spatial relationships even under drift conditions.
Detailed comparison results in intel dataset.

The substantial increase in true positive detection from 155 to 198 cases (28% improvement) reflects VGM-Net effectively identifies valid loop closures in the Intel dataset complex environment. This dataset contains numerous legitimate loop closure opportunities that are missed by method 38 due to accumulated geometric distortions, but VGM-Net probabilistic framework successfully captures these valid alignments by modeling measurement uncertainty inherent in long-term navigation.
The false negative reduction from 46 to 40 cases, while more modest, is crucial for maintaining graph connectivity in large-scale environments. In datasets like Intel with extensive trajectories, each valid edge connection is essential for global consistency, making VGM-Net conservative but accurate validation approach particularly valuable for robust large-scale SLAM performance.
Comparison of robustness in graph SLAM using VGM-Net
To evaluate the performance of Graph SLAM using VGM-Net, we conducted scan matching with LiDAR data from the experimental region and compared these results to Jeong and Lee. 38 We set up 394 nodes and obtained 1,132 edges between the nodes. When VGM-Net was used to validate scan matchings, 251 scan matchings were considered failures, and the corresponding edges were deleted. In contrast, Jeong and Lee 38 classified 302 scan matching results as failures and deleted the corresponding edges. Subsequently, the pose graph was computed utilizing the optimization method described in reference, 12 and the results are presented in Figure 10.

Edge validation results with scan matching. (a) Edges validated using the approach proposed by Jeong and Lee, 38 and (b) Edges validated using VGM-Net.
The map depicted in Figure 11 was generated by implementing the OGM method. 41 When dynamic obstacles are present in the environment, dynamic obstacles move from frame to frame, so it is possible to efficiently handle dynamic obstacles to obtain accurate maps, given that obstacles are not registered to the same area within the grid map repeatedly. Figure 11 presents a comparison of the application of graph SLAM to scan matching validation. Figure 11(a) shows the results of graph SLAM utilizing the method proposed in reference, 38 while Figure 11(b) shows the result of Graph SLAM by applying the proposed VGM-Net approach.

Comparison of results of graph SLAM using scan matching validation in our obtained LiDAR data. (a) Graph SLAM results obtained by Jeong and Lee 38 and (b) Graph SLAM results obtained using VGM-Net.
In this representation, the gray areas represent unknown regions, white areas represent occupied spaces, and black areas represent unoccupied spaces. In comparison to Figure 6, it is evident that Figure 11(a) exhibits a horizontal error of 0.47 m and vertical error of 0.81 m, whereas Figure 11(b) exhibits a horizontal error of 0.6 m and vertical error of 0.23 m.
Figure 10 shows the edge validation experiments with scan matching. Figure 10(b) shows the 810 edges remaining, and Figure 10(a) shows the 830 edges remaining. Because the approach proposed by Jeong et al. removed too many edges compared to VGM-Net, the resulting map was unstable after optimization, as shown in Figure 11.
Figure 12 shows the edges that were deleted after validating the scan matching results, as well as an enlarged view of the graph SLAM result. Compared to VGM-Net, the validation approach of Jeong and Lee 38 deleted too many edges, resulting in a blurred map in (c) compared to that in (d). However, VGM-Net, with proper validation, yielded obvious results, such as those in (d). The red line shows that 45 edges were eliminated out of the 118 edges in this area (a), and 45 edges were deleted following validation in (b). Although (a) deleted more edges than (b), it deleted edges with true values as well. In other words, the number of FP in (a) was higher, and the back-end could not identify the optimal pose as a consequence. Using the endpoints of maps (b) and (d) to evaluate map accuracy, it was found that (b) had a 0.47 m map error relative to (d).

Deleted edges and enlarged view of results in the lounge. (a) Edges deleted using the validation approach of Jeong et al., 38 (b) Enlarged results of Graph SLAM obtained using the approach of Jeong et al., 38 (c) Edges deleted using VGM-Net validation, (d) Enlarged results of Graph SLAM using VGM-Net.
Figure 13 presents a comparison of the application of graph SLAM to validation system in Intel datasets. The blue dots represent vertices and the red lines indicate edges. In the Intel dataset, 1,402 loop edges were created. Method 38 rejects 1,268 loop edges while VGM-Net rejects 1,338 loop edges.

Comparison of results of graph SLAM using validation system in intel dataset. (a) Graph SLAM results obtained by Jeong and Lee 38 and (b) Graph SLAM results obtained using VGM-Net.
The areas marked with red circles in Figure 13 indicate regions where the proposed VGM-Net method achieves significantly better performance than the baseline method. 38 In these highlighted regions, VGM-Net successfully eliminates false loop closures that were incorrectly accepted by the conventional approach, resulting in a more consistent and accurate map structure.
Figure 14 shows enlarged views of the circled regions from Figure 13, providing a detailed comparison of rejection performance in corridor environments. The conventional method 38 fails to properly reject false edges, leading to map distortion and structural inconsistencies as shown in Figure 14(a). In contrast, VGM-Net demonstrates accurate rejection of false edges, preventing map distortion and maintaining geometric consistency as illustrated in Figure 14(b).

Comparison of rejection edges using validation system. (a) Validation system, 38 (b) VGM-Net validation system.
By rejecting false edges more effectively, the backend performance is improved compared to the conventional method. 38 By calculating the error using the wall thickness, Figure 14(a) shows a horizontal error of 1.01 m, while Figure 14(b) shows 0.48 m, demonstrating that our method resulted in a more accurate map with reduced distortion.
In this paper, we carried out SLAM experiments in various environments including the typical office environments and Intel data set to verify the proposed method. Unlike the method of applying the robust kernel for optimization of the backend, 44 we not only detect false positive loop closure constraints 26 but also detect false positive edges for all node connectivity. To train VGM-Net, we created the VGM using the Gaussian model as the input data. The proposed VGM maintains that the property of 2D LiDAR points clustering on nearby objects is because of the hit ratio and mean values in the grid. The VGM-Net has more rejection accuracy of false edges. A high rejection accuracy of false edges leads to a more robust mapping.
While this study focuses on direct comparison with method 38 as the most methodologically relevant baseline, it is essential to contextualize the validation approach within the broader SLAM outlier detection landscape. Alternative robust optimization techniques such as switchable constraints, 26 max-mixture models, 27 and robust backend kernels 44 operate during pose graph optimization rather than performing front-end validation, representing fundamentally different validation philosophies that make direct performance comparison methodologically inappropriate. These backend approaches assume that outlier constraints have already entered the pose graph and focus on minimizing their influence during optimization, whereas VGM-Net performs preemptive validation to prevent erroneous edges from corrupting the graph structure. The experimental validation across benchmark and real-world datasets, coupled with detailed performance analysis demonstrating superior false positive rejection, establishes the effectiveness of probabilistic front-end validation for robust graph SLAM in challenging indoor environments.
Conclusion
This study proposed the VGM-Net to enhance the robustness of Graph SLAM through accurate validation of scan matching results using a novel Gaussian-based grid representation of 2D LiDAR data. The VGM effectively preserves spatial clustering characteristics and geometric features without distortion, enabling VGM-Net to distinguish between valid and erroneous scan matches by focusing on high-value grid cells. Experimental results on both Intel datasets and real indoor office environments demonstrate that the proposed scheme successfully rejects incorrect edges, leading to improved pose graph convergence and more accurate mapping. However, the current approach has limitations that warrant consideration. The reliance on LiDAR data alone poses challenges in degenerate environments where geometric features are extremely sparse or repetitive, such as long corridors or symmetric structures, where the scan matching stage may produce false positive results that appear geometrically plausible. The method also faces constraints in large-scale environments, where accumulated drift degrades performance, and dynamic scenarios, where moving objects compromise validation accuracy. Computational costs scale with grid resolution, potentially limiting deployment on resource-constrained platforms. Future research will focus on developing a multimodal validation system addressing these limitations by incorporating camera-LiDAR fusion to provide complementary geometric and visual constraints that effectively identify and reject false matches in challenging scenarios, while hierarchical representations and temporal consistency mechanisms will enhance scalability and robustness in large-scale dynamic environments.
Footnotes
Ethical statement
This research is not related to medical research.
Funding
The author(s) received no financial support for the research, authorship, and/or publication of this article.
Declaration of conflicting interests
The author(s) declared no potential conflicts of interest with respect to the research, authorship, and/or publication of this article.
Data availability statement
All data relevant to this study are available upon request. Please contact the corresponding author to access the data.