
Abstract
There are problems in the special pastoral environment, including large changes in target size and serious interference from light and environmental factors. To solve the above problems, an enhanced YOLOv4-tiny target detection network is proposed in this study. This network first solves the problem of livestock size fluctuation in pastoral areas, uses a pyramid network with multiscale feature fusion, and considers shallow local detail features and deep semantic information. Subsequently, a novel compound multichannel attention mechanism is proposed to increase the accuracy of the target detection network for the pastoral environment. The problem of poor accuracy of target detection network is solved. The algorithm is ported to Jetson AGX embedded platform for validation to examine the real-time performance of the algorithm. As revealed by the experimental results, enhanced YOLOv4-tiny achieves 89.77% detection accuracy and 30 frames/second detection speed, which increases the average detection accuracy by 11.67% compared with the conventional YOLOv4-tiny while maintaining almost the same detection rate.
Keywords
Introduction
Target detection based on deep learning has been a research hot spot over the past few years and has aroused wide attention, 1 and relevant technologies have been applied to face recognition, 2 car driverless, 3,4 pedestrian tracking, 5 intelligent transportation, 6 and other fields. Target detection 7 technology has been found as a key technology of Internet of Things in the livestock industry, which is a vital means to monitor the location, number, health status, as well as whether the livestock are in estrus in real time; this technology also lays a basis for achieving intelligent pasture. 8 Only through accurate detection and identification of livestock, automated and accurate management of livestock can be achieved, human input can be reduced, and the farming industry can be developed more scientifically and efficiently.
The current conventional means of detection in pastoral areas are primarily dependent on wearable devices, which are adapted to provide feedback to the server on the number and sign status of livestock. For instance, Jia used intelligent collars to design livestock health diagnosis algorithms, so as to achieve automatic monitoring of livestock sign parameters. 9 Zhang et al. 10 developed an intelligent sheep counter system in pastoral areas and proposed an intelligent microcontroller and UHF RFID technology-based sheep counter, capable of achieving rapid and accurate counting of sheep. However, livestock in pastoral areas are largely free-ranging, and the vast pastures lead to a more extensive range of livestock movement. Thus, the wearable device is easy to falloff and damage, and it will be limited by the signal distance, which results in the loss of effect. Accordingly, deep learning-based livestock target monitoring means that it is not required to cooperate with wearable devices have begun to receive widespread attention, and scholars worldwide have been conducting relevant research. For instance, Tassinari et al. 11 proposed a deep learning-based monitoring of cows in free stalls, which tracks cows on farms based on deep learning to achieve location, movement, and motion detection of cows and record the time-history output of the respective animal. Wu et al. 12 proposed a method based on the YOLOv3 deep learning algorithm and relative step feature vectors to classify lame and nonlame cows for classification. This method is capable of achieving intelligent detection of lameness and provides a novel idea for automated livestock disease monitoring; Achour et al. 13 proposed image analysis for individual cow identification and feeding behavior monitoring based on convolutional neural network (CNN). This image analysis uses multiple CNNs to detect whether a cow is in the feeding area, its position in the feeding area, whether there is food in the feeder, cow body size, and presence of food. Finally, the image analysis monitors the whole process of cow feeding. Ma et al. 14 optimized the YOLOv4-tiny algorithm in accordance with YOLOv4-tiny algorithm for the field of target detection in autonomous driving system, which can be used to deploy in the embedded system within the car to support the implementation of autonomous driving.
In brief, using deep learning-based livestock target detection methods in pastoral areas is promising, 15 which is a vital technology to achieve smart pastoral areas. However, current detection algorithms are not ideal for livestock target detection in pastoral areas, mainly because the environmental characteristics of pastoral areas add numerous difficulties to target detection. First, the livestock are located at different locations from the camera, and the size of the target varies significantly. For instance, the difference between the scale of adult cattle in the near and the goats in the far is significantly large. Second, due to the sparse population and buildings in pastoral areas, the camera is seriously disturbed by direct sunlight, which reflects light from the grass and windy days, thus significantly affecting the detection accuracy. Furthermore, the arithmetic power and cost limitations of embedded devices applied to pastoral areas require lightweight algorithms, while high-precision deep learning algorithms mostly require high arithmetic power equipment support. 16 Thus, driven by the practical needs, a lightweight, efficient, livestock target detection algorithm based on deep networks and adapting to the pastoral environment is urgently required.
The lightweight YOLOV4-tiny 17,18 algorithm is adopted in this study as the basic framework for targeted improvement of the algorithm. First, to solve target scale disparity, a pyramid structure is introduced to increase the regression prediction branch for multiscale fusion; a composite anchor frame clustering structure is developed with the changing characteristics of livestock targets in pastoral areas to facilitate the algorithm’s detection of large and small targets with varying scales. Second, a novel compound multichannel attention (CMA) mechanism is proposed for the effect of high wind and strong light on the collected images in pastoral areas, capable of effectively overcoming the interference of wind and light factors on the detection targets and enhancing the robustness of the algorithm. Finally, the algorithm is ported to the embedded platform Jetson AGX Xavier for testing and validation.
Theoretical foundation
The YOLO (You Only Look Once: Unified, Real-Time Object Detection) family is a classical approach in a phase of single neural network-based target detection algorithms proposed by Joseph Redmon and Ali Farhadi et al. in 2015. 19
YOLO refers to an algorithm using CNN to achieve end-to-end target detection, 20 which has been extensively used and studied since it was proposed in 2015 because of its speed advantage. YOLO uses regression ideas to predict the class and location of multiple targets in real time, unlike the two-stage detection algorithm that skips the intermediate layer to extract candidate regions and directly uses the whole image to train the network model and uses a sliding window to find targets. Furthermore, this design significantly increases the speed of the algorithm while maintaining high detection accuracy compared with the two-stage algorithm.
YOLOv4-tiny algorithm
YOLOv4 is the most extensively used network framework for YOLO. YOLOv4-tiny refers to a simplified version of YOLOv4. YOLOv4 has nearly 60 million parameters, while YOLOv4-tiny has only 6 million parameters, thus significantly enhancing the feasibility of deployment in embedded systems. YOLOv4-tiny has significant performance advantages over other versions of lightweight models, and it is one of the most accurate lightweight algorithms available.
The YOLOv4-tiny target detection network simplifies the network model and increases the detection speed by losing some detection accuracy, while reducing hardware requirements. Although the algorithm is high in real-time and suitable for embedded platform deployment, it has some disadvantages, including small detection scale, low detection accuracy, especially in small target detection, high miss detection rate, and low algorithm robustness in complex scenarios.
Loss function
The YOLOV4 algorithm loss function comprises the category, confidence, and location losses. This function characterizes the accuracy of the algorithm’s predicted frame and its difference from the actual frame. It is expressed as

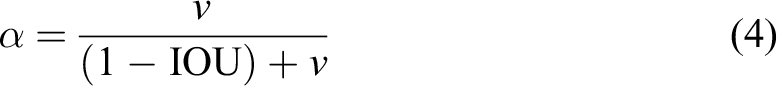
where IOU is defined as the coverage area of the real frame R and the candidate boundary D, ρ is the coefficient, v denotes the similarity of the aspect ratio, c represents the distance between the farthest two boundary points of the real frame and the predicted frame, and α is the weight parameter. The calculation formula is as follows
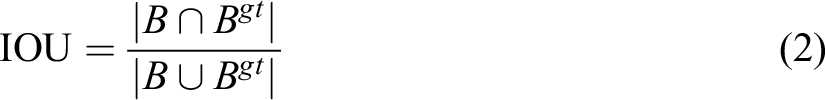

where B and Bgt denote the real frame and the prediction frame. The value of IOU is [0,1], representing the ratio of the overlapping area of the real frame and the predicted frame to their concatenated area.
Average accuracy
Mean value of average accuracy (mAP) is obtained by averaging the average correct rate of all categories of detection. The larger its value, the higher the accuracy of the model’s localization and recognition will be, which is an important measure of the algorithm’s detection accuracy. Its calculation method is written below. First, precision i and the detection accuracy of each type of target in each picture are calculated and then the average value of the detection accuracy of pictures containing one type of object is found to get the average accuracy PAj of each class; subsequently, the average accuracy of all classes is calculated by the value of PAj of each class, and its calculation formula is shown in the following equations


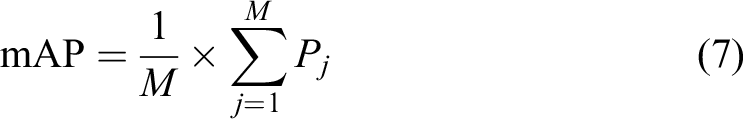
where Ntp denotes the number of detection targets C that are actually the ith image and are also determined as detection targets C, Nfp represents the number of images in the ith image that are not detection targets C but determined as detection targets C, N represents the number of images in the test set, M expresses the number of categories in the test set, and PAj is the average precision value of the jth category of detection objects.
Precision–Recall curve
P in the PR curve represents the precision and R represents the recall, that is, the correlation between precision and recall. It is expressed as

Enhanced YOLOv4-Tiny-based livestock target detection in grazing areas
Based on the characteristics of pastoral environment and livestock, targeted enhancements are made to the YOLOv4-tiny network model, and a lightweight deep learning framework of E-YOLOV4-tiny is proposed. The structure of the framework is illustrated in Figure 1.

E-YOLOV4-tiny network structure diagram. E-YOLOV4: enhanced YOLOv4-tiny; YOLO: You Only Look Once.
The specific improvement measures of the algorithm in this study are elucidated below. (1) Based on the new detection scale, a composite clustering algorithm is designed to increase the detection accuracy of the algorithm by clustering the anchor frame based on the target scale characteristics of livestock in pastoral areas. (2) The CMA mechanism proposed in conjunction with the pastoral environment is introduced after the first CSP block, which retains more original feature information while allowing the gradient flow with the attention mechanism to enter the deeper network; as a result, the background noise under complex lighting conditions is suppressed, and the robustness of the algorithm is enhanced. (3) The residual structure is improved, the parameter content is reduced, while the network depth increases, a shallow feature output layer is introduced in the first CSP block, and deep semantic information for up-sampling is combined with the shallow feature layer to enhance the detection capability of the algorithm for small targets and obscured objects.
The proposed composite clustering algorithm
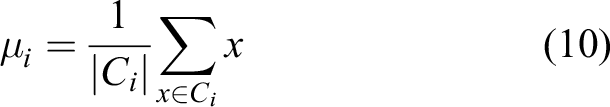
YOLO belongs to the one-stage detection algorithm, which uses a sliding window on the whole image to find the target, so the selection of the prediction anchor box is closely related to the detection accuracy. The YOLOv4 algorithm uses the K-means clustering algorithm to obtain the anchor box a priori from the training set. The K-means clustering algorithm adopts random selection method to randomly obtain k clustering centers. For a given sample set, according to the size of the distance between samples, the sample set is divided into k clusters (

where
Algorithm proposed
The K-means clustering algorithm is randomly selected for its initial points, which makes the accuracy fluctuate with the change of random points. Moreover, effects (e.g., different data or uneven array distribution) can lead to clustering centers that tend to converge to local minima. Lastly, after determining the number of k clusters, the algorithm needs to select k initialized centers of mass, and the location selection of the k initialized centers of mass will have a great impact on the final clustering results and running time, and even make the clustered-out anchor frames fail to achieve the expected effect. Accordingly, to solve the above problems, accurately frame mark all types of targets and increase the detection accuracy of the algorithm, this study proposes a composite clustering structure integrating K-means++ and DBSCAN to obtain accurate and stable clustering centers.
The K-means++ clustering algorithms are optimized for the K-Means random initialization center-of-mass problem. Since the random selection of initialized prime centers may lead to slow convergence of the algorithm or convergence to local minima, the K-means++ clustering algorithm randomly selects a point from the input set of data points as the first clustering center

Next, a novel principle of cluster center selection is used, that is, the points with larger D(x) are more likely to be selected as cluster centers. The above principle is iterated till k clustering centers are selected, after which the above k centers serve as initialized centers of mass.
However, influenced by the distance calculation method of the algorithm itself, the K-means++ algorithm is sensitive to noise points and outliers, resulting in the problem of easy matching errors for relatively large anchor frames still exists. Accordingly, this study introduces the DBSCAN algorithm for equalization, and the DBSCAN algorithm calculates the number of optimal clustering centers based on the density during the operation according to the actual situation of each category. The algorithm is not based on distance metric, but on density metric, so it can effectively overcome the defect of clustering based on Euclidean distance metric, which can only find “circles.” The core idea is to measure the density of the space in which a point is located by the number of neighboring points in its neighborhood, and whenever the density of a point in a region is greater than a certain threshold, it is added to the clusters that are similar to it, so it can find the classes with irregular shapes.
The algorithm starts from a selected core point and continuously expands to the region where the density is reachable, so as to obtain a maximized region containing core points and boundary points, and any bright spot in the region is density connected considering the data set
The DBSCAN algorithm aims to generate the array of markers mi (i =1, 2,…, N).
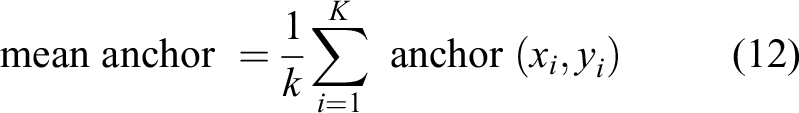
The algorithm in this study takes the advantages of both and fuses them. K-means++ selects the cluster centers more precisely and iteratively selects new cluster centers based on the Euclidean distance, so the sum of the distances from all points to the cluster centers is smaller; the DBSCAN algorithm selects the number of cluster centers more precisely and measures the spatial density of the points by the number of points near the center. The DBSCAN algorithm updates the number of clusters and the coordinates of the cluster centers. Accordingly, the combination of the two algorithms provides a basis for adding more accurate anchor frames based on the characteristics of the detected targets. The algorithm fusion process is illustrated in Figure 2, and the fusion rules developed in this study are presented below. First, the DBSCAN algorithm is adopted to cluster the data set, and the clustering center derived from the clustering is output to K-means++. Subsequently, the algorithm is used to cluster the data set, and the difference between the two clustered anchor frames is obtained; when the difference is greater than the mean anchor, the geometric mean of the two algorithms is taken as the final result; when the difference is less than the mean anchor, the clustering result of the K-means++ algorithm is taken. The mean anchor is expressed as equation (12) (Figure 2)

Flowchart of optimization algorithm.
Algorithm testing
The improvements are tested on the pastoral livestock data set as an example. First, the respective clustering algorithm is used to cluster the grazing livestock data set separately. Since the clustering result of the DBSCAN algorithm is k = 9, other clustering algorithms are selected for the comparison of k = 9 for the consistency of the algorithm comparison. Figure 3 presents the PR curves generated after the test comparison using different weight files, in which the red curve is the PR curve representing the original algorithm. The green and brown curves correspond to the K-means++ algorithm and the DBSCAN algorithm, respectively. The blue curve is the PR curve representing the algorithm in this study.
As depicted in Figure 3, the anchor frame training algorithm based on this study’s clustering method has the highest inflection point compared with other algorithms and almost completely wraps the PR curves of other algorithms, which suggests that the anchor frames obtained by this study’s clustering algorithm are closer to the real frames in prediction, that is, the IOU values are higher, and the accuracy is higher (Figure 3).

PR curve comparison.
Table 1 lists the results of the mean value of the loss function and the algorithm accuracy mAP test.
Model loss function and mAP comparison results.

mAP: mean value of average accuracy.
As revealed by the test results in Table 1, the mAP is higher using this study’s clustering algorithm compared with other algorithms, which suggests that the improved algorithm has higher detection accuracy.
A novel CMA mechanism
The YOLOv4-tiny algorithm significantly reduces the network depth and decreases the parameters to ensure portability, and its parameters are only one-tenth of those of the YOLOv4 algorithm. As a result, the algorithm has low robustness, and the effective features are not sufficiently obvious to affect the recognition accuracy. Thus, attention mechanism should be introduced to increase the recognition accuracy of the algorithm.
Conventional SE channel attention module
Squeeze-and-Excitation Networks aims to model the correlation between different channels (feature maps) and automatically obtain the significance of the feature channels through network learning to reinforce the important features and suppress the nonimportant information. The method is characterized by low complexity and few new parameters, thus having no effect on the portability of the algorithm. Figure 4 illustrates the schematic diagram of the channel attention mechanism.

Squeeze-and-Excitation networks schematic diagram.
As depicted in Figure 4, the channel attention mechanism mainly consists of two parts, including compressing Fsq and exciting Fex. Compressing is to obtain the global compressed feature amount of the current feature map by global level pooling on the feature map layer. Exciting aims to obtain the weights of the respective channel in the feature map by a two-layer fully connected bottleneck structure and then assign the weights to the original feature map, and the weighted feature map is input to the deep network again to extract features. Based on the lightweight network design, the SE channel attention mechanism simply converts the internal channel information into weights by averaging pooling, which does not require too much arithmetic power. As a result, the SE module considers only the internal channel information and ignores the importance of location information, so the SE module algorithm cannot effectively suppress the noise impact of the special lighting environment, and it is less effective when applied to pastoral areas.
A proposed CMA mechanism
To solve the above problems, this study proposes a CMA mechanism which takes the SE channel attention module as the basic unit and introduces it to the average pooled feature channel, the maximum pooled feature channel, and the spatially weighted feature channel, respectively, in a parallel manner. Subsequently, the feature channels are successively weighted in a serial manner. The channel is then weighted in a serial manner and then the residual structure is built for the module. Lastly, add the self-attention layer 21,22 at the end. Compared with the conventional SE attention module, the CMA mechanism effectively introduces the location information while using the channel information. It encodes a wider range of contextual information as the local features to increase its expressiveness, and the combination of maximum pooling channels and average pooling channels more significantly suppresses noise interference, while preserving the features of the target region. The advantage of self-attentiveness is that it can simply obtain global information. Although thermal CNNs can also obtain global information by stacking a large number of convolutional layers, they also consume too many computational resources, resulting in a large number of network parameters. Furthermore, the fusion of different channels makes the information acquired by the deep network more comprehensive and enhances the detection performance. The CMA mechanism inevitably increases a small number of parameters and computational effort, whereas its cost is small. Besides, the effect is significant and the most cost-effective. Figure 5 presents the structure diagram of CMA mechanism. The specific calculation process is illustrated in Figure 5.
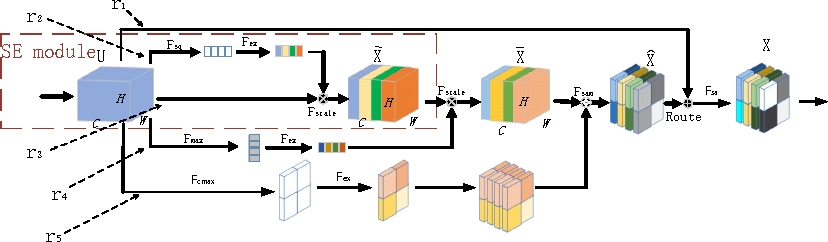
CMA mechanism module.
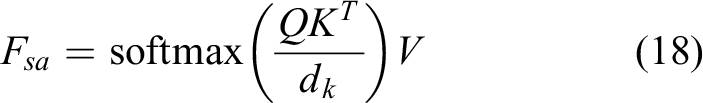
Fsq denotes the average pooling, and the global average pooling is taken to generate the channel statistics to put the global information into the channel descriptor, that is, the statistics z ∈ Rc is generated by the spatial dimension H × W of the compressed output U, where the cth element of zc is expressed as
Fex represents an excited connection, which uses a two-layer convolutional first descending and then ascending fully connected layer and a Sigmoid function to normalize the results of the respective channel. It is calculated as

where δ denotes the Relu activation function and r represents the dimensionality reduction parameter.
Fscale is the scaling transformation, which is expressed as

F
max represents the maximum pooling, and the same as the average pooling takes the channel information and puts it into the channel descriptor, whose statistic

Fc
max denotes the maximum pooling of channels, that is, the maximum pooling along the channel direction for the respective region in the spatial dimension H × W, respectively. Its statistic

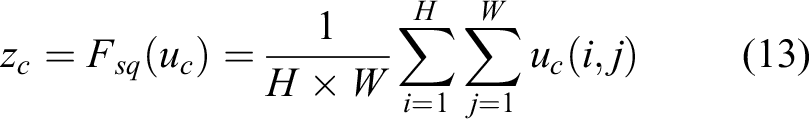
Fsa is the self-attention layer, in which multiple self-attention modules can be added to form multiheaded self-attention. In the multiheaded self-attention mechanism layer, the feature input X is mapped into q, k, v through three matrices WQ, WK, and WV, which represent query, key, and value respectively. the operation of the self-attention mechanism is generally computed for q, k, v. It is calculated as
The multiple heads are reflected in having different WQ, WK, and WV for each head, completing the mapping of feature inputs and performing the above-mentioned self-attention operations to extend the model to learn in different representation spaces.
In this article, the information related to the position in the image is not introduced in the multiheaded 23,24 self-attentive mechanism. Therefore, relative position codes Rh and Rw are introduced to characterize the height and width codes, respectively, as shown in Figure 6.

Schematic diagram of self-attention mechanism.
Algorithm testing
To verify the effectiveness of the algorithm, the CMA strategy is still tested with the grazing livestock data set. The SE attention mechanism module and CMA mechanism module are added to the improved network structure, as illustrated in Figure 1, for training at layer 9, respectively. Figure 7 presents the comparison results of PR curves of the two algorithms and the original YOLOv4-tiny algorithm, in which the red curve represents the original algorithm, the green curve represents the addition of the SE module, and the blue curve represents the addition of the CMA attention mechanism module. As depicted in Figure 7, compared with the original algorithm and the algorithm with the addition of the SE module, the PR curves after the introduction of CMA in this study completely wrap the original algorithm and the algorithm with the addition of the SE module (Figure 7).

PR curve comparison.
Table 2 lists the further calculations of the mean value of the loss function and the algorithm accuracy mAP results.
Model loss function and mAP comparison results.

CMA: compound multichannel attention; mAP: mean value of average accuracy; YOLO: You Only Look Once.
As revealed by the comparison results in Table 2, the loss function and the accuracy of the algorithm are improved after the SE attention mechanism is added, compared with the original algorithm; the detection accuracy is further increased after the CMA mechanism is added. To further demonstrate the advantages of CMA, the following set of images with a considerable of occlusions is selected for comparison (Figure 8). From left to right, the YOLOV4-tiny algorithm, the algorithm for adding the SE module and the algorithm for adding the CMA module are illustrated (Figure 8).

Testing comparison chart.
As revealed by the picture comparison, YOLOV4-tiny misses detection under a considerable number of occlusions, and the detection accuracy increases after the SE module is added. However, it still misses the incomplete targets since the SE channel attention mechanism inevitably loses some information when weighting the channels, while the CMA mechanism avoids the above problem by introducing location information and multichannel composite processing.
Network hierarchy optimization
The YOLOv4-tiny algorithm simplifies the number of layers of CSPDarkNet-53 convolution operation based on YOLOv4, while matching one maximum pooling layer for feature extraction after the convolution operation. Subsequently, the prediction map is output through convolution and upsampling operations, where the convolution layers all comprise BN layer, convolution operation and Leaky ReLU activation function. Detection is adopted to predict large target objects at 13 × 13 scale. Next, upsampling and feature extraction layer 26 × 26 layer features are performed for feature fusion, and small and medium targets are predicted at 26 × 26 scale after convolution. Notably, the simplified YOLOv4-tiny algorithm exhibits good detection accuracy for large and medium-sized targets, whereas the detection performance is low for small targets. This study finds that residual structure lightweighting and multiscale prediction of YOLOv4-tiny can be improved by comparing the features of each layer of the algorithm to enhance its insufficient feature extraction ability in small targets.
Lightweighting of residual structures
To ensure the lightweight of the algorithm while increasing the depth of the algorithm and to achieve the portability of the algorithm while increasing the detection accuracy of the algorithm, this study uses the residual unit proposed by Resnet to optimize the residual unit of the algorithm backbone network and optimize part of the network structure block, as illustrated in Figure 9.

Optimized residual network module.
First, with the input of 104 × 104 × 32 as an example, the input feature map is mapped to a lower dimensional tensor via a 1 × 1 convolutional layer as a mapping layer to avoid the increase of convolutional kernel parameters when the number of input and output channels is large. Subsequently, the features are extracted via a 3 × 3 convolutional layer. Lastly, after the 1 × 1 convolutional layer is added, the output is 104 × 104 × 64, of which the output is the same as the original residual module. However, the number of parameters of the former module is 3 × 3 × 256 × 256 × 2 = 1,179,648, and the parameters of the optimized residual module are only 1 × 1 × 256 × 64 + 3 × 3 × 64 × 64 + 1 × 1 × 64 × 256 = 69,632, with a difference of nearly 17 times. As a result, the latter is capable of reducing the parameters of the convolution kernel and the complexity of the operation. The optimized residual network module almost has no effect on the detection accuracy, whereas it can increase the depth of the network. Moreover, it can reduce the network computational parameters. Thus, the network is also more lightweight.
Multiscale prediction based on feature pyramid network
For CNNs, different depths of convolutional layers correspond to different levels of feature information. The lower layer network exhibits a higher resolution and more specific features, while the higher layer network exhibits a lower resolution and more semantic features. When the target is occluded, only local features of the target are available. Since the shallow convolutional feature perceptual field contains less background noise and is usually more sensitive to target localization and exhibits better representation capability, the shallow feature output layer of the network should be increased to facilitate the recognition of small and occluded targets. In accordance with the idea of feature fusion, the algorithm in this study optimizes the network structure of the YOLOv4-Tiny algorithm by adding an upsampling layer to the original model, connecting the CSP block layer and the upsampling layer in the channel dimension, and increasing the detection scale. The feature pyramid network increases from two prediction scales of 13 × 13 and 26 × 26 to three detection scales of 13 × 13, 26 × 26, and 52 × 52, thus increasing the detection accuracy of the target detection network and ensuring the simplification of the model and the real-time performance of the detection with a slight (nearly 5% on average) increase of the original model computation.
Algorithm testing
The improved advantage is tested on the pastoral livestock data set, and the algorithm is trained and tested by optimizing the residual module and increasing the prediction scale, respectively, and compared with the original algorithm. The PR curves are shown in Figure 10, where the red curve corresponds to the original algorithm, and the green and blue correspond to the improved residual structure and increased output scale, respectively. As depicted in Figure 10, the optimized residual structure reduces the parameters of the algorithm, whereas the PR curves are basically unchanged and overlap with the original algorithm, and the detection accuracy of the algorithm is increased after the increase of the output scale (Figure 10).

PR curve comparison.
Further calculations of the mean value of the loss function and the algorithm accuracy mAP test are listed in Table 3.
Model loss function and mAP comparison results.

mAP: mean value of average accuracy; YOLO: You Only Look Once.
As revealed by the comparison of the results, the number of algorithm parameters decreases by 2.6% after improving only the residual structure, and the detection accuracy decreases by less than 0.01 almost negligible, and the number of algorithm parameters increases by 6.8% after improving the residual structure and increasing the detection scale, but the loss function and detection accuracy are significantly improved compared with the original algorithm.
This is further illustrated using a test comparison chart (Figure 11). From left to right, the above are the YOLOV4-tiny algorithm, the added output scale algorithm, and the improved residual structure with added output scale algorithm. The images containing a large number of small targets and with large distance differences are selected for testing the algorithm (Figure 11).

Testing comparison chart.
From the comparison results in Figure 11, it can be seen that YOLOv4-tiny is less effective in detecting small targets at a distance and increasing the detection scale makes the algorithm more capable of detecting small targets at a distance, and although there are still individual cases of missed detection, it can basically detect the targets more comprehensively and accurately, avoiding key targets from being missed, and is more practical.
Experimental validation of the algorithm
The training environment in this study is NVIDIA GTX 3090 24G graphics card; i9-10900 CPU; CSPDarkNet-53 deep learning framework based on CSP; Cuda11.0, Cudnn8.1.0 acceleration; the model starts the training phase, the weight decay coefficient is 0.0005, the momentum coefficient is 0.9, the batch setting is 128, the initial learning rate is set to 0.0011, the total number of iterations is 20,000, and the learning rate is set to 0.00011 after 16,000 iterations and 0.000011 after 18,000 iterations. The improved algorithm is trained on Ubuntu 18.04 Linux operating system and tested on Jetson AGX Xavier embedded platform.
Test platform
Jetson AGX Xavier serves as the test platform to port and test the algorithms in this study. The module generally covers an 8-core NVIDIA Carmel ARMv8.2 64-bit CPU with support for the parallel computing language CUDA 10, which supports multiprecision computing. 64 Tensor cores, 16 GB 256-bit LPDDR4x, dual deep learning gas pedal engines, NVIDIA vision gas pedal engine, Xavier integrated Volta GPU for superior GPU workstation performance on an embedded module under 30 W. Figure 12 illustrates the testbed.

Physical view of the test platform.
Data set production
The types of livestock in pastoral areas primarily consist of cattle, horses, sheep, and others to make the algorithm more applicable to the target detection of livestock in pastoral areas. This study involves the above three types of livestock mainly kept in pastoral areas, and the data sources generally consist of Coco public data set and self-built data set. The Coco data set contains 3000 images of cattle, horses and sheep, and the data set is expanded by flipping, rotating, cropping, color shifting, changing contrast, etc. To be specific, the training set accounts for 75%, and the validation set accounts for 25%. The images extracted from the Coco public data set have been labeled well enough to be transformed into YOLO format. To ensure the practicality of the algorithm, 900 pictures of cattle, horses and sheep are collected from the grazing area of the Xilamuren grassland in Inner Mongolia as the test set. Furthermore, the test set was manually labeled with LableImg for the target.
Evaluation criteria
The loss function, PR curve, average precision mAP and portability serve as evaluation criteria, in which the loss function and mAP are given by equations (2) and (7), respectively, and the portability is analyzed by three metrics, including the number of algorithm layers, the number of parameters, and the frame rate FPS. The frame rate refers to the number of frames per second that the algorithm detects on the embedded platform Jetson AGX Xavier.
Algorithm testing
To verify the effectiveness of the algorithm in this study, it is compared with YOLOv4, YOLOv4-tiny, and the latest version of YOLOX-S algorithm, respectively. To be specific, Yolov5 25 was released by ultralytics on June 25, 2020. It is a more advanced object detection technology nowadays, with its performance comparable to that of Yolo v4. Moreover, it shows several advantages (e.g., a high reasoning speed). It is divided into four models (including yolov5s, yolov5m, yolov5l, and yolov5x) according to sizes.
YOLOX 26 is based on the YOLO series and absorbs the latest achievements of the target detection academia over the past few years, which is proposed by the Base Detection group of Kuangwei Research Institute combining the advanced achievements of academia and the requirements of engineering practice, and YOLOX-S is its lightweight version. YOLOX is recognized as one of the most novel and effective target detection algorithms.
YOLOv7 27 has been the latest work of YOLO series. This network further increases the detection speed and accuracy based on the previous work.
Figure 13 presents the PR curves generated by the six algorithm models. in which the results of YOLOv4-tiny, YOLOv5S, YOLOX-S, YOLOv7-tiny, E-YOLOv4-tiny, and YOLOv4 algorithms represent red, green, brown, orange, grey, and purple, respectively.

PR curve comparison.
As depicted in Figure 13, YOLOv5S represented by the green curve nearly coincides with YOLOX-S represented by the brown curve, and the two algorithms have the equal detection accuracy, while YOLOv7-tiny algorithm represented by the orange curve is better than the first two, thus suggesting that YOLOv7-tiny algorithm has higher detection accuracy. However, when the test set is full of live photos of pastoral areas, the algorithm in this study obviously has better detection accuracy and higher robustness. It is also more suitable for use in pastoral areas with more disturbance. The PR curve of this algorithm completely wraps the PR curve of YOLOv4-tiny, YOLOv5S, YOLOX-S, and YOLOv7-tiny. Thus, this algorithm outperforms them. Moreover, the figure shows that the accuracy of this algorithm tends to approach that of YOLOv4 algorithm.
Table 4 lists the comparison results of the mean value of loss function and mAP value of the six algorithms, where loss function is the mean value of the overall training loss function, and mAP is calculated from a test set consisting of 900 pictures taken on the Selamuren Grassland.
Model loss function and mAP comparison results.
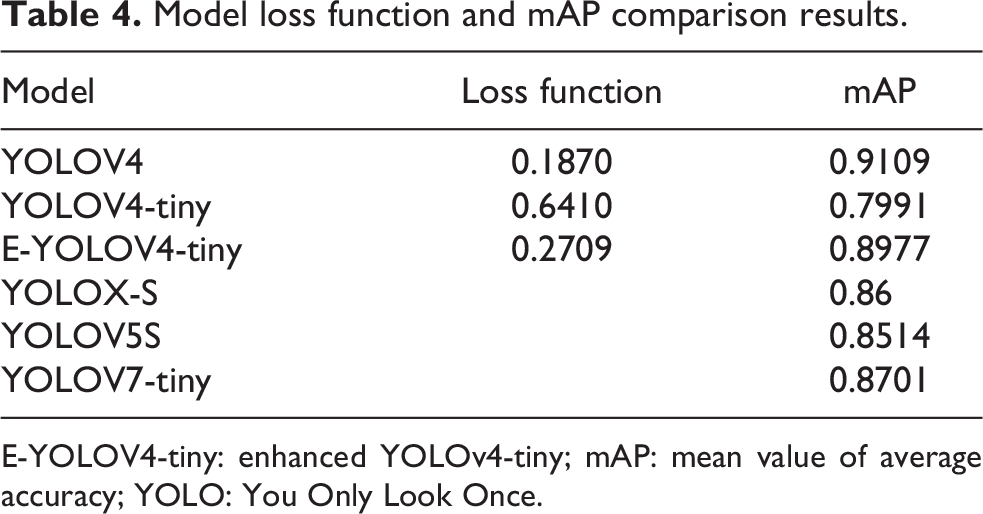
E-YOLOV4-tiny: enhanced YOLOv4-tiny; mAP: mean value of average accuracy; YOLO: You Only Look Once.
As depicted in Table 4, the E-YOLOv4-tiny algorithm proposed in this study has the minimum convergence value of the average loss function for the grassland live shot test set, such that the predicted value of this algorithm is closer to the real value than the original algorithm. The detection accuracy is the closest to YOLOV4, thus indicating the advantages in robustness compared with YOLOv5S, YOLOX-S, and YOLOv7-tiny.
Porting test
Each of the above four algorithms is ported to the embedded platform Jetson AGX Xavier for testing to ensure that the algorithms meet portability while having high detection accuracy.
As depicted in Figure 14, the test results of YOLOv4-tiny, the algorithms in this study, YOLOX-S, YOLOv5S, YOLOv7-tiny, and YOLOv4 for detecting cattle, horses, and sheep, respectively, in different scenes, where each row is a group and each column is the same detection method. The cases of small targets, when blocking light, and when livestock block each other are included (Figure 14).

Livestock target detection performance comparison.
Figures 14 and 15 show that the lightweight requirement leads to the YOLOV4-tiny algorithm in the detection of target leakage often occurs. For instance, the first picture in Figure 14 will be a small target in the distance cattle missed detection. To be specific, YOLOv7-tiny algorithm has high detection accuracy, whereas it has the case of false detection of remote small targets. When the light is blocked by the same, missed detection will occur. For instance, the second picture on the left side of the horse is missed detection. For this case with most occlusion, this algorithm outperforms recent algorithms (e.g., YOLOX-S, YOLOv5S, and YOLOv7-tiny) in the detection accuracy. The third picture will be other targets blocked by the sheep missed detection. It is therefore demonstrated that the original algorithm has low detection accuracy, which will lead to greater errors in practical applications. Figure 14 indicate that the detection effect of YOLOX-S and the algorithm in this study are not significantly different, and both have high accuracy and are almost close to the YOLOV4 algorithm.
The detection results of YOLOv4-tiny, the algorithm in this study, YOLOX-S, YOLOv5S, YOLOv7-tiny, and YOLOv4 are presented in Figure 15, where each row represents a group, and each column represents the same detection method. The cases include incomplete body shots (e.g., lying down, special lighting conditions in the evening, and multiple targets at the same time) (Figure 15).

Livestock target detection performance comparison.
As revealed by the first picture in Figure 15(a), the problem of missed detection is more serious for small targets in YOLOv4-tiny algorithm due to lying down and other postures, and it is easy to have missed detection under dim light conditions (e.g., evening), which will lead to the failure of the algorithm in practical applications. As depicted in the first figure, YOLOv5S and YOLOv7-tiny have missed detection for targets with more occlusion. The second picture suggests that the algorithm in this study still has the optimal accuracy performance under poor evening light. As indicated in the third picture, false detection occurs when considerable different types of targets are mixed in YOLOX-S algorithm, whereas the algorithm in this study is able to detect them, the algorithm in this study can significantly reduce the false detection rate by focusing the attention mechanism to ensure the detection rate of small targets, and the false detection rate of this algorithm is the lowest compared with YOLOX-S, YOLOv5S, YOLOv7-tiny, and YOLOv4 algorithms (Figure 16).

Livestock target detection performance comparison.
It can be seen from Figure 16 that affected by different lighting conditions in the morning, the middle and the evening, for the occluded targets, as shown in Figure 16, the first group of pictures, the second group of pictures, and the distant small targets, as shown in Figure 16, the missed detection problem of YOLOv4-tiny algorithm is more serious. Under these lighting conditions, the detection accuracy of YOLOv5S and YOLOv7-tiny algorithms is greatly reduced, it can be seen from Figure 16 that YOLOX-S is also greatly affected. In groups 1–3, the chicken was detected as sheep by mistake and missed. It can be seen from Figure 16 that this algorithm greatly reduces the impact of this problem due to the addition of CMA mechanism. Compared with YOLOv4-tiny, YOLOX-S, YOLOv5S, and YOLOv7-tiny, this algorithm has stronger robustness. It has the accuracy closest to that of yoov4 algorithm under different backgrounds and has high detection accuracy for large and small targets.
Table 5 lists the results of comparing the number of convolution layers, number of parameters, and frame rate of the respective algorithm running on the embedded platform Jetson AGX Xavier.
Comparison results of model layers, size, and frame rate.

As depicted in Table 5, the algorithm in this study is very close to YOLOv4-tiny in terms of the number of parameters and frame rate, and both are better than YOLOX-S, which suggests that the algorithm has a better lightweight structure and is suitable for porting and running in embedded systems. Although there is a certain increase in the number of layers of the algorithm, it does not significantly affect the overall operation of the algorithm. As revealed by the analysis, the above advantages are mainly due to the addition of the CMA mechanism, the improvement of the residual module and the increase of the prediction output scale, thus making the algorithm exhibit a lightweight structure and a performance close to that of YOLOv4. It is therefore suggested that YOLOv5S and YOLOv7-tiny algorithms, which are characterized by high frame rates, perform very well in frame rates. They have better frame rates when the weight of the algorithm is similar to that of the algorithm in this study. However, it is considered to be a coherent video visually if the frame rate is higher than 13 frames. Therefore, it is smooth enough for the proposed algorithm to reach 30 frames. As depicted in Figures 14 –16, the proposed algorithm has better robustness, and its detection accuracy is higher than that of YOLOX-S, YOLOv5S, and YOLOv7-tiny when the light is dark, bright, occluded, and there are considerable clusters. As a result, the algorithm has better cost performance and meets the embedded requirements.
Conclusion
An enhanced lightweight target detection algorithm based on YOLOv4-tiny is proposed by fully considering livestock target characteristics and unique environmental factors in pastoral areas, while ensuring portability. The algorithm incorporates a novel CMA mechanism in the backbone network part to increase the detection accuracy of the algorithm for small targets and targets with partially obscured features, as well as to suppress the interference of picture noise formed by complex lighting conditions and high winds on the detection. In the backbone network part, the residual structure is improved to simplify the computation of the convolutional layer of the algorithm. In the feature fusion part, a pyramid network is adopted for multiscale feature fusion to fuse shallow feature information with deep semantic information, and a 52 × 52 ratio prediction output is added to enhance the comprehensive detection performance for large and small livestock targets in pasture areas. Lastly, the clustering algorithm is optimized to deal with the increase of output scale, so as to effectively increase the detection accuracy of the model. As revealed by the actual embedded system test, the improved algorithm achieves 89.77% detection accuracy, which is 11.67% higher compared with the original algorithm, and the detection speed reaches 30 frames/second, which satisfies the portability and has a better application value than YOLOX-S with higher detection accuracy under special lighting conditions (e.g., morning and evening, and better algorithm robustness). Subsequent research will focus on enhancing the robustness of the algorithm on the premise of ensuring portability. With the introduction of depth separable convolution, the network depth is increased by ensuring portability, such that it can more effectively solve the detection problem when a considerable number of targets appear at the same time. Furthermore, it is also possible to combine the detection capabilities of the YOLO algorithm with other algorithms, such as simultaneous localization and mapping, 28 which can effectively identify object categories and thereby provide the robot with more object-named-based capabilities.
Footnotes
Declaration of conflicting interests
The author(s) declared no potential conflicts of interest with respect to the research, authorship, and/or publication of this article.
Funding
The author(s) disclosed receipt of the following financial support for the research, authorship, and/or publication of this article: This work was supported by the National Natural Science Foundation of China (61763037); Inner Mongolia Key Laboratory of Electromechanical Control (IMMEC2020001); Inner Mongolia Science and Technology Program (2021GG164); Inner Mongolia Natural Science Foundation (2021MS06018).