
Abstract
Absolute visual localization is of significant importance for unmanned aerial vehicles when the satellite-based localization system is not available. With the rapid evolution in the field of deep learning, the real-time visual detection and tracking of landmarks by an unmanned aerial vehicle could be implemented onboard. This study demonstrates a landmark-based visual localization framework for unmanned aerial vehicles flying at low altitudes. YOLOv5 and DeepSORT are used for multi-object detection and tracking, respectively. The unmanned aerial vehicle localization is achieved according to the geometric similarity between the geotagged transmission towers and the annotated images captured by a monocular camera. The validation is accomplished both in the Rflysim-based simulation and the quadrotor-based real flight. The localization precision is about 10 m, and the location update frequency reaches 5 Hz with a commercially available entry-level edge artificial intelligence platform. The proposed visual localization strategy needs no satellite image as a reference map, which saves a significant amount of the GPU memory and makes possible the end-to-end implementation on small unmanned aerial vehicles.
Introduction
Nowadays, small-sized unmanned aerial vehicles (UAVs) are becoming popular solutions for expanding military and civilian applications. Application of UAVs emerged in scenarios like military and defense, 1,2 post-disaster assessment, 3 infrastructure inspection, 4 precision agriculture, 5 flight testing, 6 and so on. To navigate autonomously, UAVs in these applications depend highly on the Global Navigation Satellite System (GNSS), such as GPS and Beidou, to acquire their locations. However, signals from GNSS satellites could be degraded when it is close to vegetation, water bodies, hostile environment, and inside structures. 7 These situations would make it impossible to get precise latitude and longitude estimates of the UAV during flight. An auxiliary or redundant localization approach is needed to ensure the UAV navigation when it fails to receive the GNSS signals.
Taking no account of the GNSS system, common sensors capable of ranging and supporting the localization system on a UAV include cameras, radar, and Light Detection and Ranging (LiDAR). Cameras of various types could be used to establish a vision-based localization system. Stereoscopic cameras and depth cameras already have reliable UAV distancing applications. 8 However, their limited range 9,10 makes their localization confined to indoor or short-distance scenarios. Radar and LiDAR are common ranging sensors, but their size, weight, cost, and power consumption make them more suitable for large-scale UAVs. 11 The monocular camera could be the cheapest among these sensors, but the limitation is that the ranging information is not directly measured. In this study, a sophisticated vision-based localization framework is explored using a monocular camera.
In vision-based UAV localization, two main approaches are comprised: relative visual localization (RVL) and absolute visual localization (AVL). The essential difference between these two approaches is whether the visual localization is accomplished by matching from frame to frame or from frame to reference. Popular RVL methods include visual odometry (VO) 12 and simultaneous localization and mapping (SLAM). 13 The core issue with RVL is similar to localization solely with the inertial measurement unit (IMU), namely the accumulation of error makes the localization drift over time. Although SLAM outperforms VO by mitigating the drift problem with bundle adjustment and loop closure detection, localization with long distance still needs regular correction by absolute localization information.
A state-of-the-art review of the AVL for UAV is given by Couturier and Akhloufi. 14 AVL is inherently immune to overtime drift since precisely geo-referenced information is used during localization. According to Couturier and Akhloufi, 14 major AVL methods can be divided into template matching, feature point matching, deep learning, and modified VO based on their matching mechanism. Template matching 15 is directly using the UAV image as a template to search in a reference map. In contrast, feature point matching 16 detects the feature points in the UAV image first and localizes through descriptor extraction from the reference image. Deep learning 17 uses a convolutional neural network (CNN)-based computer vision to deal with the feature extraction and the matching problem. VO could also be used for AVL when the reference map is a set of preexisting frames with location information. 18,19 The essential localization scheme in this study is based on deep learning.
The major deep learning tools used in this study are You Only Look Once (YOLO) 20 and DeepSORT. 21 YOLO is used for multi-object detection and DeepSORT is used for multi-object tracking from video frames. These two methods are recently developed and could be implemented in UAVs for edge computation. They have already demonstrated their reliability on applications such as UAV surveillance, 22 autonomous vehicles, 23 monitoring COVID-19 social distancing, 24 and droplet tracking in fluid mechanics. 25 In this study, the combination of YOLO and DeepSORT is used to detect and track the transmission towers as landmarks. The landmarks’ geometric information is extracted from images as bounding boxes and compared with the dimension and geo-locations of the preexisting landmarks, by which the UAV location is estimated. We validate this localization framework in simulation and a real flight experiment, respectively. It turns out that this framework could achieve real-time onboard localization with precision comparable to the GPS.
Related work
Deep learning-based AVL for UAV
Although deep learning methods have caused a widespread sensation in the field of robotics, application in AVL for UAVs is still in its infancy. 14 The difficulty rests in building an end-to-end architecture for localization since the computing resources are confined by the limited onboard load capacity. In addition, the size of the reference map with an acceptable resolution is always beyond the limitation of the GPU memory, making the manipulations of real-time matching impractical. Several studies have made efforts in this field, and we put it below to introduce the motivation of the current study.
Amer et al. 26 and Mughal et al. 27 used the deep architecture to extract the “Deep Signature” from the aerial imagery based on the unique visual appearance of the architecture and landscape style. Such information was then identified in a preordained and geotagged image, and the localization was performed. Nassar et al. 28 and Marcu et al. 29 performed aerial image semantic segmentation using deep learning, and the semantic shape was matched to realize localization. Goforth and Lucey 18 combined deep learning and VO inside an optimization framework, where the reference map is put in VO acting like a neighboring frame, and thus, the localization is accomplished. Other UAV localization strategies based on deep learning include using conditional generative adversarial network, 30 deep reinforcement learning, 31 and more information can be found in the literature. 14,32
Most of these AVL methods take advantage of deep learning to match the extracted visual features of the landscape with a generalized map. Only by comparing the abstracted features from both the input image and the reference map, could a lightweight, real-time, and vision-based localization framework be accomplished. The proposed method also follows this essential routine, and the real-time UAV localization has been implemented onboard without a reference map from the satellite image.
Landmark-based AVL for UAV
Landmarks are conspicuous objects which can mark locality. Landmark-based localization has already been applied in UAV applications. 33,34 However, when it comes to AVL, most strategies are based on maps to get latitude and longitude in a larger region. Many methods provide UAVs with satellite or aerial imagery as a map before flight, which is used to perform template matching to realize localization. 7,26 –29 The challenge is that the matching might fail due to the changing image-capturing conditions, such as seasonal and perspective changes. 18 Even though the deep learning tools can make generalizations for the changed features, training the CNN to remember all the reference maps accurately is impractical due to the limited GPU memory size. 14 In addition, it is also worth noting that UAV needs to fly at a favorable altitude to acquire images with a resolution comparable to the reference map, which might disable UAVs from conducting AVL at a lower altitude.
Landmark-based AVL has many advantages. Firstly, AVL by landmark enables the UAV to be self-aware of its surroundings, which is consistent with human navigation intuitively and beneficial to autonomous obstacle avoidance due to the enhanced perception of the surrounding hazards. Secondly, AVL by landmarks takes much fewer memory resources than saving high-resolution map images since only the learned feature parameters and the location parameters need to be stored. Considering the generalization capability of deep learning, storage occupancy for the landmarks of the same class is even less. Thirdly, AVL by landmarks could utilize the side view of the landmarks to extract more significant features, making it a useful alternative strategy when the flat-world assumption 35 is not valid and the planar homography is unavailable for localization.
The transmission tower is one of the competitive landmark candidates for AVL of UAVs. Their height is comparable to low-altitude UAVs, and they have conspicuous visual features which are easy to detect by computer vision. 36,37 Hui et al. 38 used transmission towers as landmarks to navigate the UAV for power line inspection. Schofield et al. 39 developed an algorithm for transmission tower detection to navigate the drone to a safe distance around towers within the power grid. In this study, the proposed localization framework mainly depends on the transmission towers as landmarks. Other vision-based landmarks could be selected as wind turbines, 40 natural vegetation, 41 and buildings. 42 Taking advantage of the extended infrastructure coverage, once equipped with an AVL system, UAV path planning and navigation over a long distance is made possible when a series of landmarks have been appropriately selected.
Contribution
We introduce a localization framework suitable for small UAVs flying at a relatively low altitude when the flat-world assumption no longer holds. In this case, UAVs fly at a height comparable to the heights of the landmarks, and the visual features from the camera’s downward view are too limited to be matched with the satellite map. It is a method localizing more like humans, in that it depends mainly on recognizing and distancing typical landmarks which are previously remembered.
This method needs no satellite image as a reference map. Instead, only the landmarks’ location and their geometric size are required, which could save a large amount of GPU memory. The unified landmark appearance also results in a small data set while learning the features. Typical landmarks could be selected as transmission towers, light poles, wind turbines, and other upright and thin infrastructure. UAVs could locate themselves among landmarks as long as the consecutively appeared landmarks have been registered.
Our method could realize vision-based UAV localization in real-time. With the deep learning tools like YOLO and DeepSORT, we built an end-to-end AVL architecture for UAVs. The frequency of localization reaches 5 Hz, as demonstrated during a flight in this study. It is also a lightweighted system that requires only a front-facing monocular RGB camera, an onboard computer implementing landmark detection and tracking, and the preexisting landmark information. In addition, it costs much less than the LiDAR-based localization system, which is friendly to most small UAVs in typical GNSS-denied scenarios.
Organization
The remainder of the article is structured as follows. The methodology introducing detection, tracking, and localization is presented in the second section. Details of the implementation of the simulation and the experiment are described in the third section. Results from the simulation part and the experimental part are presented in the fourth section. Discussion is given in the fifth section. Finally, the conclusions are summarized in the sixth section.
Methodology
General process
In this study, the UAV gets its location by analyzing the video stream captured by its monocular camera. The localization framework mainly includes three parts, namely object detection, object tracking, and localization, as shown in Figure 1. We take YOLOv5 and DeepSORT to realize object detection and object tracking, respectively. Finally, the UAV’s location is acquired through a so-called localization by landmarks (LbL) process. In this section, we introduce these three modules separately.

Overview of the localization framework.
Object detection
YOLO is a state-of-the-art object detection algorithm that has been widely used in the community. The original YOLO algorithm is given in 2015 20 and it has been continuously optimized ever since. 43 YOLOv1 20 is known for its unique target recognition characteristics which use a single network to complete the bounding box labeling and the object class prediction. The drawbacks of YOLOv1 rest in the poor generalization ability and the low localization accuracy. YOLOv2 44 proposed a new backbone network as Darknet-19 to overcome these drawbacks. Other improvements introduced by YOLOv2 include batch normalization, high-resolution classifier, convolution with anchor boxes, direct location prediction, and multi-scale training, based on which the detection accuracy and speed have been increased. YOLOv3 45 applies the Darknet-53 instead of the Darknet-19, which effectively improves the network’s ability to extract image features, leading to the upgrade of the recognition accuracy. In addition, since YOLOv3 outputs three different scales of feature maps to detect targets of different sizes, the performance of small object detection is even better. YOLOv4 46 uses the CSPDarknet53 in the backbone network. The feature mapping of the base layer is firstly divided into two parts and then combined through a cross-stage hierarchy, which not only reduces the amount of computation but also ensures the accuracy of the model. The introduction of the development process from YOLOv1 to YOLOv5 could be referred to literature 43 in detail.
In this study, YOLOv5 47 has been used to complete the object detection tasks. A detailed picture explaining the network architecture of YOLOv5 could be found in the study by Glenn. 47 YOLOv5’s network structure can be divided into three parts, namely the backbone, neck, and head. The backbone part majorly uses the Focus and CSP structures. The Focus structure is a slice operation that concentrates the plane information into the channel space without the information loss, making the feature extraction more sufficient. The CSP structure comes from the Cross Stage Partial Network 47 which solves the problem of a large amount of computation during reasoning. The neck part introduces a multi-scale prediction mechanism comprised of the feature pyramid networks (FPN) and the path aggregation network (PAN) structures, which could enhance the feature fusion of different layers of the feature pyramid from top to bottom and from bottom to top, respectively. The head part makes the final predictions by implementing basic convolution manipulations to the neck’s outputs. To further improve the detection performance, operations like mosaic data augmentation, adaptive anchor box calculation, and adaptive image scaling have been made before applying the network to the image input. 47 Compared with the previous versions, YOLOv5 has the advantages of a smaller model scale, lower deployment cost, higher flexibility, and faster detection speed. 47
Version 5.0 of YOLOv5 is used and it has four different network structures: s, m, l, and x. 47 These networks have similar structures differing majorly in two parameters: depth_multiple and width_multiple. With the increase of these two parameters, the s, m, l, and x networks have an increasing structure complexity as well as an improving AP accuracy. More complicated networks tend to detect more small targets at the expense of the lowered detection speed. 47 As a result, the selection of the network structure needs to be thoroughly weighed according to the target size and the detection speed, which is determined by the task of real-time localization and the capability of the onboard processor. YOLOv5 has been tested on the Microsoft Common Object in Context (MS COCO) data set, which is one of the most popular large-scale object detection, segmentation, key-point detection, and captioning data set available for public use. 48 It shows that the performance of YOLOv5-s, m, x could fully span the variance of the COCO AP values and the performance of YOLOv5-l is a compromise of YOLOv5-m and YOLOv5-x. 47 As a result, this study mainly compares the YOLOv5-s, m, x when detecting the landmarks for localization.
Object tracking
Simple Online and Realtime Tracking (SORT) 49 is an algorithm that tracks detected objects between two successive frames. The SORT algorithm solves the multiple object tracking problems focusing on an efficient association of objects for online and real-time applications. Key components of SORT include detection, object state propagation, ID association, and life span managing of tracked objects. 44 High-quality detection is of fundamental importance in the first step of tracking. Motion model with Kalman filter is then involved to estimate and propagate target identities within frames. The ID assignment is optimally solved using the Hungarian algorithm according to the IoU distance, which is the intersection-over-union distance between each detection and all predicted bounding boxes from the existing targets. Finally, tracking identities are created or destroyed when objects enter and leave the image. 44 Due to its simplicity and efficiency, multiple objects could be detected by this fast and accurate tracker, which could provide a state-of-the-art tracking solution for onboard UAV target tracking scenarios.
DeepSORT 21 is an algorithm that improves the performance of the SORT. It turns out that SORT would return a relatively high number of identity switches, which has a deficiency when tracking through occlusions. 21 DeepSORT overcomes this problem by additionally integrating CNN into the framework, introducing a more informed association metric combining motion and appearance information. The motion information is evaluated by the Mahalanobis distance between predicted Kalman states and new measurements. The appearance information is evaluated by the cosine distance of the appearance descriptor between the previous tracks and current detections. 21 With decreased misses and mismatches, DeepSORT is preferred since it maintains the system applicable to online scenarios.
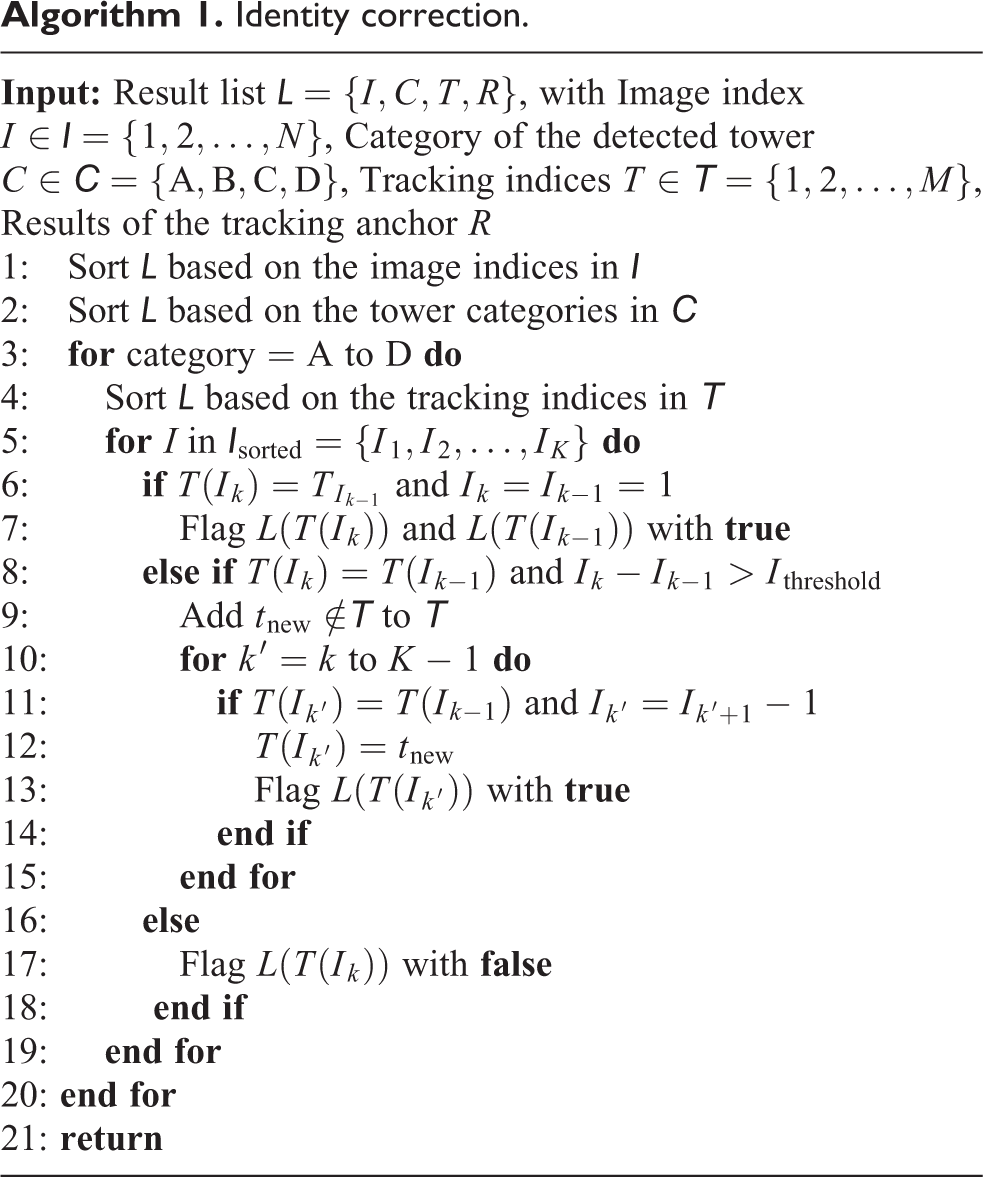
In this study, the detection and tracking of standard landmarks like transmission towers are of interest for UAV localization. However, these objects always share a unified appearance, which gives rise to severe mismatching when associating their identities. As a result, directly introducing SORT or DeepSORT could lead to the following problems. Firstly, SORT encounters tremendous identity switches and misses 50 in this case since unique object features from the unified tower models could hardly be captured within and between frames. Secondly, DeepSORT tends to mistakenly reidentify new towers with previously allocated identifications. DeepSORT gets into this side effect when trying to discriminate the reappeared objects in the large-scale reidentification data set. 21,50 These problems need to be solved with a more sophisticated strategy when allocating the object identities. This study evaluates and compares SORT and DeepSORT in the UAV transmission tower tracking scenario. A timeline-based identity correction algorithm is applied so that newly appeared towers would not be assigned a previous identification.
As shown in Algorithm 1, the identity correction algorithm is conceived according to the continuity of the landmark appearance during a stable flight. It can easily eliminate the sporadic tracking IDs, which are majorly assigned to the false positive targets. In addition, it is applicable especially for the one-way flight path when the uniformed landmarks majorly appear once so that the reappeared tracking IDs could be allocated with a new ID and the mismatching is avoided. After the identity correction process, the randomly allocated IDs from DeepSORT are ensured as true tracking IDs, which means the same landmark would only be assigned with the same ID. These tracking IDs are preliminary IDs that could be easily correlated with the real landmark identities according to their landmark categories, order of appearance, and the landmark distance (or the size of the bounding box) when several landmarks appeared in the same frame.
Identity correction.
Localization by landmarks
After landmark detection and tracking, landmark information to calculate the UAV locations in each frame of the video has been prepared. A localization model is constructed here in three-dimensional (3-D) space and the perspective relationship is taken into account. As shown in Figure 2, three coordinate frames are defined: the global inertial frame

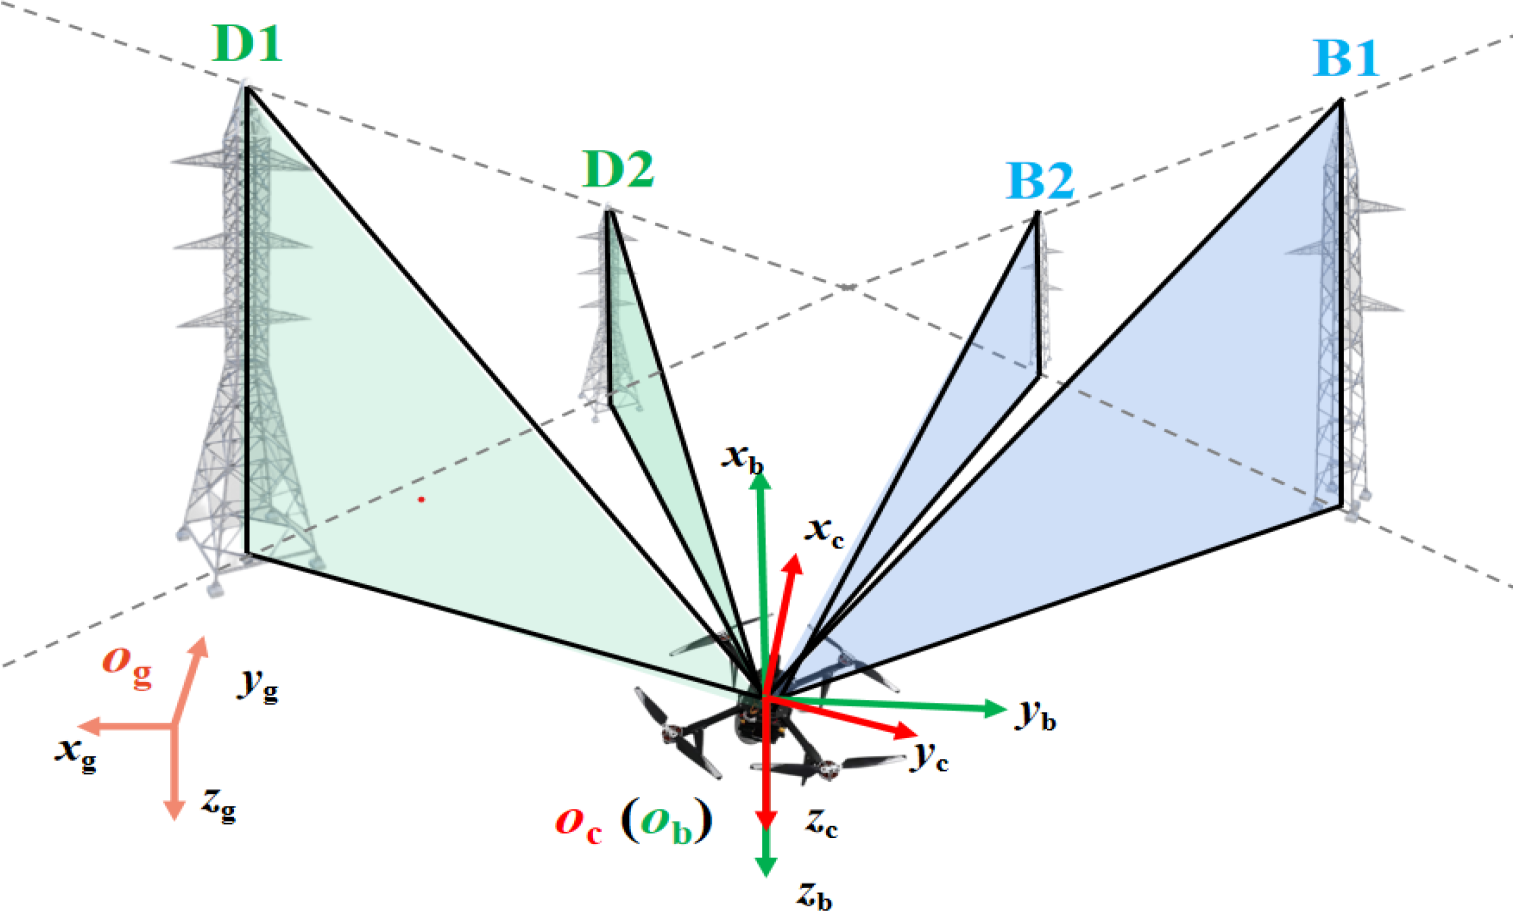
One scenery during localization showing with the definition of the coordinate frames.
It is evident that

In this study, we are looking for the global location of the UAV, that is

Here
After processing of the object detection module and the object tracking module, the four transmission towers are correctly recognized. Here, we make the assumption that the position of the UAV is approximately known when it is capturing the initial frame. This is a reasonable assumption in real applications, even in a GNSS-denied flight, where the accurate or approximate GNSS data at the takeoff position are known. The correct identification of the transmission towers is ensured iteratively by this initial condition.
As shown at the top of Figure 3, a sample image captured from the scenery in Figure 2 is provided with the tracking anchors noted on the transmission towers. Each transmission tower provides the height of the bounding box h and the bounding box deviation e from the vertical image centerline. The image’s centerline lies in the direction of the

The localization by landmark model. An image captured from the scene in Figure 2 with tracking anchor information noted (top); geometric similarity of the parameters (lower left); geometric relation between the landmarks and the UAV (lower right). UAV: unmanned aerial vehicle; LbL: localization by landmark.
The geometric similarity of the parameters is depicted at the lower left of Figure 3. Taking the horizontal plane and the landmark B1’s projection plane as an example, the relations from geometric similarity are presented as

where H is the landmark height, E is the landmark deviation from the
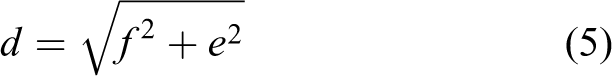
with f is the focal length of the camera. The focal length f is known either from the lens parameters or from the intrinsic parameters attained from the calibration process. It is worth noting that f should be converted to the unit of pixel to take part in the calculations with h and e. In this LbL model, H is measured prior to flight and saved onboard as landmark information. As a result, the only two unknown parameters E and D from the geometric similarity equation can be calculated by

After getting E and D, the landmark coordinates in the camera frame can be calculated as

Putting
Implementation
Simulation
The simulation is conducted on the Rflysim 51 platform, which is efficient in developing a fully functional simulation environment for the UAV model. The scenes with landmarks are constructed using the popular 3D engine, Unreal Engine 4, to ensure fidelity in visual scene rendering. The model of the electric transmission tower is commercially available in the Epic Games marketplace. As shown in Figure 4, four types of typical transmission towers with steel lattices are used as landmarks.

Four types of transmission towers as the landmarks in simulation.
Multiple transmission towers are allocated on a flat plate of size 1000 m × 500 m, and the general layout is shown in Figure 5. There are 18 transmission towers in total, which are noted with their type and identity separately. Each of the transmission towers is also provided with its global position info (

The distribution and IDs of the landmarks in simulation.
Experiment
To implement the localization framework in practice, a self-assembled SFR 450 frame quadrotor is employed as the test platform (as shown in Figure 6). The Nora Autopilot with PX4 is used as the flight controller. The CUAV P9 radio is used as the datalink to communicate with the ground station. A front-view monocular camera is fixed with the UAV for detection and tracking. It is equipped with the real-time kinematic (RTK) differential GPS with an accuracy of 0.02 m, which provides the reference to check the vision localization results. NVIDIA Jetson Nano is used as the embedded processor. It has a high-performance graphics processing unit responsible for the visual detection–tracking–localization framework. The modules of YOLOv5-s, DeepSORT, LbL, and off-board control are used as the software packages. The robot operating system (ROS) runs on the Ubuntu 18.04 OS while the sensor information and the control command are exchanged via ROS topics.

The quadrotor test platform.
During the flight test, the UAV is flying with a path planned on the ground station associated with autopilot and the RTK GPS is enabled. Simultaneously, the detection–tracking–localization framework is automatically initialized and running until the end of the flight. The localization results are finally downloaded and compared with the position information from the flight log.
Training
Three scales of YOLOv5 are trained to identify the electric tower targets in the image. For training the YOLO models, we only use the simple data augmentation pipeline left–right flipping to expand the number of images to more than 300. According to the ratio of 8:1:1, images are divided into the training set, the validation set, and the test set. LabelImg is used to complete the data set annotation. The annotated information includes the target category information and the location information of the annotated box (top left point and bottom right point coordinates). When we are labeling, the upper end of annotated box should be as close to the tower top as possible, and the lower end should pass the diagonal intersection of the tower base.
In the object detection experiments, the default hyper-parameters are set as follows: the global batch size is 6, and the learning rate is initialized as 0.001; Adam optimizer with the momentum coefficient of 0.9 and weight decay of
The generalized metric mean Average Precision (mAP) is used to measure the performance of detection models. All categories’ Average Precision (AP) values are averaged to obtain the mAP for a specific method. AP is the area under the Precision–Recall curve where Precision and Recall are defined as


True Positive (TP), False Positive (FP), and False Negative (FN) respectively correspond to object correctly detected, background mistakenly detected as an object, and object not detected. By training the YOLOv5 model, we can successfully detect the landmarks in the video stream. Then complete the follow-up target tracking and a series of work.
Results
Simulation results
Detection
The simulation results are used to compare the three different versions (s, m, x) of YOLOv5. The detection results for the same frame are presented in Figure 7. Multiple transmission towers close to the UAV have been detected, and the bounding boxes are annotated with the tower type and the corresponding classification accuracy. It turns out that all three detection schemes could correctly recognize and classify the four types of towers. However, the m and x versions have relatively higher detection confidence, while the version s detected more distant smaller towers, even though the corresponding bounding box confidence is lower.

Comparison of the detection results of transmission towers on the simulated data set.
To quantify the performance of the three different detection schemes, the general detection statistics from the testing set have been presented in Table 1. The s, m, and x detection schemes have an increasing mAP. YOLOv5-x almost has the best detection performance for any metric, which is owing to the fact that it has the most sophisticated network. It is noted that the precision and recall of YOLOv5-s are acceptable considering its light-scale network.
Performance comparison of the transmission tower detection schemes.

mAP: mean Average Precision.
The performance of the detection schemes is further compared according to the four types of transmission towers. The P-R curves are presented in Figure 8. The three detection schemes have similar P-R curves for the type A and type B towers, which are closer to the UAV in the x direction. Differences majorly come from the P-R curves of type C and type D transmission towers, where YOLOv5-x has the best overall performance, and YOLOv5-s’s performance is relatively poorer. The reason for this phenomenon is that type C and type D towers locate further to the UAV, and they are more likely blocked by the other two types of towers since the flight path is in the middle. In this case, the more sophisticated network tends to maintain a higher Recall even if the given Precision is high.
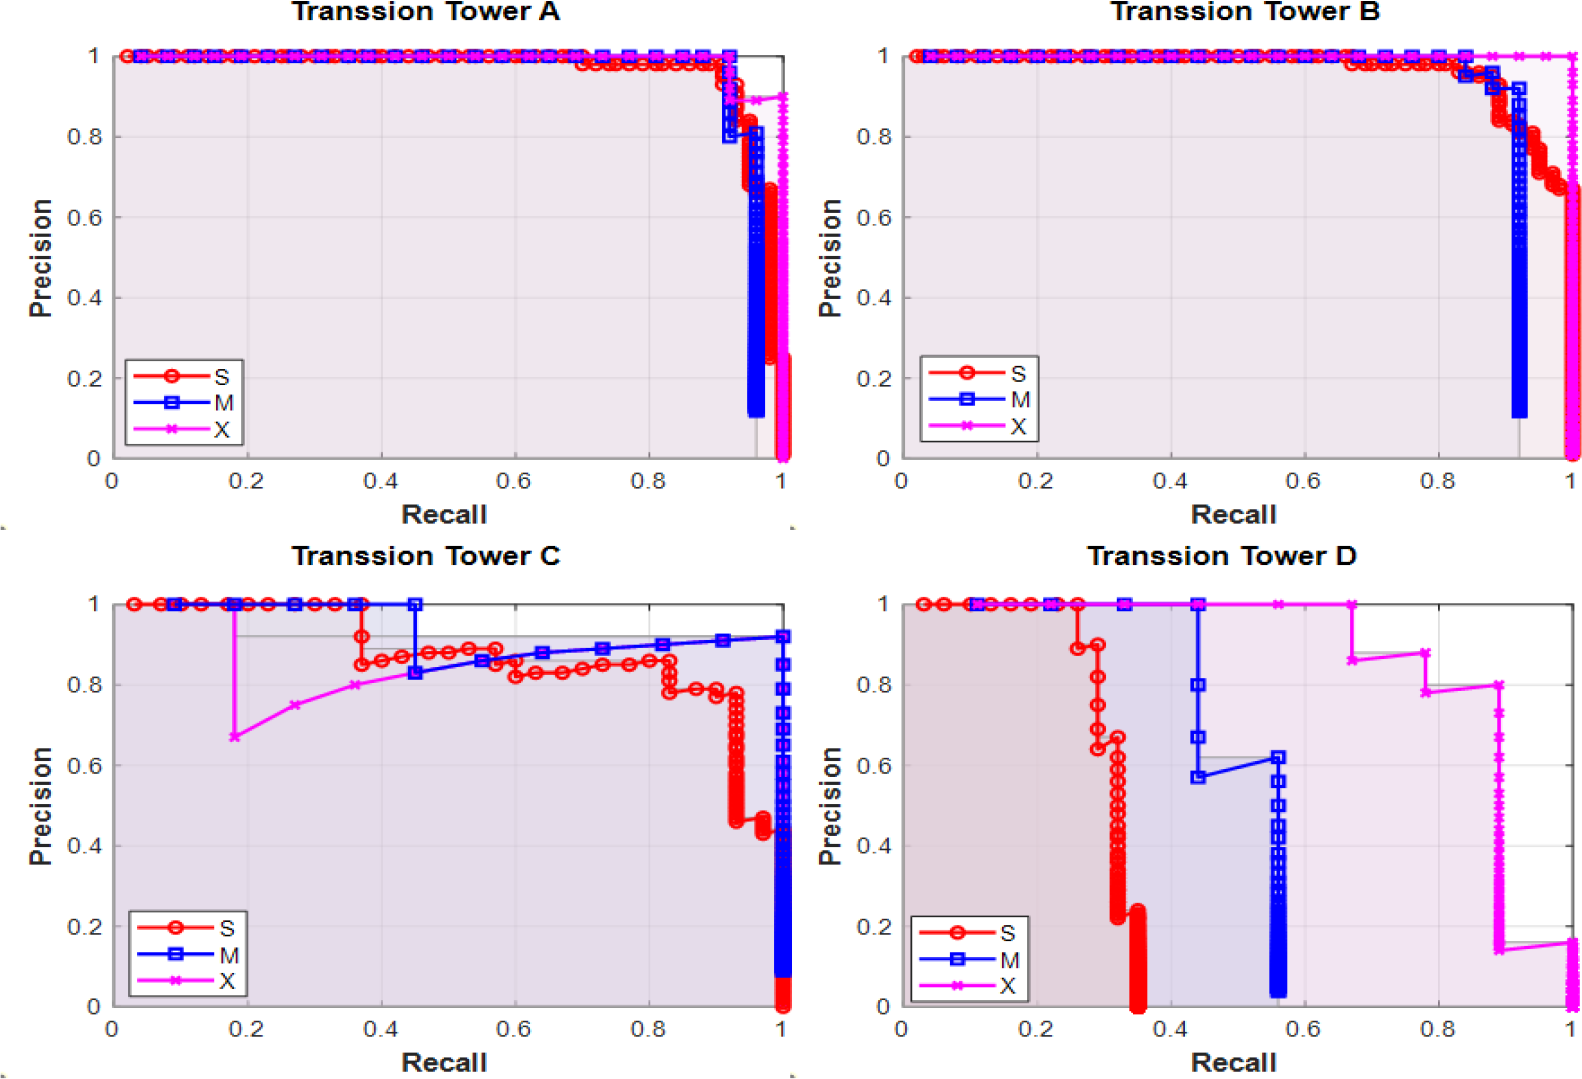
Comparison of P-R curves for the detection of the transmission towers on the simulated data set.
Tracking
The tracking performance is compared between DeepSORT and SORT both using YOLOv5-s and YOLOv5-x based on the simulated data set. Taking the result from DeepSORT + YOLOv5-s as an example, Figure 9 presents the direct output of the tracker. The transmission towers could be assigned with their categories and tracking IDs. Multiple towers are recognized in each frame from the time series, marked by their bounding boxes. A detailed list

Tracking results with DeepSORT + YOLOv5-s on the simulated data set.
The tracking indices of the transmission towers are presented in Figure 10. The list indices have been sorted according to image indices I and tower category C. The correct tower identities are noted above the lines with randomly generated tracking ID numbers by checking the result images. On the one hand, the same tracking indices could be allocated to different towers repeatedly. As shown in Figure 10, the wrongly tracked tower identities, such as B4, B5, C4, C5, D4, are noted in red. Taking the case of B4 and B5 from DeepSORT with YOLOv5-s as an example, these towers are repetitively assigned with tracking IDs of 5 and 9 as shown in Figure 9 at I = 100. It is because they are mismatched with B1 and B2 from Figure 9 at I = 10 due to their same appearance after B1 and B2 disappear from the view. On the other hand, tracking ID of the same tower from SORT would hop from multiple numbers, indicating that SORT frequently mismatch the same tower from different frames. This causes the count of the different tracking indices from DeepSORT being much less than that from SORT. However, the tracking errors could be corrected by the identity correction algorithm by directly manipulating the result list. Figure 10 indicates that the result from DeepSORT with YOLOv5-s is the easiest to correct by the algorithm.

Comparison of the tracking indices.
Some major indicators of the tracking policies are compared in Table 2. The simulated data set has 18 towers arranged so that a correct count of tracking indices should be 18. DeepSORT turns out to assign fewer tower IDs because some newly appeared towers are allocated with the previous track IDs (error of repetitive labeling). This mismatching roots in the unified appearance shared by the corresponding towers. On the contrary, SORT usually assigns much more tracking IDs, in that the same tower in consecutive frames always fails to be matched so that several IDs are allocated (error of hop labeling). Moreover, DeepSORT only generates repetitive labeling errors, while SORT undergoes hop labeling errors. It is also found that more sophisticated detectors are more likely to create mismatches among the unified targets. In general, DeepSORT with YOLOv5-s has the highest tacking precision in this study, which is recommended to track the landmark of transmission towers before the localization task.
Detailed comparison of the sorting results.

Localization
Landmark lateral deviation E
The localization results of the transmission towers from the simulation data set are first presented. The vision-based calculation results of the lateral deviation E are compared with the given landmarks’ position information. It is clear that the estimated E values are related to the transmission tower types. The mAP from YOLOv5-s and the corresponding standard deviation of the E for transmission towers A, B, C, and D are listed in Table 3. More accurate detection with higher mAP values tends to decrease the error of the E calculation. It is consistent with the intuition that inaccurate detection could lead to an inaccurate bounding box position e, and thus error in E would increase.
Comparison of mAP and the standard deviation of the E measurement for different transmission towers.

mAP: mean Average Precision; std: standard deviation.
Another fact influencing the accuracy of E is the height h of the detected landmark in the image. According to Figure 11, E values based on smaller h values have larger errors. The reason is that smaller h values indicate the landmark in the image is small and more distant in reality, and the bounding box position tends to be inaccurate since the target size is small.

Results of E and its error analysis.
Landmark distance D
The landmark distance De calculated in equation (6) is compared with the real landmark distance D during the whole flight for the straight line path. Their consistency is validated by the slope when we plot De versus D in Figure 12. The probability density function (PDF) of the error distribution shows that different tower types have similar error PDFs with reasonable accuracy. The De error is further analyzed as a function of bounding box height h, and the real landmark distance D. It indicates that smaller h and farther landmarks would generate higher distance measurement errors. It is the same situation compared with the E measurement results. It suggests that in the current simulation setup, the case when the bounding boxes with h larger than 300 pixel or the landmark distance D smaller than 150 m would provide better vision-based distance estimations.

Results of D and its error analysis.
UAV locations
The UAV locations in the flight path are finally achieved after calculations by equations (7) and (3). We compared the estimated locations and the real locations of the UAV in two different paths. As shown in Figure 13, it turns out that the detection–tracking–localization framework could have the UAV localized with acceptable accuracy. Here we directly use the mean location value when multiple landmarks have provided the localization information in the same frame. The std in the x direction is smaller than 10 m. However, the y direction has a larger std, which can reach 20 m in the simulated case. Both directions share a comparable relative error since the distance measured in the y direction is larger than that in the x direction.

Measured localization results in comparison with the ground truth from two paths of the simulated flight.
Experimental results
Detection and tracking
The detection and tracking results of the transmission towers from the experiment are shown in Figure 14. The left column is recorded when the UAV is flying toward the northwest, and images in the right column are taken after the UAV turns around and flies to the southeast. Labels above the bounding boxes are presented by the DeepSORT algorithm, while the labels below the bounding boxes are the final tracking identities after implementing the identity correction algorithm.

Detection and tracking results of the towers from the experiment.
The whole flight takes about 5 min, and we take about 200s of the video for measurement when the flight is stable. It turns out that the combination of YOLOv5-s and DeepSORT generates reliable initial landmark tracking identities, and by implementing the identity correction algorithm, all the landmarks could be successfully recognized. Owing to the fact that the training set is fetched from a previous flight in this region and the landmarks are meticulously annotated, the bounding boxes have provided reliable position information even with interference from the diverse landscape in autumn. Note the towers far away are not detected. They are not considered in the first place when making the annotations for the training set since these small targets tend to estimate the locations with much larger uncertainties.
Localization
The vision-based localization results are compared with the GPS-measured locations as presented in Figure 15. During the experiment, the flight path is scheduled along a river bank where several transmission towers are located. The size of the region presented in Figure 15 is about 2.0 km × 1.3 km, and the flight path has a total length of about 1 km with a height below 30 m. The takeoff point is near the midpoint between towers B2 and B3. The flight is outside of the air-exclusive zone defined by the transmission lines.
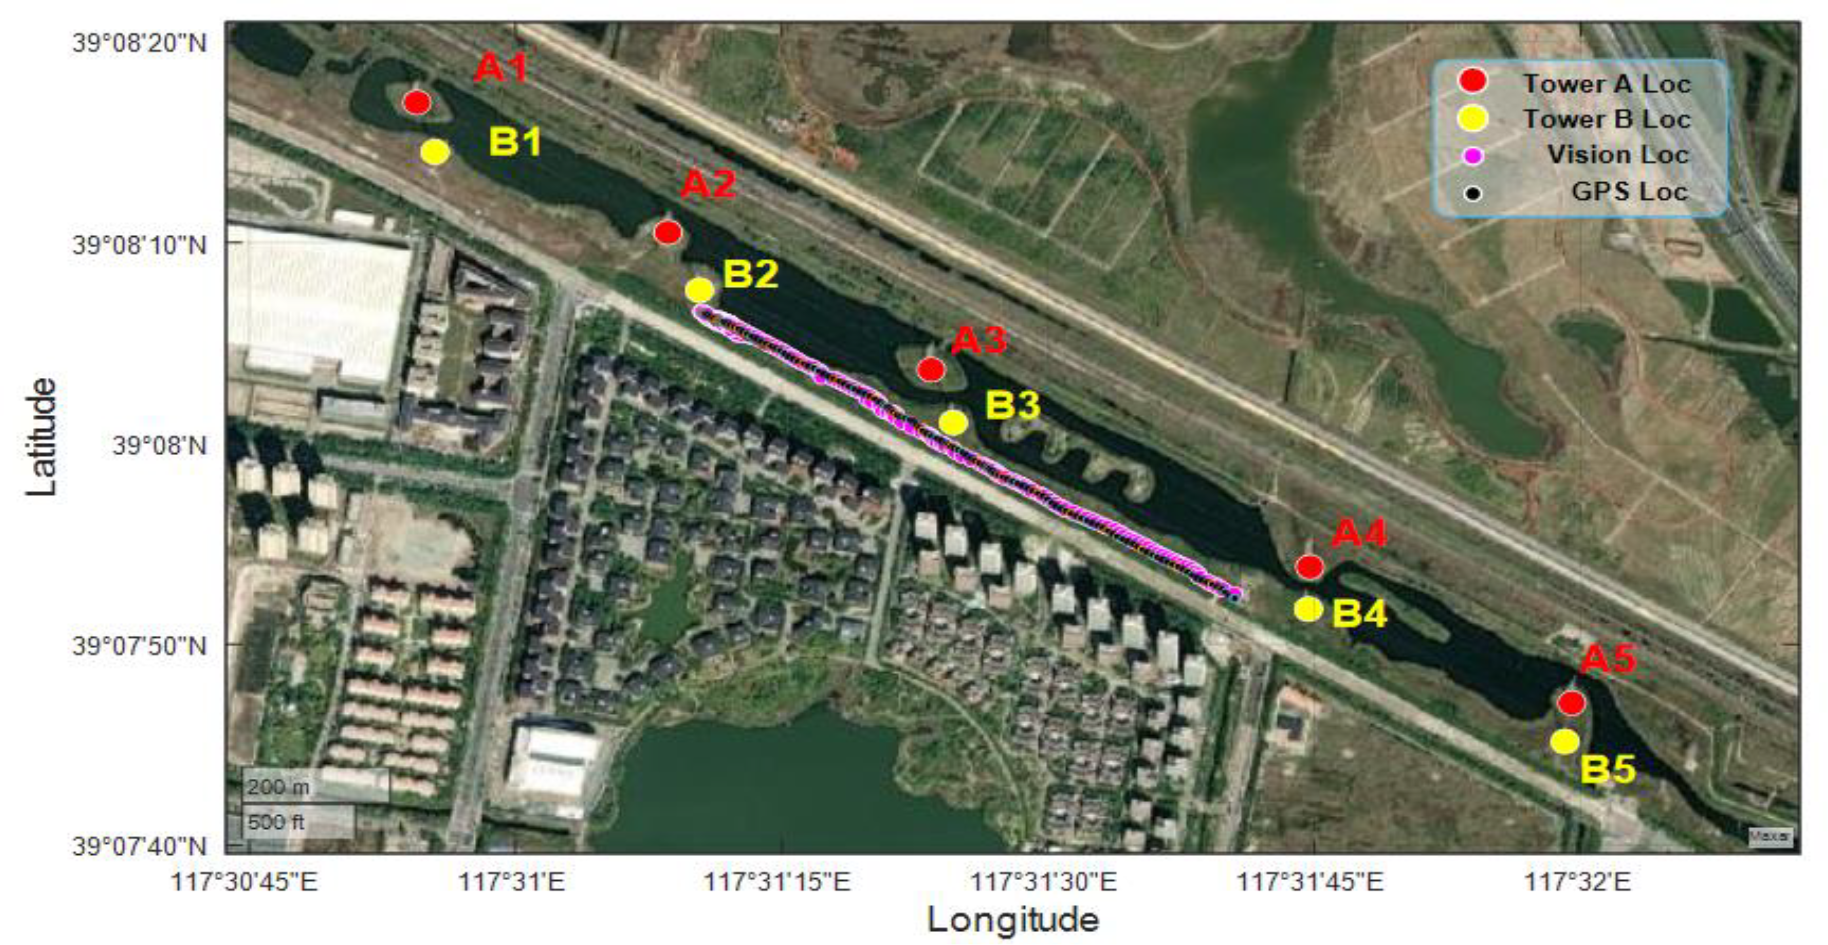
Comparison between the vision-based localization results and the GPS locations.
In comparison with the RTK-GPS-measured locations, the vision-based locations revealed acceptable consistency. Considering the state space from the output of (lat, lon), the standard deviation for the localization error is 11.1 m in this experiment. These errors root in the estimations in the (E, D) space, where the standard deviation is 13.1 m and 7.6 m for tower A and tower B, respectively. In a similar low flight height, the localization precision is comparable to that in Masselli et al. 52 and is higher than that in Sun et al. 13 when the stereo camera is used. According to the jtop report, the system monitoring utility for Jetson stats, the highest resource consumption running the localization framework onboard is 98% of the GPU, 50% of the CPU, and 3.7 GB of the memory. The localization result could be provided with the best rate reaching above 5 Hz.
Discussion
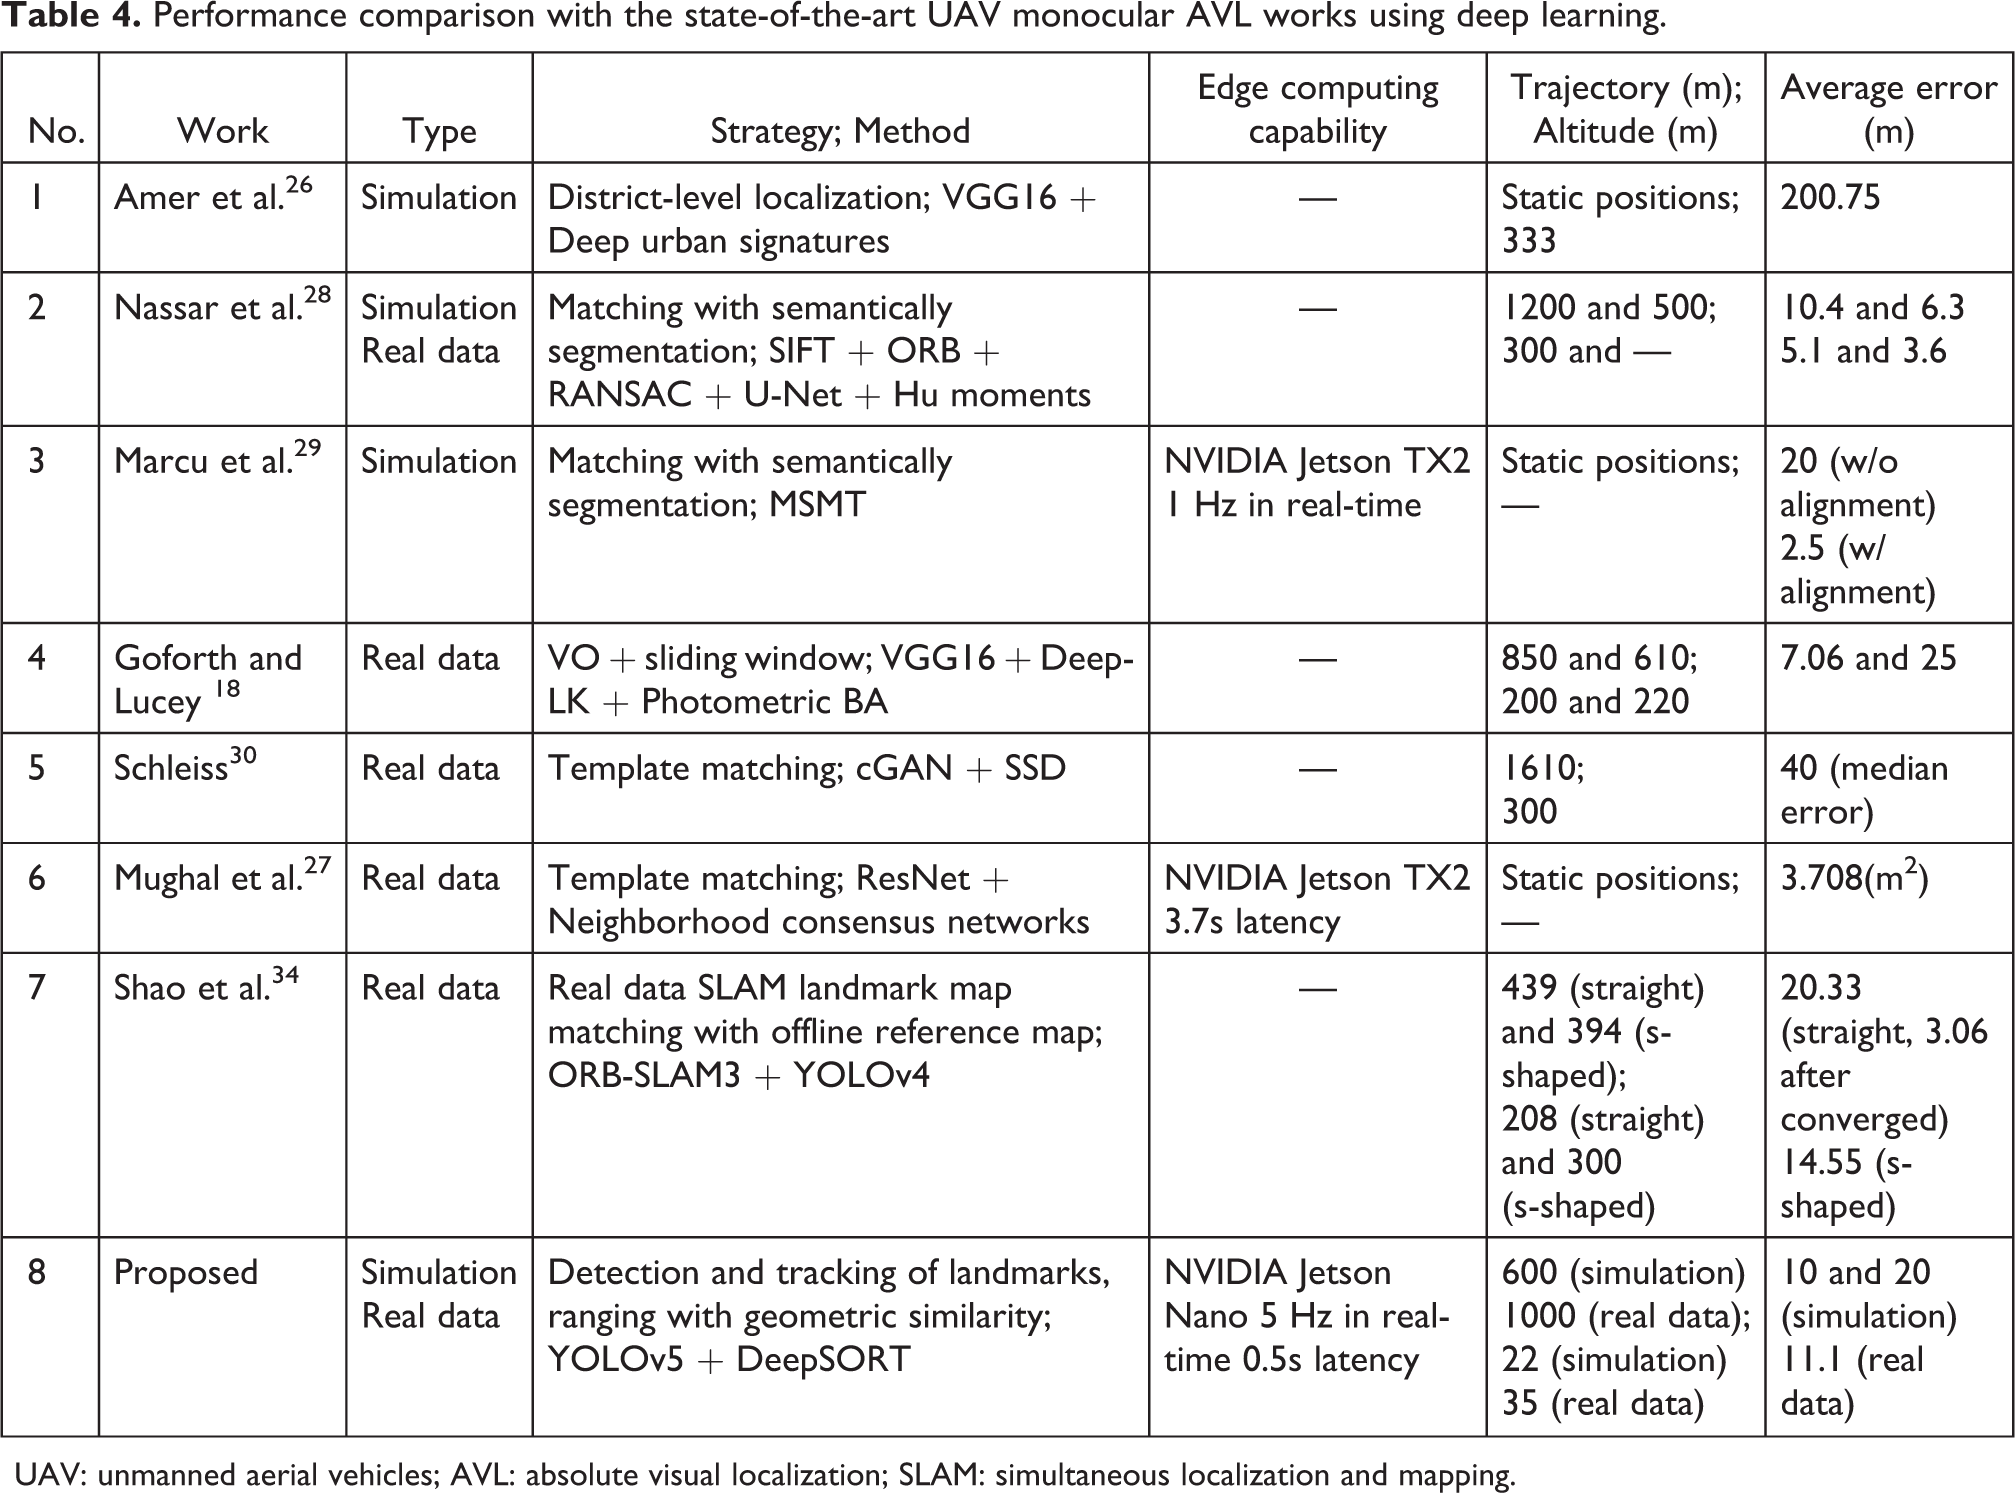
The performance of the proposed localization method has been compared in Table 4 with the papers 18,26 –30,34 cited in the related works. The discussion majorly focuses on the works studying the AVL with a monocular camera for UAV outdoor applications. The experiment type, strategy and method, edge computing capability, trajectory length and altitude, and the average error of localization have been compared. Different from the strategies from other studies, this study uses the deep learning architecture to realize landmark detection and tracking and solves the localization problem using geometric similarity. Although the proposed method is implemented on the entry-level edge computing platforms like NVIDIA Jetson Nano, it stands out as a real-time AVL solution with low latency which can be mounted on small UAVs. Moreover, the proposed method could be implemented at a much lower altitude (<50 m) since it needs no nadir view maps for feature matching during the flight. The localization precision of the current study is moderate among the state-of-the-art studies as listed, which needs to be improved in our future work.
Performance comparison with the state-of-the-art UAV monocular AVL works using deep learning.
UAV: unmanned aerial vehicles; AVL: absolute visual localization; SLAM: simultaneous localization and mapping.
The precision of the current visual localization framework is determined by various factors, which include the resolution of the original video frames, the precision of the bounding boxes, and the real landmark size and location information. Although current commercial aerial cameras could generate UAV locations with acceptable accuracy using this localization system, higher resolution cameras would provide better location estimations. The precision of the bounding boxes is majorly influenced by the image quality and the meticulosity when preparing the training set. Further improvement of the bounding box regression could be referred to the work of Wang et al. 53 Nevertheless, the acquirement and establishment of a reliable real landmark database is also crucial to generating accurate localization results for the UAVs.
In this study, the localization results could be improved by implementing a weighted localization according to the quality of the landmarks when multiple landmarks appeared in one frame. The error analysis results show that landmarks with higher mAP and larger bounding boxes always provide more accurate location results. It is reasonable to give these landmarks higher credit when combining their results instead of making an average of them to calculate the localization. It is also possible to further optimize the localization precision through multi-sensor fusion, such as IMU, VO, and laser-based rangers. This study focuses on visual localization and leaves out the discussion of UAV visual navigation, which can be referred in the literature 7,54 for more information.
Despite achieving real-time autonomous localization based on transmission towers, there exist some shortcomings in the current AVL strategy. The localization framework is intimately dependent on the detection and tracking of the visual landmarks, which means at least one recognizable landmark is required to appear in the view of the UAV. This condition necessitates a landmark system that ensures a stable landmark appearance to enable UAV navigation, which indicates that UAVs would not be able to localize themselves on unexplored land with bare ground. On the other hand, since the landmarks with a unified appearance are selected, it is easy to get lost if the iteratively inferred landmark identities are occluded or mismatched. It is necessary to select some landmarks with exclusive visual features to adjust the localization process occasionally. By overcoming these disadvantages, it is possible to establish a sparse landmark system in the GNSS-denied region, which could maintain reliable UAV localization while disabling any intruder with the traditional GNSS.
Conclusions and future work
In this study, a vision-based absolute localization framework is developed for UAVs. The deep learning tools, including YOLO and DeepSORT, are used to detect and track the transmission towers, which are used as landmarks for localization. The simulation is conducted based on the Rflysim platform, where a UAV navigated with different paths among a landmark system constructed by four types of transmission towers. The performance of detection is evaluated by comparing different versions of YOLOv5 such as s, m, and x, and the tracking performance is compared between SORT and DeepSORT. It turns out that a combination of YOLOv5-s and DeepSORT could provide a reliable implementation for UAV localization when the landmark identities are correctly assigned.
Using a monocular camera, the same localization framework is then demonstrated on a small UAV. The real-time localization is realized with a location update rate of 5 Hz based on the entry-level edge artificial intelligence solution of the NVIDIA Jetson Nano. The total length of the path is about 1 km, and the average error of localization is about 10 m compared with the results measured with RTK GPS. The proposed visual localization strategy in this study saves a significant amount of the GPU memory since no satellite image is needed as a reference map. It is also an economic localization system that makes possible the end-to-end implementation on small UAVs.
As future work, the improvement of the localization precision can be explored, in that the deep learning tools which can generate more accurate bounding boxes for the landmarks would promote the reliability of the location results. In the following stage, we expect to implement the fusion of sensors with the proposed visual localization framework, exploring to achieve autonomous navigation with a real UAV under GNSS-denied conditions.
Footnotes
Declaration of conflicting interests
The author(s) declared no potential conflicts of interest with respect to the research, authorship, and/or publication of this article.
Funding
The author(s) received no financial support for the research, authorship, and/or publication of this article.