
Abstract
In the personalized medicine era, the field of immunohistopathology is evolving to provide even more precise diagnostic information to efficiently apply targeting therapies. In this regard, MultiSpectral fluorescence Imaging (MSI) is a powerful and reliable technique that provides a detailed and remarkable analysis of multiple biomarkers within their histological context. In particular, the analysis of the immune infiltrate in conjunction with the expression of immune checkpoint molecules could explain why the efficacy of the promising treatments based on immune modulator monoclonal antibodies is still limited. We analyzed the advantages and the pitfalls of applying MSI technology to investigate the immune infiltrate in correlation with programmed death-ligand 1 expression in paraffin embedded ovarian cancer samples.
Introduction
The possibility of simultaneously investigating several biomarkers in a single tissue specimen has been a challenging issue for years. Different strategies have been developed to address this purpose, but in general they are based on the use of a specimen provided as a “fluid” substance; this implies the loss of the histological context. A wider approach able to investigate the complexity of the disease is coming, taking into account the heterogeneity and quantity of pathological and immunological biomarkers, the spatial inter-relationships, and the co-expression of several molecules.
MultiSpectral fluorescence Imaging (MSI) takes advantage of a multispectral camera to acquire the emission spectra of fluorochromes ranging from 420 to 720 nm (capturing one image every 20 nm of interval). 1 The resulting “raw image” derives from the combination of several pictures in a single “image cube.” The multispectral camera capturing the emission spectrum of single acquired fluorochromes creates a spectral library. The system utilizes the library in a process named “spectral unmixing” to identify every fluorochromatic component. The great potential of the MSI is that not only different but also very similar spectra are unmixed one to each other; thus, on the basis of the spectral library, it is possible to discriminate and quantify (by means of fluorescent intensity) every fluorochrome inside a multi-stained sample. The most applied strategy to perform multi-staining for MSI relies on the tyramide signal amplification (TSA) method, a technique that allows: (a) the detection of antigens at low expression; and (b) the utilization in sequence of primary antibodies that have arisen in the same host. 2 The tyramide molecule reacts with and covalently binds to tyrosine residues in the presence of the horse radish peroxidase enzyme; that is, at the site of an antigen-antibody complex or in its immediate proximity. If the tyramide is conjugated to a fluorophore, the binding is easily and stably detected. All these peculiar characteristics, together with the simultaneous reaction of several tyramide-fluorophore complexes, guarantee a considerable signal amplification. More importantly, by means of chemical or temperature procedures it is also possible to elute both the primary and the secondary antibodies, and to investigate the sample for other biomarkers. Thus, since all the immunoglobulins are removed, the problems of cross-reactivity are solved. In summary, a biomarker is specifically recognized by an antibody but with the TSA method the detection signal is directly and steadily associated with the sample.
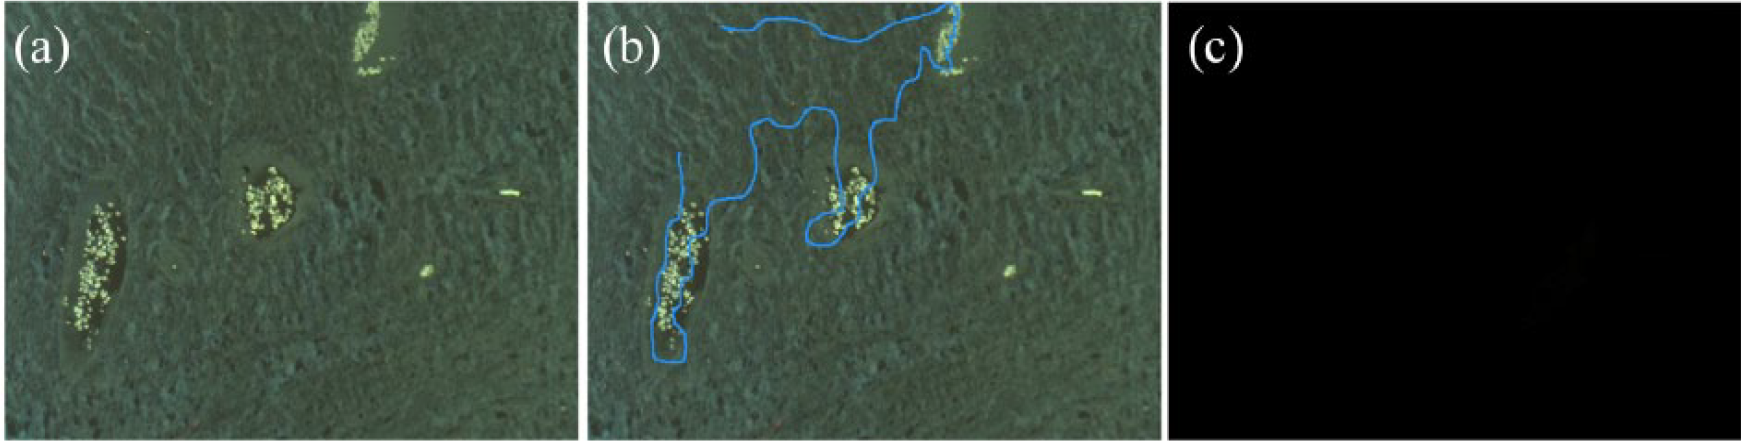
A great contribution to overcome specific technical issues and to analyze the multispectral acquired images has been provided by bioinformatic instruments, which helped, above all, in solving the problem of autofluorescence—a critical constant in formalin-fixed paraffin-embedded (FFPE) samples. In fact, this obstacle has limited the use of fluorescence staining on FFPE specimens for years, especially in routine procedures. In the MSI system, the autofluorescence is recorded and considered as one of a spectral signal: an unstained section is acquired as a template (Figure 1(a)) to calculate and subtract the related signal from the total one (Figure 1(b) and (c)). The analysis software, which is able to discriminate every fluorochrome on the basis of the spectral library, transforms the raw image into a clean and resolved one (Figure 2(a) and (b)). Using MSI, until six different fluorochromes can be acquired, and thus six associated biomarkers can be identified. In addition, a counterstaining for nuclei visualization (usually performed with DAPI) is feasible in the same section.
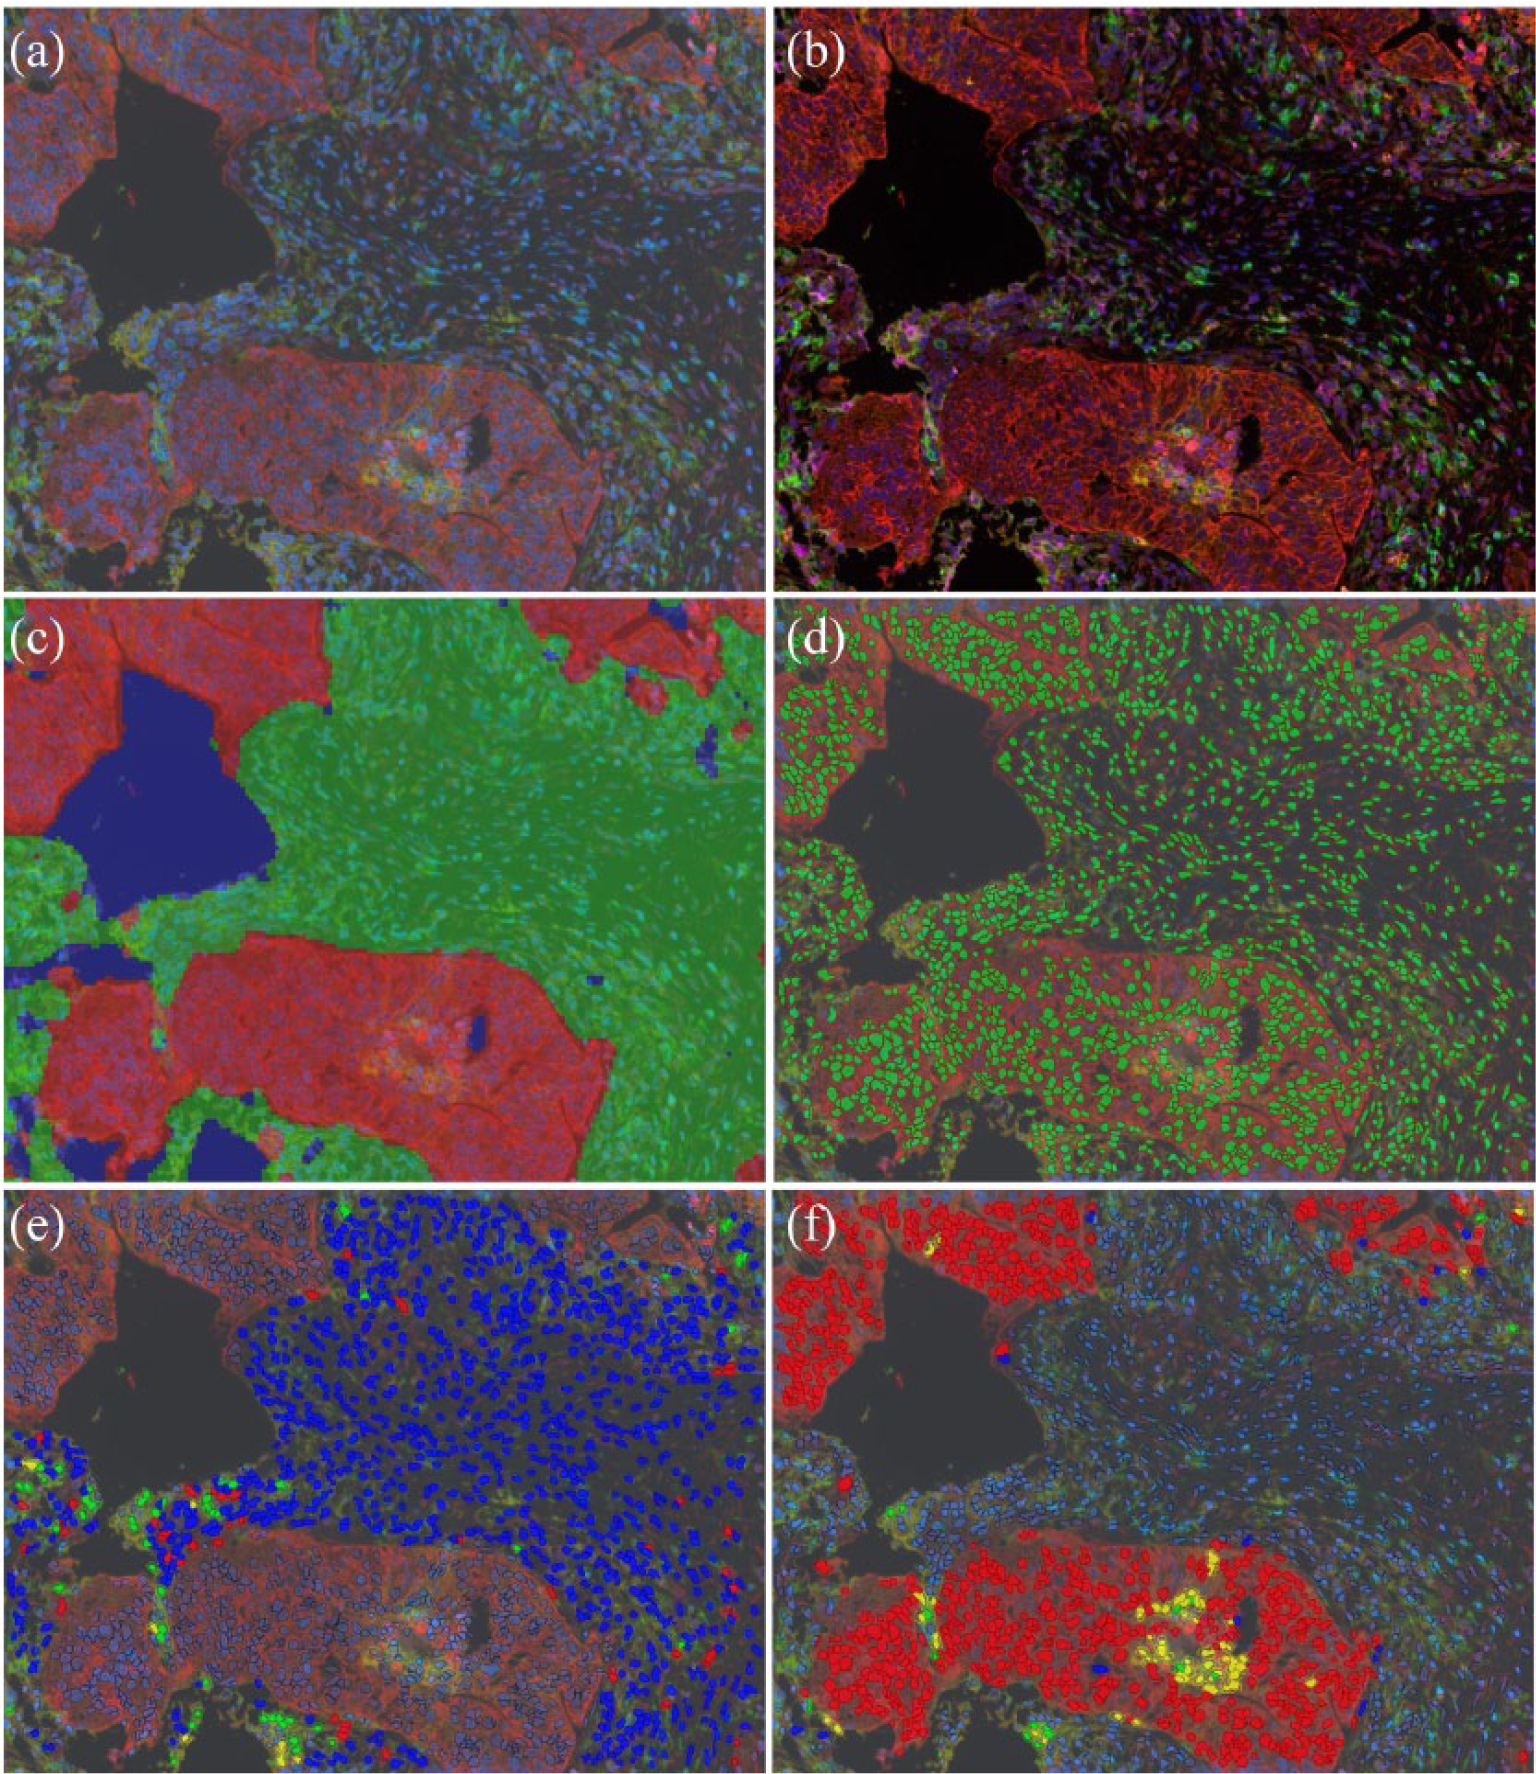
Since the investigation with the MSI system permits screening for several antigens on a single tissue section and provide a huge amount of information, valid bioinformatic tools are required to help pathologists and researchers in data management. Dedicated software has been properly created to identify tissue morphology on the basis of “trainable” or semi-automated elaboration; pathologists draw regions of interest (ROIs) on acquired images that must recapitulate the full range of the histological context. Thus, the software learns to recognize the different “tissue categories” and creates virtual masks to visualize the tissue segmentation (Figure 2(c)). Moreover, the counterstaining allows the software to identify nuclei and, therefore, cells. The specific localization of biomarkers could assist in identifying cell compartments as cytoplasm and cell membrane; together with counterstaining, this information aids the software in creating a mask to visualize the cell segmentation (Figure 2(d)). Every single cell is marked as an ROI, that records spatial (coordinates, area in pixel) and spectral (intensity value for each fluorochrome) features. Thus, a cell can be classified as positive or negative for each biomarker depending on the relative fluorescent intensity value. The software could be interrogated and return the immune profile (as co-localization of immune cell markers) and the percentage of positive cells (Figure 2(e) and (f)). The analysis is performed in a semi-automated manner by algorithms that utilize fluorescent intensity thresholds. This allows the results to be obtained in a more rapid and objective manner.
The necessity to investigate in a bioptic sample several biomarkers to address the best therapeutic strategy is an urgent issue especially in the field of cancer immunotherapy. In fact, the role of immune infiltrate in regulating tumor progression is supported by increasing evidence in literature: the density and the quality of the immune cell profile determine the prognosis of patient survival in solid tumors. 6 For example, it has been clearly demonstrated that CD8+ T cells strongly correlate with good prognosis in most cancer types.7–9 In a study regarding the application of adaptive T-cell therapy in melanoma, Feng and colleagues, 10 utilizing mIHC, demonstrated that the overall presence of CD8 T cells is not sufficient, per se, to predict a good generation of autologous tumor-reactive T cells. However, when the ratios of CD8+ to FOXP3 and of CD8+ to programmed death-ligand 1 (PD-L1) were considered they emerged as being significantly predictive. 10 Indeed, it is increasingly evident that not only the density but also the distribution in the tumor and the surrounding environment are associated with the clinical outcome. 11 This observation has been initially demonstrated in colorectal cancer; however, this concept has been supported by recent investigations in other tumor: a study on pancreatic ductal adenocarcinoma revealed that the spatial distribution of CD8+ T cells had prognostic value for clinical outcome. 11 Tsujikawa and co-workers 12 brought to high level the throughput of mIHC, evaluating a cohort of head and neck squamous cell carcinoma with three different 12-biomarker panels: these panels aided deep investigations of lymphoid and myeloid lineages, confirming that CD8+ T-cell density (together with CD163 macrophages) not only indicated an anti-tumor immune reactivity, but also revealed that myeloid Th2-enriched tumors were associated with decreased overall survival. All these observations were revealed thanks to the opportunity to analyze so many biomarkers altogether in a single specimen. 11 The possibility to conjugate MSI with the fluorescence in situ hybridization technique highlighted the feasibility of multispectral technology, as demonstrated by Wee et al. 13 The importance of the expression level of immune-modulatory checkpoint molecules, (e.g. programmed death-1 (PD-1) and PD-L1), is increasing since their role in tumor suppression has been confirmed by several independent studies, not only in ovarian cancer but also in melanoma and lung carcinoma.14-16 The monoclonal antibodies against immune checkpoint molecules (e.g. CTLA-4 or PD-1/PD-L1 axis), are approved for the treatment of several malignancies, such as melanoma,5,17 lung, 18 and head and neck cancer. 19 Nevertheless, the efficacy of the treatment is still limited. The reasons rely on the complexity of immune responses in which immune suppressive and immune stimulating modulators coexist in a weak balance. The possibility of knowing the crucial immune molecule that is really acting in the tumor microenvironment for each patient could determine the success of the immunotherapy approach. 20
Results and discussion
In our experience, the MSI system has been supportive in this study, which aimed to identify, quantify, and correlate the immune infiltrate with the expression of the immune checkpoint molecule PD-L1 in human ovarian cancer FFPE samples. We first verified the feasibility to perform mIHC in our laboratory. The most critical step in the development of the mIHC was the validation and optimization of staining protocols. Even if some kits are commercially available and validated, they only partially support clinical biomarker investigation. The existence of diagnosis validated antibodies was a starting point; nevertheless their application in mIHC required accurate control tests to obtain balanced fluorescence intensity readouts while maintaining appropriate staining. Thus, the development of mIHC protocols needed a great effort in terms of dedicated personnel, reagents, and time. We performed mIHC using a commercial kit, based on the TSA technique, which provided the staining of six biomarkers, with three out of six (CD4, CD8, and CD68) already introduced in the staining protocol. We initially validated and optimized for the staining with anti-pan cytokeratin and anti-PD-L1 antibodies. We started performing a single IHC to identify the best staining protocols for each antibody, then we introduced PD-L1 and pan cytokeratin antibodies one by one in the mIHC schedule. We applied the resulting schedule on a consistent amount of human ovarian cancer FFPE specimens (more than 400 samples); this prompted us to increase the critical aspect of sample quality. This point is frequently underestimated, but especially in mIHC procedure, where the sections are subjected to several rounds of antibody elution, the initial tissue processing (from sampling to fixing and embedding) requires a stringent fit to standardized guidelines. The multi-stained sections were acquired with the MSI system, and now the analysis for the presence of T lymphocytes (phenotyped in CD4+ and CD8+ subpopulations), macrophages (identified as CD68+), and PD-L1-expressing cells in the tumoral microenvironment context (based on cytokeratin positivity) are in progress.
Conclusions
Beyond the efforts required to validate and optimize each staining protocol, the MSI technology provides solutions to several problems, such as (a) the removal of the autofluorescence signal from FFPE samples; (b) the multiple staining of several biomarkers on a single section; and (c) the consequent reduction of bioptic specimens mandatory for diagnostic purposes. Overcoming technical limitations ascribable to classical IHC and providing information typical of cytofluorimetric analysis (e.g. the possibility of phenotyping a specific population), MSI technology emerges as a feasible conjunction with several applications: (a) qualitative and quantitative analysis of highly relevant multiple biomarkers; (b) phenotyping of immune infiltrate; (c) tissue and cellular segmentation for morphological; (d) expression analysis; (e) identification, subcellular localization and quantification of phosphor-antigens; and (f) biomarker co-localization analysis in the microenvironment context.
Footnotes
Declaration of conflicting interests
The author(s) declared no potential conflicts of interest with respect to the research, authorship, and/or publication of this article.
Funding
The author(s) received no financial support for the research, authorship, and/or publication of this article.