
Abstract
Non-alcoholic steato-hepatitis (NASH) is a severe disease characterised by liver inflammation and progressive hepatic fibrosis, which may progress to cirrhosis and hepatocellular carcinoma. Clinical evidence suggests that in hepatitis C virus patients steatosis and NASH are associated with faster fibrosis progression and hepatocellular carcinoma. A safe and reliable non-invasive diagnostic method to detect NASH at its early stages is still needed to prevent progression of the disease. We prospectively enrolled 91 hepatitis C virus-positive patients with histologically proven chronic liver disease: 77 patients were included in our study; of these, 10 had NASH. For each patient, various clinical and serological variables were collected. Different algorithms combining squamous cell carcinoma antigen-immunoglobulin-M (SCCA-IgM) levels with other common clinical data were created to provide the probability of having NASH. Our analysis revealed a statistically significant correlation between the histological presence of NASH and SCCA-IgM, insulin, homeostasis model assessment, haemoglobin, high-density lipoprotein and ferritin levels, and smoke. Compared to the use of a single marker, algorithms that combined four, six or seven variables identified NASH with higher accuracy. The best diagnostic performance was obtained with the logistic regression combination, which included all seven variables correlated with NASH. The combination of SCCA-IgM with common clinical data shows promising diagnostic performance for the detection of NASH in hepatitis C virus patients.
Introduction
Non-alcoholic fatty liver disease (NAFLD) is characterised by the accumulation of lipids in more than 5% of hepatocytes in patients with no excessive alcohol intake, viral infection or any other specific etiology (1). NAFLD is a benign and reversible condition, but in most cases it remains asymptomatic and is left untreated (2). Consequently, over time, NAFLD evolves into non-alcoholic steato-hepatitis (NASH), a more severe disease defined by liver inflammation and progressive hepatic fibrosis. From NASH, the disease can further progress to cirrhosis and hepatocellular carcinoma (HCC).
In Western countries, NAFLD prevalence in the general population is 20%–30% (2). Risk factors for NAFLD/NASH development are obesity, type 2 diabetes, dyslipidaemia and metabolic syndrome; indeed, the prevalence of the disease is 90% in morbidly obese patients and 70% in those with type 2 diabetes (2). Although not consistent, published data show that the prevalence of NASH in patients with chronic hepatitis C virus (HCV) infection is between 4% and 10% (3). Clinical evidence suggests that in HCV patients steatosis and NASH are associated with faster fibrosis progression and HCC (3); therefore it is important to identify and treat those diseases in a timely fashion.
The current standard of care for NAFLD consists of lifestyle changes, such as diet and exercise, and the treatment of common co-morbidities, such as diabetes, hypertension and dyslipidaemia (2, 4). The management of patients with fatty liver disease already constitutes a great social and economic burden for national health services, having 26% higher costs over a 5-year follow-up (5).
At present, the gold standard for NASH diagnosis is liver biopsy (4) – an expensive, invasive and time-consuming procedure with many risks of complications. Reliable non-invasive diagnostic tools are not available yet, so there is still an unmet medical need for a method to detect NASH at its early stages in order to prevent progression of the disease to more severe forms.
Squamous cell carcinoma antigen (SCCA) is a serine protease inhibitor that belongs to the family of serpins (6). SCCA is physiologically found in the normal squamous epithelium, and it is over-expressed in cancers of epithelial origin (6) and in HCC liver tissue (7, 8). In patients with HCC, serological concentration of the free form of SCCA is low, while the immune-complex SCCA-IgM is detectable at high levels (9). Indeed, SCCA-IgM has been validated as a serological biomarker for HCC and other liver diseases, including NASH. A recent study showed that a high concentration of SCCA-IgM in the serum of HCV-positive patients is independently associated with the presence of NASH in the liver (10).
The aim of our study was to create an algorithm that combines SCCA-IgM levels with other common clinical data to provide the probability of a patient with HCV having NASH.
Methods
Patients
The Division of Gastroenterology and Endoscopy of Verona’s University Hospital, Italy, prospectively enrolled 91 patients. Inclusion criteria were: Caucasian race, HCV infection and histologically proven chronic liver disease. Exclusion criteria included: previous antiviral treatment, decompensated cirrhosis, co-infection with other viruses or concomitant medical conditions.
For each patient, the following clinical variables were collected: age, sex, weight, height, body mass index, abdomen circumference, smoke habit, presence of hypertension, obesity or metabolic syndrome, alcohol and coffee intake, liver biopsy result, presence of cirrhosis, steatosis, non-alcoholic steatosis or NASH.
Blood samples were collected before any antiviral treatment and were tested for the following markers: HCV genotype and RNA levels, platelets, white blood cells, haemoglobin (Hb), ferritin, homeostasis model assessment (HOMA) of β-cell function, insulin, glycaemia, low density lipoprotein, high density lipoprotein (HDL), aspartate aminotransferase, alanine aminotransferase, γ-glutamyl transferase, bilirubin, cholesterol, triglycerides, and SCCA-IgM.
The study was performed in accordance with the principles of the Declaration of Helsinki and its appendices, and after approval from Verona’s University Hospital Institutional Review Board and Ethics Committee. All patients gave fully informed consent authorising the use and analysis of clinical data, blood and liver tissue samples for research purposes.
Serological markers determination
Serum levels of SCCA-IgM were quantified using Hepa-IC ELISA kit (Xeptagen, Venice, Italy), following the manufacturer’s instructions. Data were processed with Xerepro software (Xeptagen) and concentration of SCCA-IgM was expressed as arbitrary units per millilitre (AU/mL). All other serological markers were assessed using conventional methods.
Statistical analysis
Statistical analysis was performed using SPSS v.16.0.1 (IBM). For all comparisons, a P-value <0.05 was accepted as statistically significant. Data sets were analysed using the following methods: correlation analysis, principal component analysis (PCA), linear discriminant analysis (LDA), logistic regression (LR), and receiver operating characteristic (ROC) curves.
Results
Patients study group
A total of 91 patients were enrolled. There were 14 subjects with negative or uncertain diagnosis of NASH that were excluded from our analysis; the remaining 77 subjects were divided in two groups: 10 patients with (NASH = 1) and 67 patients without NASH (NASH = 0).
A limited number of subjects had cirrhosis (5/77, 6.5%); most patients had steatosis <5% (46/75, 61.3%), and a small fraction had steatosis ≥33% (10/75, 13.3%). Most patients were infected with HCV genotype 1 (40/77, 51.9%).
Compared to those without NASH, patients with NASH showed significantly higher levels of insulin, ferritin, Hb, SCCA-IgM and HOMA (P<0.05), and lower levels of HDL (P<0.05) (Tab. I).
Patients’ serological markers
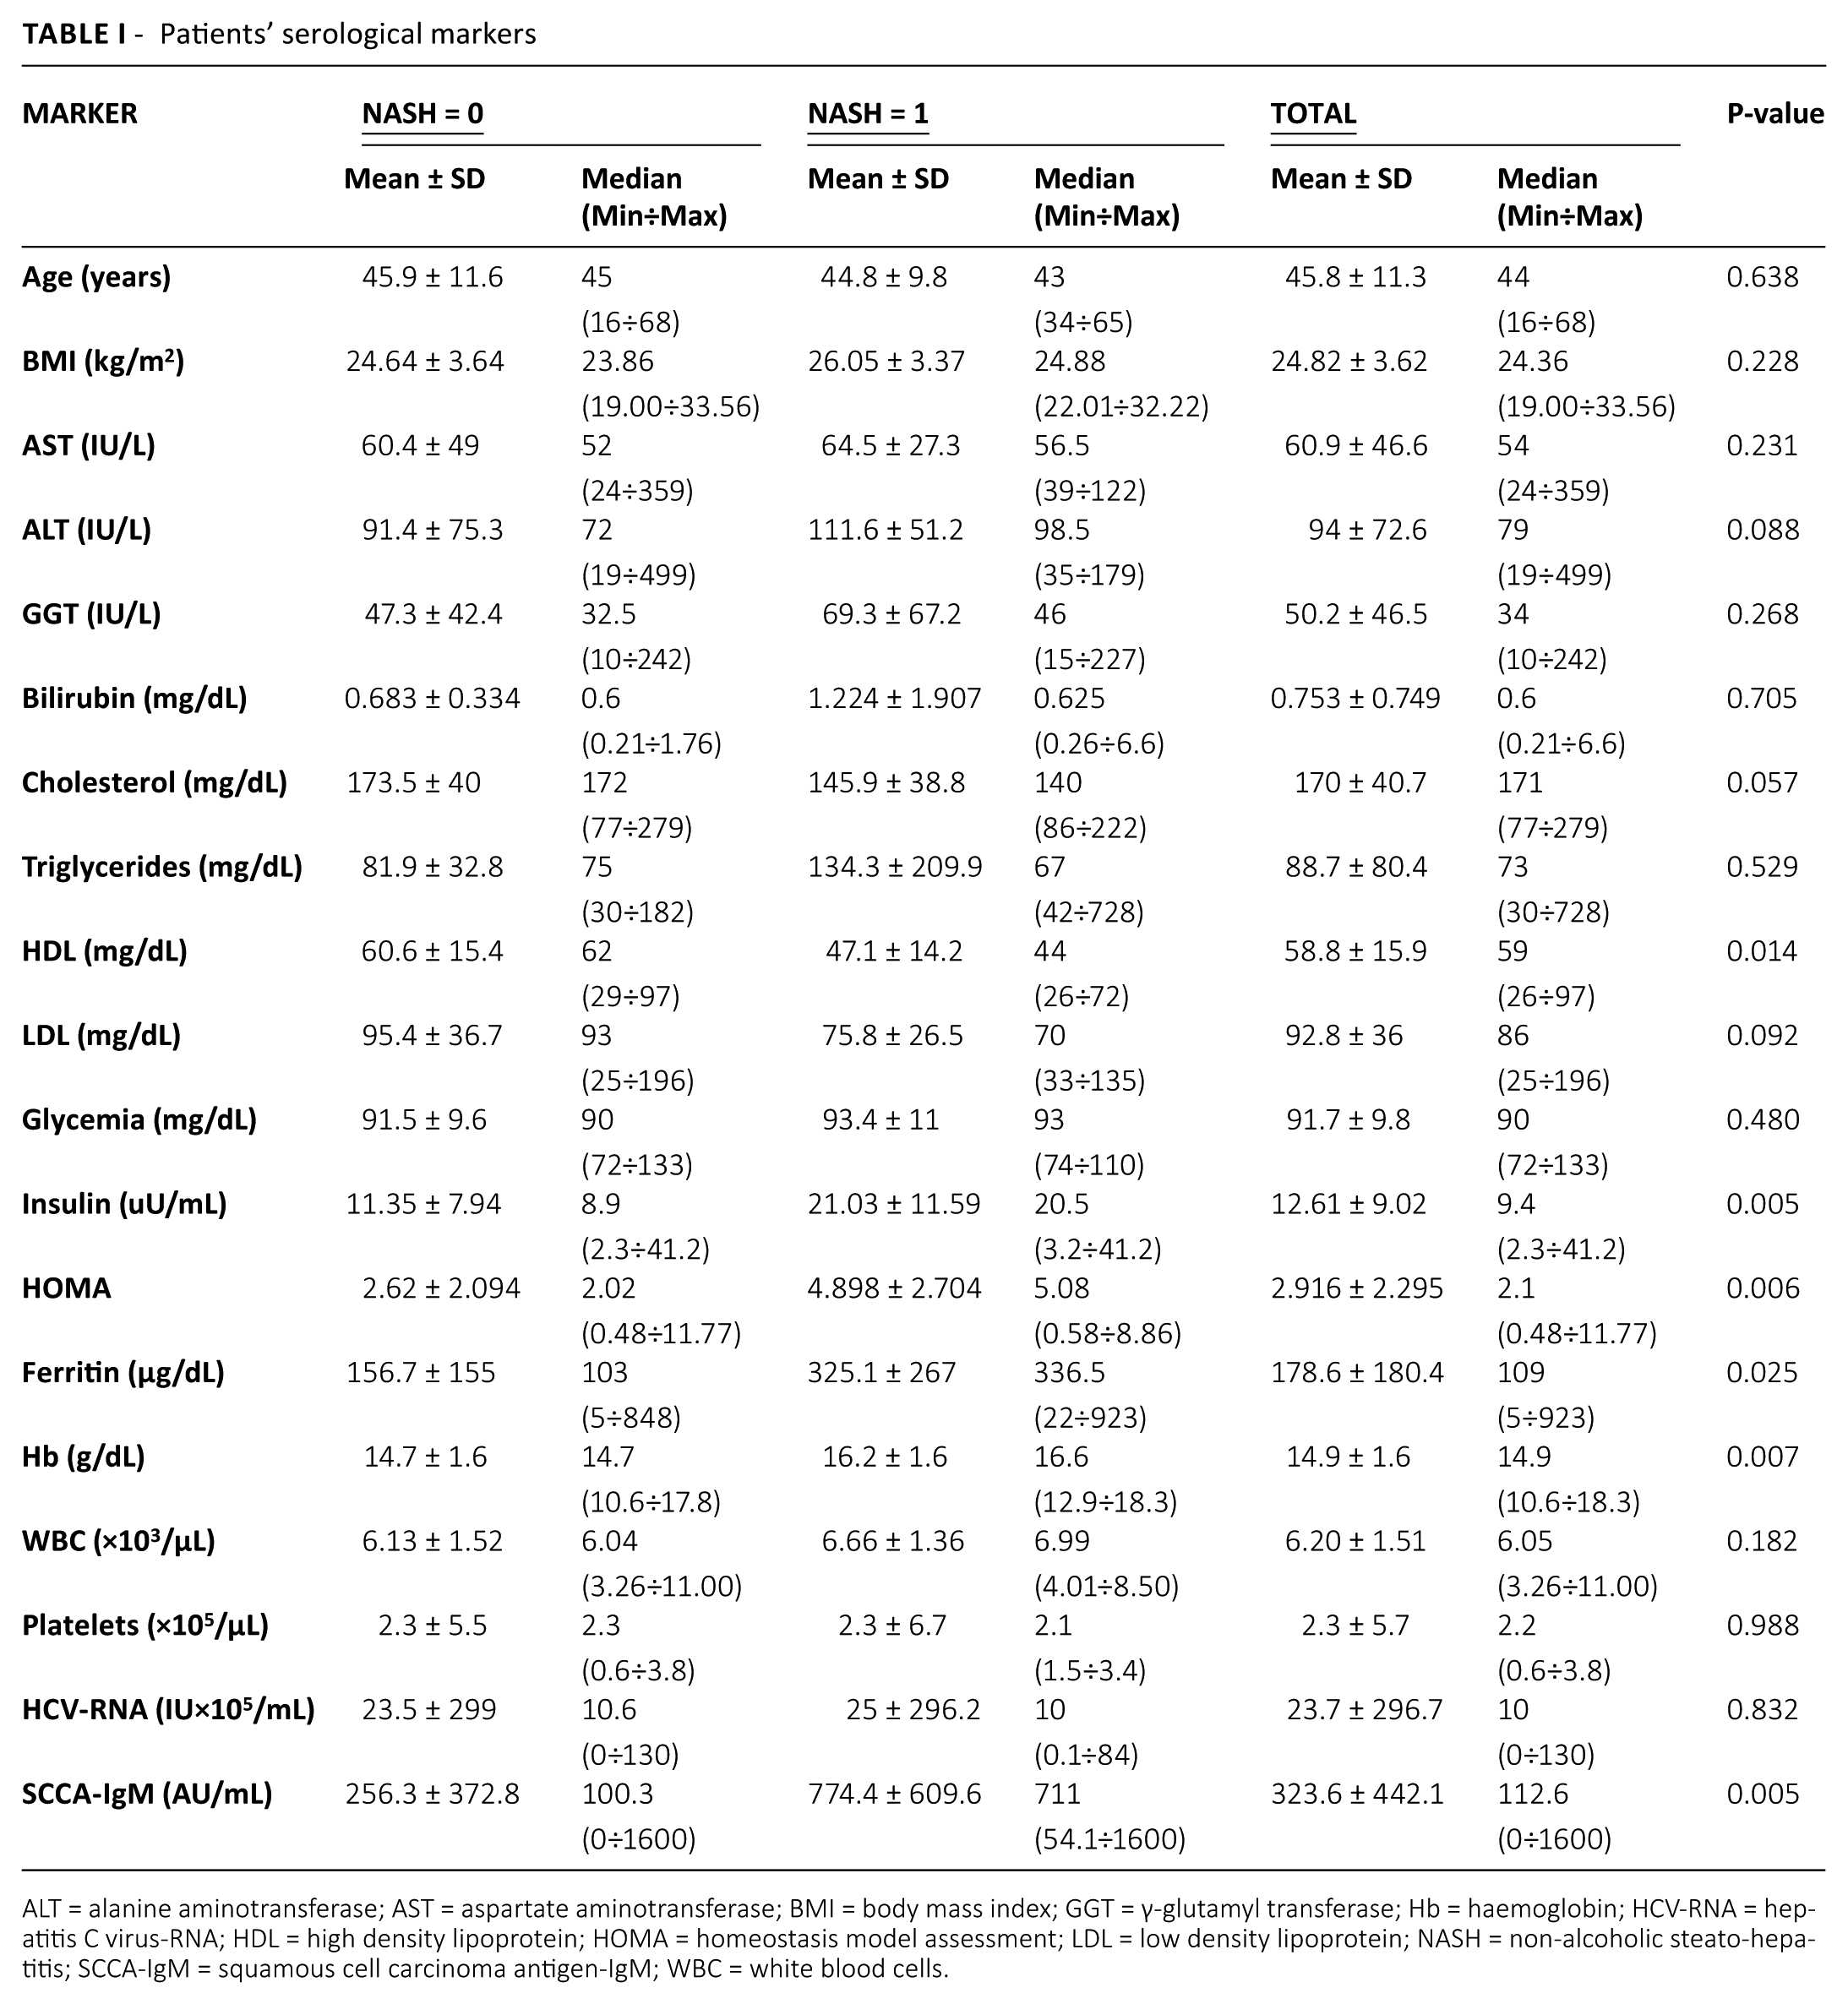
ALT = alanine aminotransferase; AST = aspartate aminotransferase; BMI = body mass index; GGT = γ-glutamyl transferase; Hb = haemoglobin; HCV-RNA = hepatitis C virus-RNA; HDL = high density lipoprotein; HOMA = homeostasis model assessment; LDL = low density lipoprotein; NASH = non-alcoholic steato-hepatitis; SCCA-IgM = squamous cell carcinoma antigen-IgM; WBC = white blood cells.
Correlation analysis
A tau test was performed to determine if there was a correlation between NASH and one or more clinical parameters. Our analysis revealed a statistically significant correlation between histological presence of NASH and the levels of insulin, HOMA, Hb, and SCCA-IgM (P<0.01), and also between NASH and smoke, HDL and ferritin concentration (P <0.05) (Tab. II).
Results of the correlation analysis
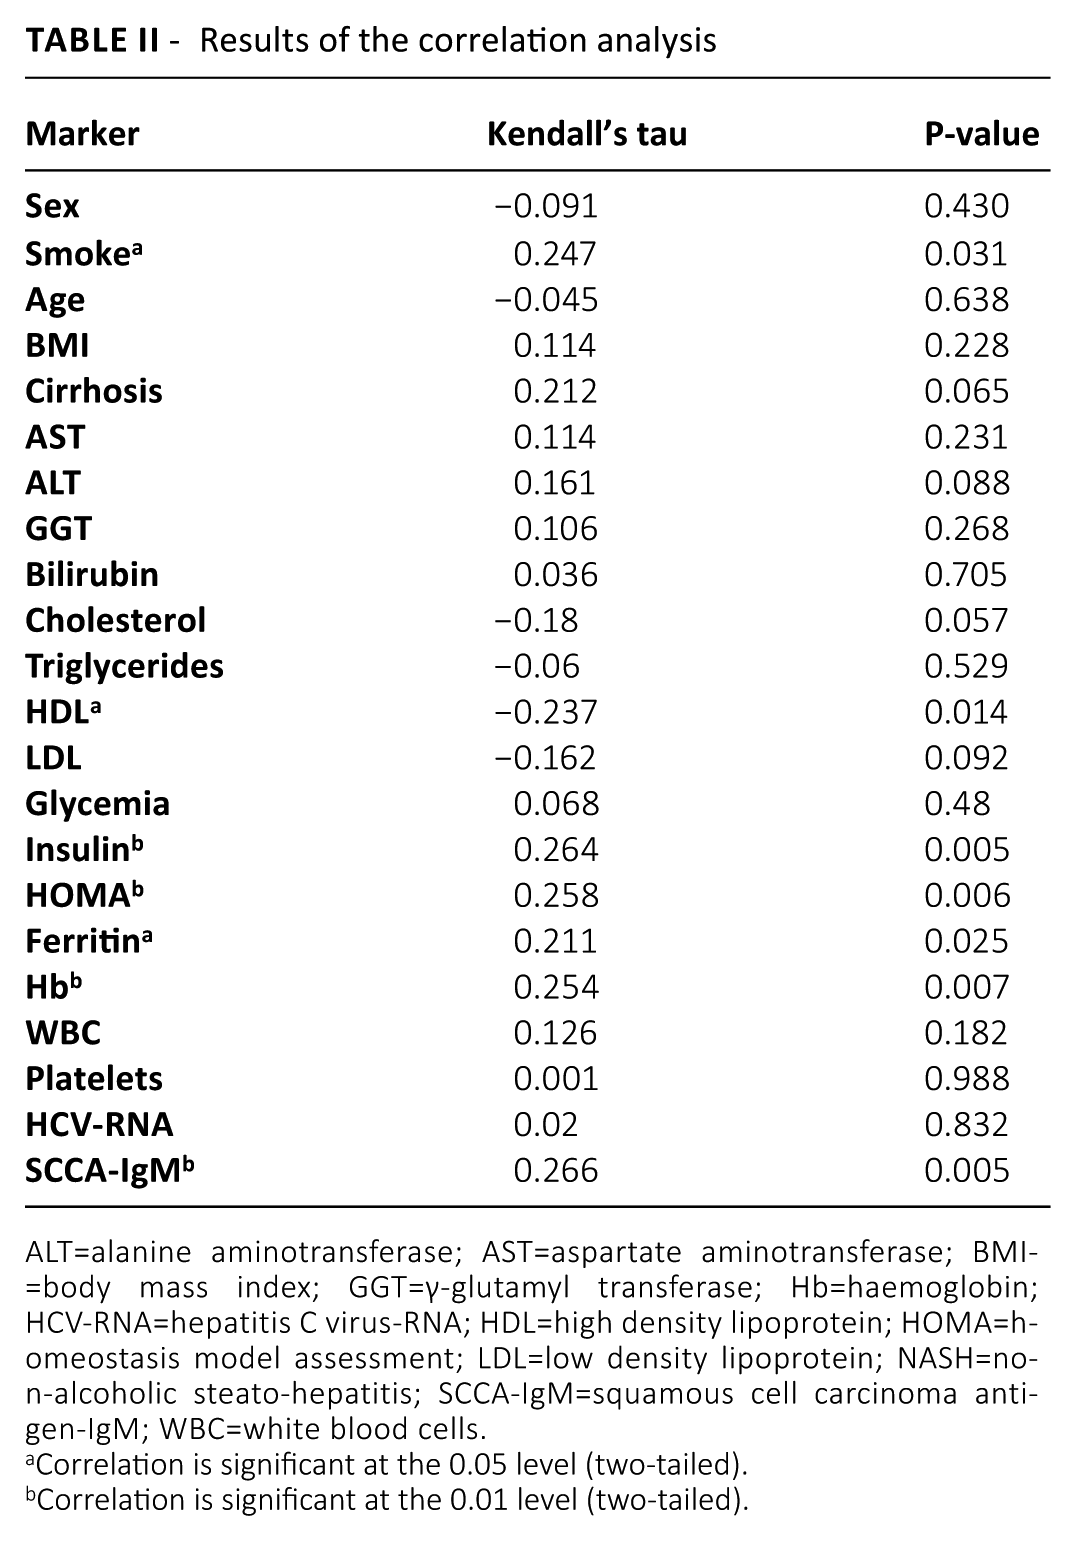
ALT=alanine aminotransferase; AST=aspartate aminotransferase; BMI=body mass index; GGT=γ-glutamyl transferase; Hb=haemoglobin; HCV-RNA=hepatitis C virus-RNA; HDL=high density lipoprotein; HOMA=homeostasis model assessment; LDL=low density lipoprotein; NASH=non-alcoholic steato-hepatitis; SCCA-IgM=squamous cell carcinoma antigen-IgM; WBC=white blood cells.
Correlation is significant at the 0.05 level (two-tailed).
Correlation is significant at the 0.01 level (two-tailed).
Principal component analysis
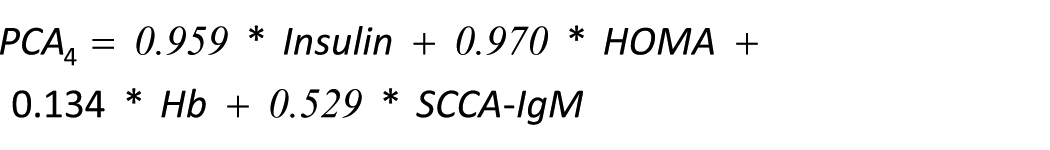
Based on the correlation analysis results, we analysed the data with two PCAs performed on a correlation matrix. First, we combined the markers with a strong correlation with NASH (insulin, HOMA, Hb and SCCA-IgM), obtaining the following equation:
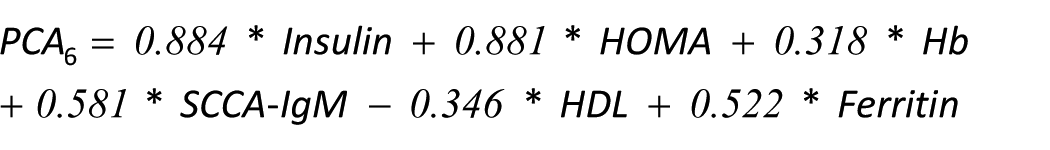
Second, we performed a PCA using all continual variables with a significant correlation with NASH (insulin, HOMA, Hb, SCCA-IgM, HDL and ferritin), getting this equation:
Linear discriminant analysis
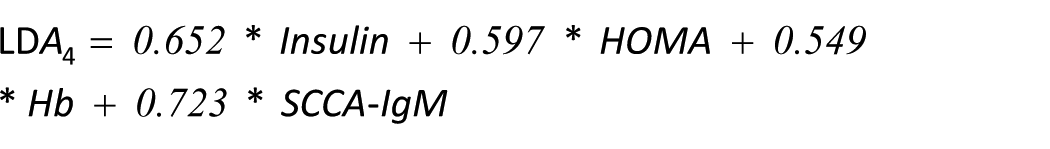
We performed two LDAs based on the correlation analysis findings. By combining the serological parameters with a highly significant correlation with NASH (insulin, HOMA, Hb and SCCA-IgM) we obtained the formula:
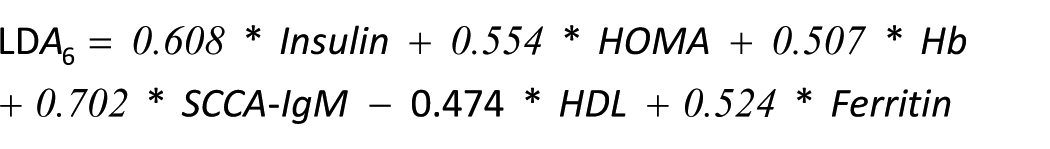
The combination of all the continual variables with a correlation with NASH (insulin, HOMA, Hb, SCCA-IgM, HDL and ferritin) produced the following equation:
Logistic regression
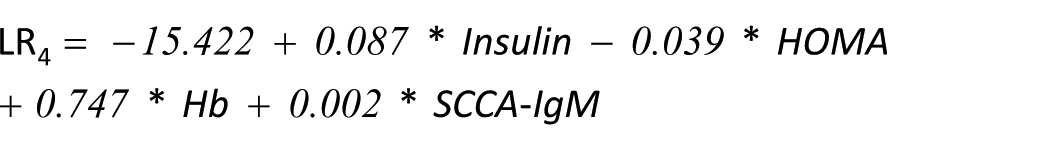
We performed a binary LR using only the biomarkers with a strong correlation with NASH (insulin, HOMA, Hb and SCCA-IgM), obtaining this equation:
We also carried out an LR analysis combining all parameters with a correlation with NASH (insulin, HOMA, Hb, SCCA-IgM, HDL, ferritin and smoke):
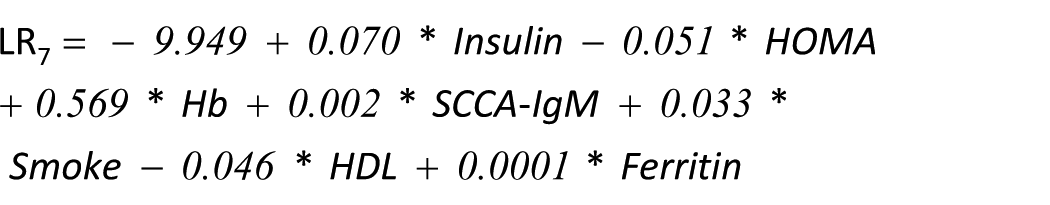
Other two regression analyses were performed using all markers with a correlation with NASH and applying a stepwise regression. The first approach was a forward selection, which gave this final formula:

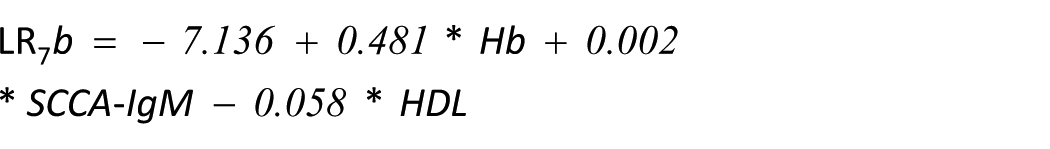
The second approach consisted of a backward elimination and produced the following equation:
Receiver operating characteristic curves
We calculated the ROC curves of individual variables and their combinations for the identification of NASH in our patients. Compared to the use of a single marker, the combination of four, six or seven variables produced a bigger AUC (Tab. III).
Area under the ROC curve (AUC)
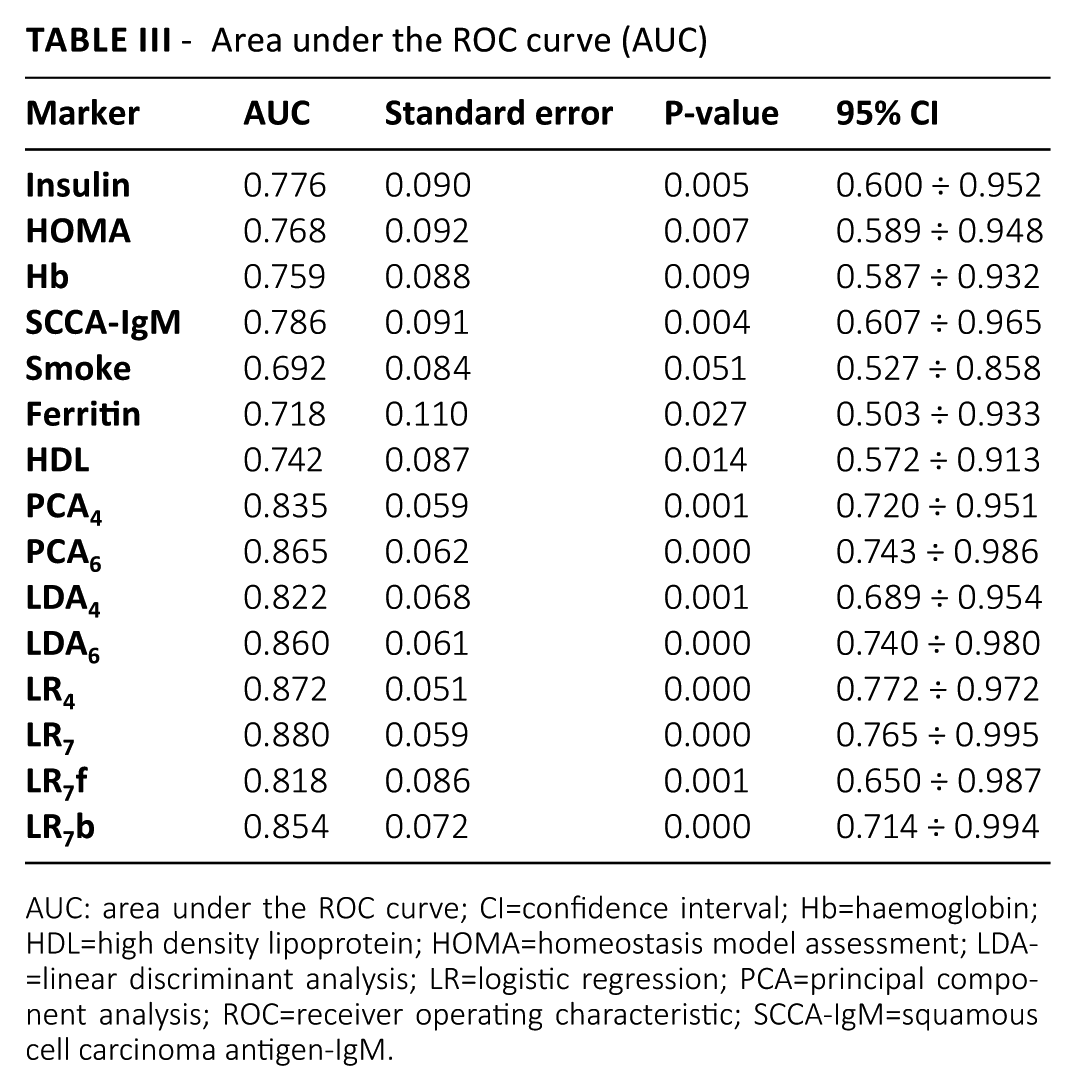
AUC: area under the ROC curve; CI=confidence interval; Hb=haemoglobin; HDL=high density lipoprotein; HOMA=homeostasis model assessment; LDA=linear discriminant analysis; LR=logistic regression; PCA=principal component analysis; ROC=receiver operating characteristic; SCCA-IgM=squamous cell carcinoma antigen-IgM.
The highest AUC value (0.880) was obtained with the combination LR7, which included all seven variables correlated with NASH. Among the single markers, SCCA-IgM showed the best AUC (0.786).
Conclusions
In HCV-positive patients, steatosis is common and it may promote the development of NASH (3); in addition, steatosis and NASH may induce faster liver fibrosis and evolution towards HCC (3). In order to avoid a quicker growth of liver cancer, it is important to identify patients with NASH and start treatment as early as possible. We showed that an algorithm combining SCCA-IgM serological levels with other common clinical data is a promising diagnostic tool for the detection of NASH in HCV patients, and it could improve the current methods to diagnose and monitor the disease in these patients.
Our analysis revealed seven clinical variables significantly correlated with the histological presence of NASH: insulin, HOMA, Hb, SCCA-IgM, smoke, HDL and ferritin. Our result confirms previous findings, which showed an association between NASH and insulinaemia, insulin resistance (3), Hb (11), elevated HOMA (12) and ferritin (13), and lower HDL levels (14) in HCV patients.
SCCA-IgM has been shown to be independently associated with presence of NASH in patients with HCV infection (10), and in our study it was the single variable with the best association with NASH. These findings support the use of SCCA-IgM to identify those patients with liver disease with a higher risk of progression to more severe stages.
The combination of multiple clinical parameters showed a higher correlation with NASH than any single marker. It is well known that the combination of multiple variables increases the accuracy of diagnostic algorithms; indeed, others have developed systems that combine various clinical values to identify patients with or at risk for NASH: the apoptosis panel (15), the NASH diagnostic panel (16), the oxNASH score (17), the NASH test (18), the Palekar test (19) and the Shimada index (20). However, none of these models was created specifically for HCV patients.
To our knowledge, the algorithms that we present are the first ones that may be used specifically to identify NASH in patients with HCV infection. The major limit of our study is the small number of patients that were available for the analysis; further validations in larger cohorts of patients are needed to confirm our findings.
Footnotes
Acknowledgements
The authors are deeply grateful to Giovanna Fattovich (formerly Professor of Gastroenterology at the University of Verona) for providing the clinical data and serological samples used in the study.
Disclosures
Financial support: This work was supported by the Slovak Research and Development Agency grants APVV-14-0294 and APVV-15-0111.
Conflict of interest: None of the authors has financial interest related to this study to disclose.