
Abstract
Introduction
Sepsis is defined as infection-induced systematic inflammatory response syndrome with a presence of bacteria or highly suspicious infection foci. 1 Pathological features of sepsis include septic shock and multiple organ injury or dysfunction, especially that in the lung.2,3 The available data showed that approximately six million population were died from sepsis-induced organs dysfunction per-year. 4 The morbidity and mortality rate of sepsis is highest in the world compared with other critical illness. 5
Gene association studies have identified some factors that may result in genetic susceptibility to sepsis.6,7 The Surviving Sepsis Guidelines recommends to use procalcitonin as the potential bio-markers to evaluate the period of ongoing antimicrobial treatment and dysfunction of renal and coagulation.3,8 An ideal sepsis bio-marker should have high specificity and sensitivity in diagnosis and prognosis prediction, providing a fast and cost-effective bedside assay and confronted validation. 9 Gene expression analysis was widely used in clinical disease detection owing to its sensitivity, efficiency and cost-effectiveness. Hence, genetic expression analysis of sepsis could provide a promising method for improving the success rate of emergency and severe treatment.
Various bio-informatics technology and analytical tools have been applied to explore disease processes, based on the identification of differently expressed genes (DEGs). To provide the novel bio-markers of nonsurvivor sepsis (NSS), bio-informatic methods are used to analyze the potential lethal genes for sepsis based on the Gene Expression Omnibus (GEO) database. Due to the lung is directly contacted with the outer environment, it serves as a primary target organ for many airborne pathogens, toxicants (aerosols or endotoxins), and allergens during sepsis. 10 In addition, these potential lethal genes would be validated in the animal model of sepsis-induced lung injury. Hence, this study would provide novel directions on the intervene and treatment of sepsis though the regulation of these identified lethal genes.
Materials and methods
Statement of ethics
After the examination by the Ethics Committee of Guangxi Medical University Affiliated Cancer Hospital (Number: LW2020025), the relevant materials of human genetic resources that downloaded from the GEO database are conformed to the requirements of medical ethics according to the institutional and national guidelines for the care and use of participates.
Microarray dataset
Using the available raw data in NCBI GEO database (http://www.ncbi.nlm.nih.gov/geo), we compared with gene expression profiles of the whole blood-derived RNA samples between NSS patients and healthy volunteers.The microarray expression dataset GSE54514 was obtained from Affymetrix GPL6947 platform (Affymetrix Illumina HumanHT-12 V3.0 expression beadchip), which was submitted by Parnell et al 11 between September, 2013 and October, 2018. Different from Parnell et al, we emphasized on the DEGs for immune response, cell apoptosis, oxidative phosphorylation and neuroendocrine changes between the NSS patients and healthy volunteers.
Identification of DEGs
To read and normalized the original data, the packages Affy, Limma and Impute of R software (version: x64 3.2.1) were used. The missing values were treated via k-nearest neighbor method. According to the criterion of fold change (FC) > 2 and adjusted p-value <.05, DEGs between the NSS patients and healthy volunteers were screened and identified from the normalized data. Heat and volcano maps of DEGs were constructed using Pheatmap and Ggplot2 packages of R software.
Functional annotation for DEGs
The GO project developed a framework to show the genes function and biological characteristics of high-throughput genomes. 12 KEGG pathway provided comprehensive analysis of cell pathways and connecting genomic function of the DEGs. 13 All DEGs were submitted to the online website DAVID (https://david.ncifcrf.gov/) to perform the GO enrichment and KEGG pathways with count >5 and p value <.01.
PPI network and modules analysis
STRING database (https://cn.string-db.org/) was applied to assess the interactive relationships of DEGs, and the experimentally validated interactions were defined as statistically difference with a combined score more than 0.4. Using Cytoscape software (version 3.6.1) demonstrated the PPI networks between the DEGs. The Molecular Complex Detection (MCODE) app in Cytoscape software was performed to determine the most critical module on the PPI network according to the inclusion criteria as the MCODE scores >5, degree of cut-off = 2, node score cut-off = 0.2, k-score = 2 and maximum depth = 100.
Identification and analysis of hub genes
Using cyto-Hubba app in Cytoscape software to screen the hub genes with degree≥10. 14 GO enrichment and KEGG pathway of these hub genes were performed using the DAVID database again. Using receiver operator characteristic curve analysis, we determined the specialty and sensitivity of these hub genes for predicting NSS. Information and function of these hub genes was searched via BioGPS (http://biogps.org/#goto=welcome) and Uniprot database (https://www.uniprot.org/).
Animal models and sample collection
Wild type C57BL/6J mice were obtained from the Animal Center of Guangxi Medical University (Nanning, China). The experimental operation flow and animal handling were both approved by the Institutional Animal Care and Use Committee of Guangxi Medical University. To verify the role of hub genes in the septic lung, 12 mice were intraperitoneally injected with lipopolysaccharide (LPS, 20 mg/kg), 15 and another 12 mice were received equivoluminal phosphate buffer saline (PBS) by intraperitoneal injection. After the treatment with LPS injection 24 h, the right primary bronchi in the trachea carina was ligatured, and then the left lung bronchoalveolar lavage was harvested by douching with ice-cold PBS. Further, an incision was made in the left ventricle and ice-cold PBS was used to wash left lungs until whitening was apparent. The right lung was obtained for paraffin embedding.
Verification of animal model
The wet/dry weight (W/D) ratio from right upper lobe of lung was calculated to estimate lung edema during LPS induced lung injury. The right lower lung lobe was fixed with 10% formaldehyde, embedded with paraffin and stained with hematoxylin and eosin. The degree of lung injury was scored according to alveolar congestion, hemorrhages, neutrophil infiltration and incrassation of the alveolar wall with a five-point score: 0, minimal injury; 1, mild injury; 2, moderate injury; 3, serious injury; and 4, maximal injury. 16 Simultaneously, some lung samples were cut for transmission electron microscope (TEM) scanning to observe ultrastructural changes of lung epithelial cells.
Immunohistochemistry techniques
The sections were undergoing dewaxing, hydration, antigen retrieval and endogenous peroxidases blocking. Then, primary antibodies of hub genes coded proteins was used and their corresponding horseradish peroxidase-conjugated antibodies used as secondary antibody, with DAPI for nuclear staining. Simultaneously, the negative control slides were incubated with PBS instead of primary antibodies. Histological images were observed and saved using an Axio Scope A1 microscope (Zeiss, Oberkochen, Germany) and an AxioCam ICc3 camera (Zeiss).
The expression of these proteins were evaluated by a semi-quantitative scoring system using Image-Pro Plus 6.0 software (Media Cybernetics, Rockville, MD, USA). Briefly, staining intensity and percentage were semi-quantitative scored by the following criteria including no staining as negative = 0, yellow as mild = 1, light brown as moderate = 2, and dark brown as strong = 3. Then, five regions were randomly selected in one sample, and the average percentage of positive cells was calculated by counting the number of positive cells out of 200 cells. Samples were further grouped into the following categories: 0 (0%), 1 (1%–10%), 2 (11%–50%), 3 (51%–80%) and 4 (81%–100%). Finally, a final score of ≥3 was considered as high expression and a score <3 was regarded as low expression.
Western blotting analysis
Total proteins were extracted from whitened left lung tissues and then assessed by bicinchoninicacid assay to determine its concentration. The equivalent samples were separated using SDS-polyacrylamide gel. The proteins were then transferred onto a nitrocellulose membrane, which was blocked with 5% bovine serum albumin and 0.1% Tween-20 dissolved in Tris-buffered saline. The blocked membranes were incubated by primary antibodies of hub genes coded proteins and β-actin as internal reference at 4°C overnight. Using horseradish peroxidase-conjugated mouse anti-rabbit antibody as a secondary antibody incubated the cleaned membranes at the next day. The bands of each protein were scanned via a West Pico enhanced chemiluminescence kit (Thermo Fisher Scientific). These results were assessed by a semi-quantitative scoring system using Image Lab. 4.1 software (Bio-Rad, Hercules, CA, USA).
Statistical analysis
The data were analyzed by SPSS 22.0 software. All quantitative data were showed as mean ± SD. Independent sample t test was carried out to analyze the comparison between control and septic group. The statistical difference was defined as p value less than 0.05.
Results
Identified DEGs between NSS and healthy blood samples
The presentation of the identified DEGs was performed by all nodes in volcano plot between NSS and healthy blood samples (Figure 1(a)). The nodes were marked as blue or red, based on the cut-off criterion (fold change ≥2 and adjusted p value <.05). The up-regulated and down-regulated DEGs, between NSS blood and healthy blood, were shown as red dots or blue dots, respectively. Figure 1(b) and 1(c) showed the circular cluster map of top 10 up-regulated and down-regulated DEGs. Finally, 105 up-regulated and 83 down-regulated DEGs were screened and identified from the GSE54514 dataset. The heat map of the top 10 up-regulated and down-regulated DEGs was displayed in Figure 1(d). Identified DEGs between blood samples from healthy control individuals and patients with NSS. (a) A volcano plot showing the all identified DEGs between NSS and control blood samples via analysis of the GSE54514 dataset with R software. The X-axis presents the log-scaled fold-change and the Y-axis indicates the negative logarithm of adjusted p-value. Each symbol shows a gene. The red symbols indicate upregulated genes; while blue symbols present downregulated genes. (b) Circular cluster map of up-regulated DEGs. (c) Circular cluster map of down-regulated DEGs. (d) A heatmap showing the top 20 DEGs between NSS and control blood samples via analysis of the GSE54514 dataset with R software. Singular samples: NSS blood sample; double samples: normal blood sample. Red: up-regulation; green: downregulation.
GO Functional enrichment and KEGG pathway analysis
The results of GO categories demonstrated that the identified DEGs were significantly enriched in such BP as type I interferon (IFN) signaling pathway, translation, movement of cell or subcellular component, ephrin receptor signaling pathway, defense response to virus, apoptosis, positive regulation of nuclear factor (NF)-κB transcription factor activity (Figure 2(a) and (b)); Enrichment of DEGs in CC included the extracellular exosome, cytosol, membrane, early endosome, cytoplasm, extracellular matrix, focal adhesion and mitochondrion (Figure 2(c)), and in MF included protein binding, protein complex binding and structural constituent of ribosome (Figure 2(d)). The KEGG pathway analysis results showed that the DEGs were mainly enriched in Fc Gamma R-mediated phagocytosis (Figure 2(e)). Figure 2(f) and 2(g) showed the network of GO analysis classified with terms and p value respectively. Enrichment function analysis of all identified DEGs. Detailed information relating to enrichment function in the (a) GO chord of top 10 DEGs; (b) biological processes, (b) cellular components, (c) molecular function and (e) KEGG pathway for all identified DEGs. (f) Network of GO analysis classified with terms. (g) Network of GO analysis classified with p value. NSS, nonsurvival sepsis; DEGs, differently expressed genes.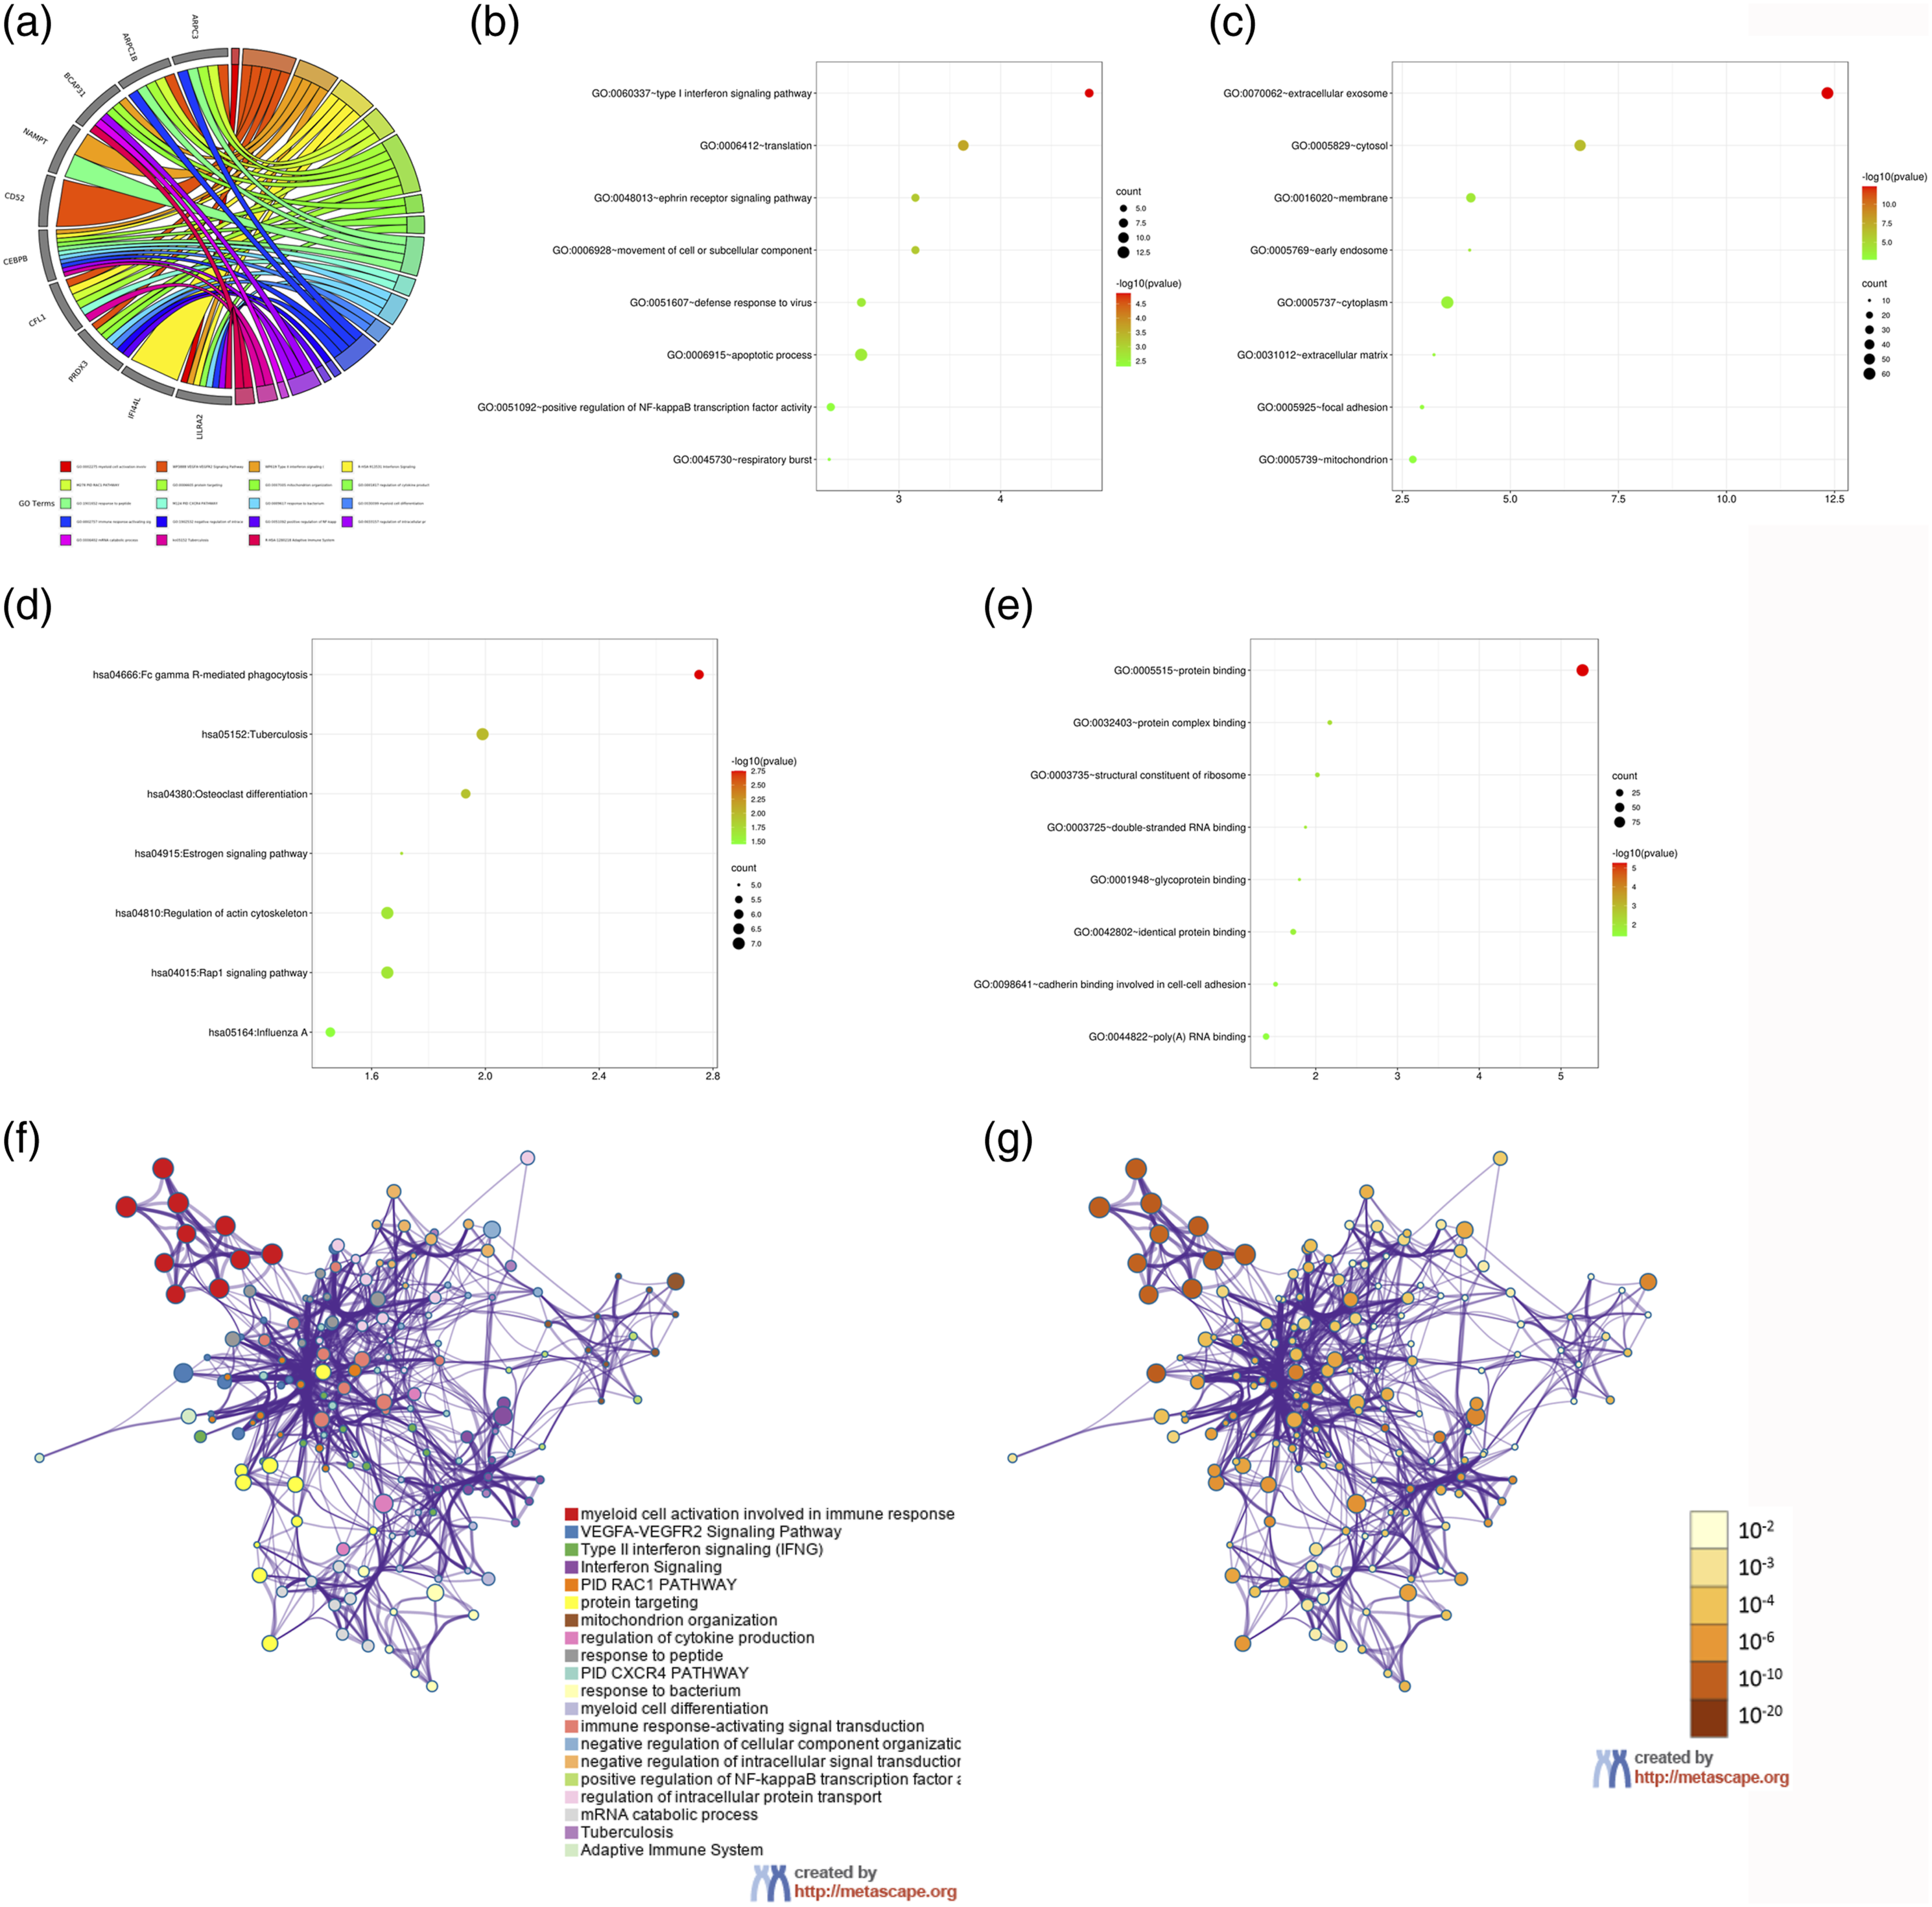
PPI and module network construction
Framing of the PPI network and determination of significant modules were conducted with 336 edges and 114 nodes in Figure 3(a). According to previous defined criteria, we identified two clusters of the most important module on the PPI network map (Figure 3(b) and 3(c)). The first cluster included 96 edges and 15 nodes (MCODE scores = 13.714), and another cluster possessed 52 edges and 12 nodes (MCODE scores = 9.455). Protein-protein interaction network and two significant module networks. (a) The PPI network presenting the intricate relationships between all identified DEGs. (b) The first significant module network determined based on the analysis of protein-protein interaction network. (c) The second significant module network identified based on the analysis of protein-protein interaction network.
Hub genes screen and analysis
With degrees≥10, there were of 32 hub genes identified, consisting of 162 edges and 32 nodes in the constructed PPI network as shown in Figure 4(a). The expression and PPI network of top 10 hub genes were performed in Figure 4(b) and 4(c). These hub genes were analyzed using GO enrichment and KEGG pathway. The results of these analyses showed that hub genes were significantly enriched in such BP as translation, response to virus, suppression of mitochondrial depolarization and extrinsic apoptotic signaling pathway in absence of ligand, protein ubiquitination related to ubiquitin-dependent protein catabolism, release of cytochrome c from mitochondria, innate immune response, and endodermal cell differentiation (Figure 4(d) and 4(e)). In the CC results, hub genes were mainly enriched in the mitochondrial inner membrane (p = .038). As for variations in the MF, hub genes were mainly enriched in ligase activity, structural constituent of ribosome and cytochrome-c oxidase activity (Figure 4(d) and 4(e)). KEGG pathways demonstrated that hub genes were significantly enriched in such cell pathway as influenza A infection and leukocyte transendothelial migration (Figure 4(f) and 4(g)). Protein-protein interaction network and enrichment function analysis of the screened hub genes. (a) The protein-protein interaction network of the total of 32 genes as hub genes with degrees ≥10. (b) A heatmap showing the correlations between these hub genes. The color represents the intensity of the correlation. It indicates a positive correlation between the values of 10.2511∼20.5022 while a negative correlation between the values of 0∼10.2511. The larger the absolute value represents the stronger the correlation. (c) The protein-protein interaction network of these hub genes. (d) Biological processes analysis for hub genes. (e) GO chord of top 10 hub genes. (f) KEGG pathway analysis for hub genes. (g) Network of GO analysis classified with terms.
Here, the top 10 hub genes were STAT1, ISG15, HERC1, EIF2AK2, RPL27, LY6E, IFI44L, XAF1, RSAD2 and HERC6. The relative expression of these hub genes was performed in Figure 5(a) and 5(b). Table 1 showed the detailed information and function. To determine accurate thresholds of hub genes to predict NSS, receiver operator characteristic curves were performed. The expression of these hub genes involved in a diagnosis of NSS (0.7<AUC<1 and p ≤ .05) as shown in Table 2, and the receiver operator characteristic curves of these hub genes were presented in Figure 5(c)–5(l). Relative analysis of the top 10 hub genes including STAT1, ISG15, HERC1, EIF2AK2, RPL27, LY6E, IFI44L, XAF1, RSAD2 and HERC6. (a) and (b) Expression of these hub genes in the blood sample from healthy control individuals and patients with NSS. (c–l) Receiver operator characteristic curves indicating that these top 10 hub genes could sensitively and specifically predict NSS. NSS, nonsurvival sepsis;; STAT1, signal transducer and activator of transcription one; ISG15, ISG15 ubiquitin like modifier; HERC1, H HECT domain and RCC1-like domain-containing protein one; EIF2AK2, eukaryotic translation initiation factor 2 alpha kinase two; RPL27, ribosomal protein L27; LY6E, lymphocyte antigen six family member E; IFI44L, interferon induced protein 44 like; XAF1, XIAP associated factor 1; RSAD2, radical S-adenosyl methionine domain containing two; HERC6, HECT and RLD domain containing E3 ubiquitin protein ligase family member 6. *p < .05 versus CON group; **p < .01 versus CON group; ***p < .001 versus CON group. Summaries for the top 10 hub genes. Receiver operator characteristic curve analysis of the top 10 hub genes. NSS, nonsurvive sepsis; AUC, area under curve; ODT, optimal diagnostic threshold.


Administration of LPS 20 mg/kg triggers acute lung edema and injury
Mice treated with LPS 20 mg/kg caused an increase in the ratio of W/D and pathological score compared with control group (Figure 6(a) and 6(b)). Although only one mouse died in control group at the seventh day, a significant difference in postoperative survival between the two groups for 1-week survival was observed (p = .014; Figure 6(c)). Obviously, 20 mg/kg of LPS injection favored infiltration of neutrophils and accumulation of protein-rich fluid in the alveolar space, and disorder of lung structure compared with control mice (Figure 6(d)). Furthermore, ultrastructure of lung epithelial cells following 20 mg/kg of LPS injection showed karyopyknosis, disorder structure of cell membrane and organelles edema (Figure 6(e)). Septic lung injury in mice treated with PBS (CON) or 20 mg/kg LPS. (a) Lung edema was evaluated by calculating the wet/dry weight ratio. (b) Pathological scores were used based on the results of hematoxylin and eosin staining. (c) Survive cure between the CON and Sepsis group. Both of these experiments were repeated three times. (d) Histology of lung tissues were stained with hematoxylin and eosin. (e) Transmission electron micrographs of type II alveolar cells. Both of these experiments were repeated three times. *p < .05 versus CON group.
Expression of ISG15, RPL27, LY6E and HERC6 in the septic and control mice
According to the results of Table 2, the relatively high-expression hub genes in the lung with NSS were ISG15, RPL27, LY6E and HERC6. The assessment of Western blotting showed that 2.0 mg/kg of LPS injection upregulated the expression of ISG15, RPL27, LY6E and HERC6 (Figure 7(a)–7(d)). Simultaneously, the results of IHC showed the same trends for the expression of these genes (Figure 7(e)–7(g)). Protein expression of ISG15, RPL27, LY6E and HERC6 by IHC in mice treated with PBS (CON) or 20 mg/kg LPS (Sepsis). (a) Levels of ISG15. (b) Levels of RPL27. (c) Levels of LY6E. (d) Levels of HERC6. (e) Average percentage of positive cells in the Sham, ISG15 and RPL27 expression. (f) Average percentage of positive cells in the Sham, LY6E and HERC6 expression. (g) Protein expression of these hub genes by IHC. Both of these experiments were repeated three times. *p < .05 versus CON group; **p < .01 versus CON group; ***p < .001 versus CON group.
Discussion
Inflammation and multiple organ injury are the most common and prominent feature of sepsis, in particular NSS. 17 Since lacking of treatment strategy to significantly attenuate inflammation and organ injury, current treatment for sepsis mainly focuses on antimicrobial treatment and multi-organ support. Due to high mortality and high incidence of complications, the exploration of the molecular mechanism that involves in sepsis especially NSS progress and risk prediction of severe organ damage favors considerable importance to the diagnosis, treatment and prevention of NSS.
In the present study, several bio-informatics methods were used to analyze original data and identify hub genes in NSS. The microarray data GSE54514 was used to screen DEGs and 188 DEGs were finally discovered that shared top 10 hub genes: STAT1, ISG15, HERC1, EIF2AK2, RPL27, LY6E, IFI44L, XAF1, RSAD2 and HERC6. Among them, ISG15, RPL27, LY6E and HERC6 were relatively high-expressed hub genes in the lung, showing the better specificity between samples of NSS or healthy volunteers.
It showed that the resistance to endotoxin-induced shock was improved in STAT1-deficient mice. 18 Park et al 19 found that histone deacetylase four controls the acetylation of high mobility group box 1 in LPS-stimulated macrophages via the janus kinase/STAT1 pathway. Biflorin favors the negative regulation of pro-inflammatory factor expression through p38 mitogen-activated protein kinase and STAT1 deactivation in macrophages as result to protect mice from endotoxin shock. 20 In the LPS-treated monocytes, miR-30a suppressed the release of interleukin-10 by targeting STAT1-MD-2, that is a LPS-binding protein formed a heterodimer with Toll-like receptor. 21 Therefore, these results suggested that STAT1 plays a deleterious role in sepsis especially endotoxin induced sepsis and accelerate the progress of inflammation and multiple organ injury.
HERC1 regulates the ERK pathway by acting C-RAF for inhibiting cell proliferation, contain a putative BH3 domain to bind to BAK for UV-induced apoptosis and interact with tuberous sclerosis complex two protein for regulating cell growth.22–24 EIF2AK2-mediated stress response regulated by TIA1 RNA-binding protein family is involved in the fidelity of mRNA translation and maturation, and RNA-stress-sensing pathways in human cell. 25 Another study showed that EIF2AK2 is an activator of the NLRP3 inflammasome to influence the occurrence and development of inflammatory bowel disease. 26 Gomez-Carballa et al 27 found that IFI44L favored superior results than those got from the 2-transcript test to discriminate between viral from bacterial infection in febrile children. Interestingly, the upregulation of XAF1 protein comprise an positive effect of β-cell apoptosis and interferon-β production because of metabolic endotoxemia-induced macrophages activation and infiltration in islets. 28 Furthermore, RSAD2 is positively associated with mature dendritic cells function and essential for its maturation through the IRF7-mediated signaling pathway for T cell-mediated immunity. 29 These hub genes showed a crucial role for cell growth, proliferation and apoptosis by regulation of inflammation and immunity, which maybe the reason of differential expression between the NSS patients and healthy volunteer.
Using BioGPS (http://biogps.org/#goto=welcome) and Uniprot database (https://www.uniprot.org/) to obtain the information and function of the hub genes, we found that ISG15, RPL27, LY6E and HERC6 were displayed positive effect in lung injury. Furthermore, in mice undergoing LPS-induced lung injury, the expression of these four hub genes were both up-regulated compared with control mice. ISG15 plays a crucial role in innate immune response as intracellular protein modifier and extracellular signaling molecule to stimulate the secretion of interferon-γ.30,31 Human intracellular ISG15 is also served as a substrate for ISGylation-mediated antiviral immune response to prevent interferon-α/β over-amplification and auto-inflammation. 32 These studies were both concentrated on the role of ISG15 in the cancer cell growth and viral resistance, but whether ISG15 functions as a crucial role in sepsis remains unclear.
RPL27 is a mitochondrial ribosomal protein that functions in proper rRNA processing and maturation of 28S and 5.8S rRNAs. 33 However, there were no studies found to demonstrate the role of RPL27 in cell growth, inflammation or immunity. Xu et al 34 showed that the regulatory LY6E pathway serve as one of negative regulation of counterpoise monocyte activation in LPS-stimulated monocytes, which might be induced by the impaired gastrointestinal tract during ongoing HIV-1 infection. LY6E pertains to the class of interferon-inducible host factors that increase viral infectivity without inhibition of interferon antiviral activity35–37 which may be contributed to the poor prognosis of sepsis. Previous studies38,39 showed that murine HERC6 plays a crucial function in protein ISGylation to improve the interferon-β promoter and confer antiviral activity.
However, sepsis is significantly associated with immune cells infiltration, pivotal immune and molecular pathways, such as inflammation-promoting, complement and coagulation cascades using the cluster of costimulatory molecule genes. 40 There were another study to identify autophagy-related genes in sepsis based on machine learning algorithms. 41 Lu J and his colleagues 42 used modified Lasso penalized regression to identify differentially expressed immune-related genes including ADM, CX3CR1, DEFA4, HLA-DPA1, MAPK14, ORM1, RETN, and SLPI. It also reported that a HLA classifier in sepsis were constructed by five identified HLA genes, such as B2M, HLA-DQA1, HLA-DPA1, TAP1, and TAP2. 43 Unlike the reported paper 44 used the dataset GSE65682 to identify master regulators of transcription factors and miRNA, present study directly showed the potential lethal genes across the survivor and nonsurvivor sepsis using whole-genome.
Although the present work involves systematic and rigorous bio-informatics analysis, there still are some limitations. The one of limitation is lack of in vivo or vitro experiments to further reveal potential mechanisms of sepsis. Second, the preliminary works were lack of another machine learning methods to select potential biomarkers, such as LASSO, RF, SVM. Third, the molecular and experimental results of this study are based on the common target lung and results of other target organs such as heart and liver were necessary. This is the bioinformatic study based on the whole-genome in sample of the survivor and nonsurvivor sepsis patients, which did not meet the calculation and justification of the sample size selected. Additionally, the sample size of mouse experiments was abide with previous study instead of power analysis for sample size calculation.
Conclusion
Using several bio-informatics methods obtained 188 DEGs and 10 hub genes related to NSS (STAT1, ISG15, HERC1, EIF2AK2, RPL27, LY6E, IFI44L, XAF1, RSAD2 and HERC6) from the GEO database, especially ISG15, RPL27, LY6E and HERC6 highly expressed in the sepsis-induced lung injury in mice. Although there are several contradictions and ambivalence of the roles these hub genes played in NSS, the present study demonstrates that exploration and elucidation of these areas would provide new potential targets and prospects for the diagnosis, treatment and prediction of NSS.
Footnotes
Author’s note
Zhaokun Hu and Ren Jing are also affiliated with Guangxi Clinical Research Center for Anesthesiology and with Guangxi Engineering Research Center for Tissue & Organ Injury and Repair Medicine, Nanning, China. Yan Ma, Shichao Shan, Cheng Luo, and Jianlan Mo are affiliated with Departement of Anesthesiology, the Maternal and Child Health Hospital of Guangxi Zhuang Autonomous Region, which is the offical names of their affiliation.
Acknowledgments
We sincerely acknowledge Parnell GP and his colleagues for their original work on expression profiling by array. We thank all co-authors for support from data collecting to revising manuscript.
Author contributions
Ren Jing conceived and designed the study. Yan Ma and Shichao Shan was a major contributor in writing the manuscript and submitting the manuscript. Cheng Luo carried out the animal experiments; Zhaokun Hu collected the dataset and analyzed the data; Jianlan Mo made substantial contributions to research conception, and designed the draft of the research process.
Declaration of conflicting interests
The author(s) declared no potential conflicts of interest with respect to the research, authorship, and/or publication of this article.
Funding
The author(s) disclosed receipt of the following financial support for the research, authorship, and/or publication of this article: This work was supported by the grants from the National Natural Science Foundation of China (81970078), Guangxi Anesthesiology Clinical Medicine Research Center Construction Project (scientific foundation of Guangxi No: 2022AC04002), Youth Science Foundation of Guangxi Medical University (GXMUYSF202120), and Innovation Project of Guangxi Graduate Education (YCBZ2021043).
Ethical approval
Ethical approval for this study was obtained from Ethics Committee of Guangxi Medical University Affiliated Cancer Hospital (Number: LW2020025).