
Abstract
The aim of this study was to confirm whether chronic low-grade inflammation could induce autophagy and damage in islet cells. The high-fat diet (HF) and low-dose lipopolysaccharides (LPS) were used to simulate chronic inflammation. Islet function was observed, the expression of autophagy-related proteins and the activity of glucose synthase kinase 3β (GSK-3β) were detected, and the role of autophagy in islet injury induced by inflammation was explored. Higher blood glucose was observed in HF group and LPS group compared with control (C) group, and there was no significant difference between LPS group and LiCl group. The apoptotic pancreatic islet cells in the LPS group were higher than in the HF and C groups, and the in the LiCl group they were higher than in the C group and lower than in the LPS group. Compared with the C group, LC3II/I ratio in the HF group was increased (P < 0.05), in LPS and LiCl groups it was lower than in the HF group, and in LiCl group it was higher than in the LPS group. There was no significant difference between HF group and C group with regard to the ratio of p-GSK-3β/GSK-3β, but in the LiCl group it was higher than in the LPS group. The results demonstrated that low-grade inflammation might cause autophagy flux impaired through activation of GSK-3β, and induced islet cells damage. LiCl could play a role in protecting islet cells through autophagy enhancement.
Introduction
In recent years, metabolic disorders (such as obesity and diabetes) have become a major public health problem in the world, increasing the economic burden of the society and family. The number of obese and overweight people with type 2 diabetes mellitus (T2DM) is increasing, which is characterized by chronic low-grade inflammation. Chronic low-grade inflammation is induced by lifestyle habits, 1 which promote the development of obesity and diabetes. More research has shown that change in autophagy and excessive inflammatory reaction plays an important role in many diseases. Autophagy is an intracellular degradation system and as the related damaged proteins and dysfunctional organelles are delivered to autophagosomes, autophagy was regarded as a protective mechanism. 2 However, abnormal autophagy might result in cell death. Inflammation is a defense reaction in face of pathogen infection or damage, but excessive inflammation is often uncontrolled, resulting in tissue damage and inflammatory diseases. The interconnection between autophagy and inflammation is mainly described in inflammatory bowel diseases, cardiac disorders, and cystic fibrosis.3–5 However, the connection between chronic inflammation-induced damage in islet cells and autophagy remains unclear.
Glucose synthase kinase 3β (GSK-3β) is one isoform of GSK-3, which is a serine/threonine kinase that regulates a variety of cellular functions including glycogen synthesis, proliferation, metabolism, and apoptosis. Besides, GSK-3β could be increasing implicated to play an essential role in regulating both pro- and anti-inflammatory responses. In a study of acute renal failure model, the activation of GSK-3β could promote the secretion of interleukin 6 (IL-6), IL-1, tumor necrosis factor α (TNF-α), and its inhibitor could improve the survival rate of mice.6,7 Scholars have confirmed that GSK-3β could activate autophagy through TIP60/ULK1 pathway in cells deprived of growth factors. 8 GSK3 inhibition could induce pro-survival signals through increased activity of the autophagy in pancreatic cancer cells. 9 GSK-3β might act as a bridge on inflammation and autophagy. However, whether chronic low-dose lipopolysaccharides (LPS)-induced activation of GSK-3β could induce autophagy and cause damage in islet cells, needs to be verified.
In this study, we investigated the effects of LPS on pancreatic islet cells, including inflammation and autophagy, and in particular, to detect whether this function of LPS was related to the activation of GSK-3β.
Material and methods
Animal
Wild-type C57BL/6J male mice (7–8 weeks) were purchased from HFK Bioscience Co. Ltd (Beijing, China), and handled according to the protocol approved by the Animal Research Protection Committee of China. These mice were maintained under specific pathogen-free (SPF) conditions with a 12/12 h light/dark cycle. Temperature and relative humidity were 20°C to 25°C and 40% to 60%, respectively. Standard feeding was carried out for 1 week before the experiment.
A total of 40 male mice were used, and divided into two groups in the first 7 weeks: Control (C) group (n = 10, standard diet) and high fat (HF) group (n = 30, high-fat diet). All the mice were divided into four groups (n = 10 per group) from the eighth week to the 11th week: (1) Control (C) group, with standard diet; (2) high fat (HF) group, with high-fat diet during the whole period; (3) lipopolysaccharides (LPS) group, with high-fat diet during whole period and subcutaneous injection of 300 μg/kg/day LPS for the last 4 weeks; (4) LiCl group, with high-fat diet during whole period, subcutaneous injection of 300 μg/kg/day LPS for the last 4 weeks, and intraperitoneal injection of 120 mg/kg/day LiCl during the last 6 days (Figure 1). When mice were injected in LPS and LiCl groups, a corresponding volume of 0.9% normal saline was injected as control in C and HF groups.

Schematic diagram of animal grouping. SD: standard diet (for C group); HF: high-fat diet group; LPS: lipopolysaccharides, LPS group was with high-fat diet during whole period and subcutaneous injection of 300 μg/kg/day LPS for last 4 weeks; LiCl group was with high-fat diet during the whole period, subcutaneous injection of 300 μg/kg/day LPS for last 4 weeks, and intraperitoneal injection of 120 mg/kg/day LiCl during the last 6 days.
Before and after injection (seventh week and 11th week), intraperitoneal glucose tolerance test (IPGTT) and insulin tolerance test (ITT) were performed to assess insulin sensitivity. At the end of treatment, mice were killed, and pancreatic, liver, and adipose tissues were collected. A half of each of the tissues were fixed in 10% formalin-fixed liquid for staining, the rest were stored at −80°C after freezing in liquid nitrogen.
Islets were isolated and purified before being sampled and stored. Collagenase P was injected into the pancreatic duct following incubation in water bath to digest pancreas and isolate the islets. Discontinuous gravity gradient purification was used to purify the islet. The purified islets were identified by dithizone staining.
IPGTT and ITT
IPGTT
Mice were fasted overnight before intraperitoneal injection of glucose at 1.0 g/kg body weight. Blood glucose concentrations were measured at 0, 10, 30, 60, and 120 min after glucose injection using blood glucose meter and paper (Roche Accu-Chek, Mannheim, Germany).
ITT
Mice were fasted for 2 h and injected intraperitoneally with insulin at 0.5 IU/kg body weight. Blood glucose concentrations were measured at 0, 10, 30, 60, and 120 min. Area under the curve (AUC) of IPGTT and ITT were calculated.
Immunohistochemical staining
Immunohistochemical staining sections (4 μm) were made from tissues fixed with 10% formalin. Microwave antigen retrieval occurred in citrate buffer, pH 6.0. Endogenous peroxidase was blocked with 0.3% H2O2 for 20 min. The sections were blocked with 10% goat serum to minimize the non-specific staining, then stained with 1:600 dilution of polyclonal rabbit proliferating cell nuclear antigen (PCNA) antibody (Sigma), a 1:100 dilution of polyclonal rat F4/80 (Santa Cruz Biotechnology), or 1:800 dilution of guinea pig polyclonal anti-insulin (Abcam) and rabbit anti-LC3 (MBL) for double immunohistochemistry staining at 4°C overnight. The primary antibody was detected by incubating with labeled streptavidin–biotin horseradish peroxidase for 1 h at room temperature, then incubated with DAB or DAPI and examined under the microscope (Olympus, Tokyo, Japan).
TUNEL staining assay
TMR red kit (Roche, Palo Alto, CA) was used for TUNEL staining. According to the instructions, operational procedure is briefly as follows: the sections were incubated in a permeabilization buffer and followed TUNEL reaction mixture. The sections were washed three times using phosphate-buffered saline (PBS) before incubating with DAPI for 10 min and analyzed in a mounting medium under a fluorescence microscope. The TUNEL-positive cells and total cells in the islets were counted under a 40× objective microscope lens by an investigator who was blinded to the experiments.
Western blotting analysis
Fresh islets isolated from mice of four groups were lysed in RIPA buffer for 30 min on ice and centrifuged at 14,000 r/min for 15 min at 4°C. Protein concentration was determined using bicinchoninic acid (BCA) protein assay kit (Thermo). Total protein (70 µg) was loaded for 14% sodium dodecyl sulfate–polyacrylamide gel electrophoresis (SDS-PAGE), transferred to a polyvinylidene fluoride (PVDF) membrane, blocked with 5% skim milk for 1 h at room temperature, and incubated with the following primary antibodies at 4°C overnight: rabbit anti-LC3 (1: 2000; MBL), rabbit anti-P62 (1:4000; MBL), rabbit anti-GSK-3β (1:4000; MBL), and rabbit anti-p-GSK-3β (1: 4000; MBL). Blots were subsequently probed with alkaline phosphatase-labeled anti-rabbit immunoglobulin G (IgG; 1:4000; Santa Cruz Biotechnology). Immunoreactive band was visualized using BCIP/NBT kit (Invitrogen). Relative band densities of the indicated target proteins were measured using ImageJ (V1.46) software.
Statistical analysis
The differences between control and experimental groups were determined using one-way analysis of variance (ANOVA). Student’s t-test was conducted for paired samples. Data were expressed as mean ± SEM, and the differences between group mean values with P < 0.05 were considered statistically significant.
Results
Diabetes induction of HF
The body weight of HF diet group was much higher than that of the C group (P < 0.05). The high-fat diet began at the end of third week and continued until the seventh week (Figure 2(a)).

Results of high fat influence on mice at 7 weeks of treatment. (a) Change of body weight treated by high fat. (b) Results of IPGTT after high fat treatment. (c) AUC during IPGTT after being induced by high fat for 7 weeks. (d) Results of ITT after high fat treatment. (e) AUC during ITT after being induced by high fat for 7 weeks. AUC: area under the curve; C: Control group; HF: high fat group; IPGTT: intraperitoneal glucose tolerance test; ITT: insulin tolerance test. Data are expressed as mean ± SD for each group. *P < 0.05 versus C group.
To assess the function of islet β cell, IPGTT and ITT were carried out for all the mice. After high-fat diet for 7 weeks, fasting glucose level increased, but there was no significant difference between the C group and HF group. Compared with the C group, blood glucose at 30 min and AUC of glucose levels in HF group were significantly higher than in the C group (P < 0.05; Figure 2(b) and (c)). ITT results show that there was no significant difference between C and HF groups at every time point (Figure 2(d)). However, the AUC of glucose levels of HF group was significantly greater than that of the C group (P < 0.05; Figure 2(e)).
Physiological effects of LPS on diabetic mice
The results of IPGTT and ITT at the end of treatment (11 weeks) demonstrated that fasting glucose level increased significantly in HF group and LPS group (P < 0.05) compared with the C group. And there was no significant difference in fasting glucose level between the LiCl group and C group (Figure 3(a)). Blood glucose at 15, 30, 60, and 120 min and the AUC were significantly higher in HF, LPS, and LiCl groups than in the C group (P < 0.05). Whether it was blood glucose level or AUC, there were no significant difference between the HF group and LPS group. Compared with the LPS group, blood glucose at 60 min and AUC of glucose level were significantly decreased in LiCl group (P < 0.05; Figure 3(a) and (b)).
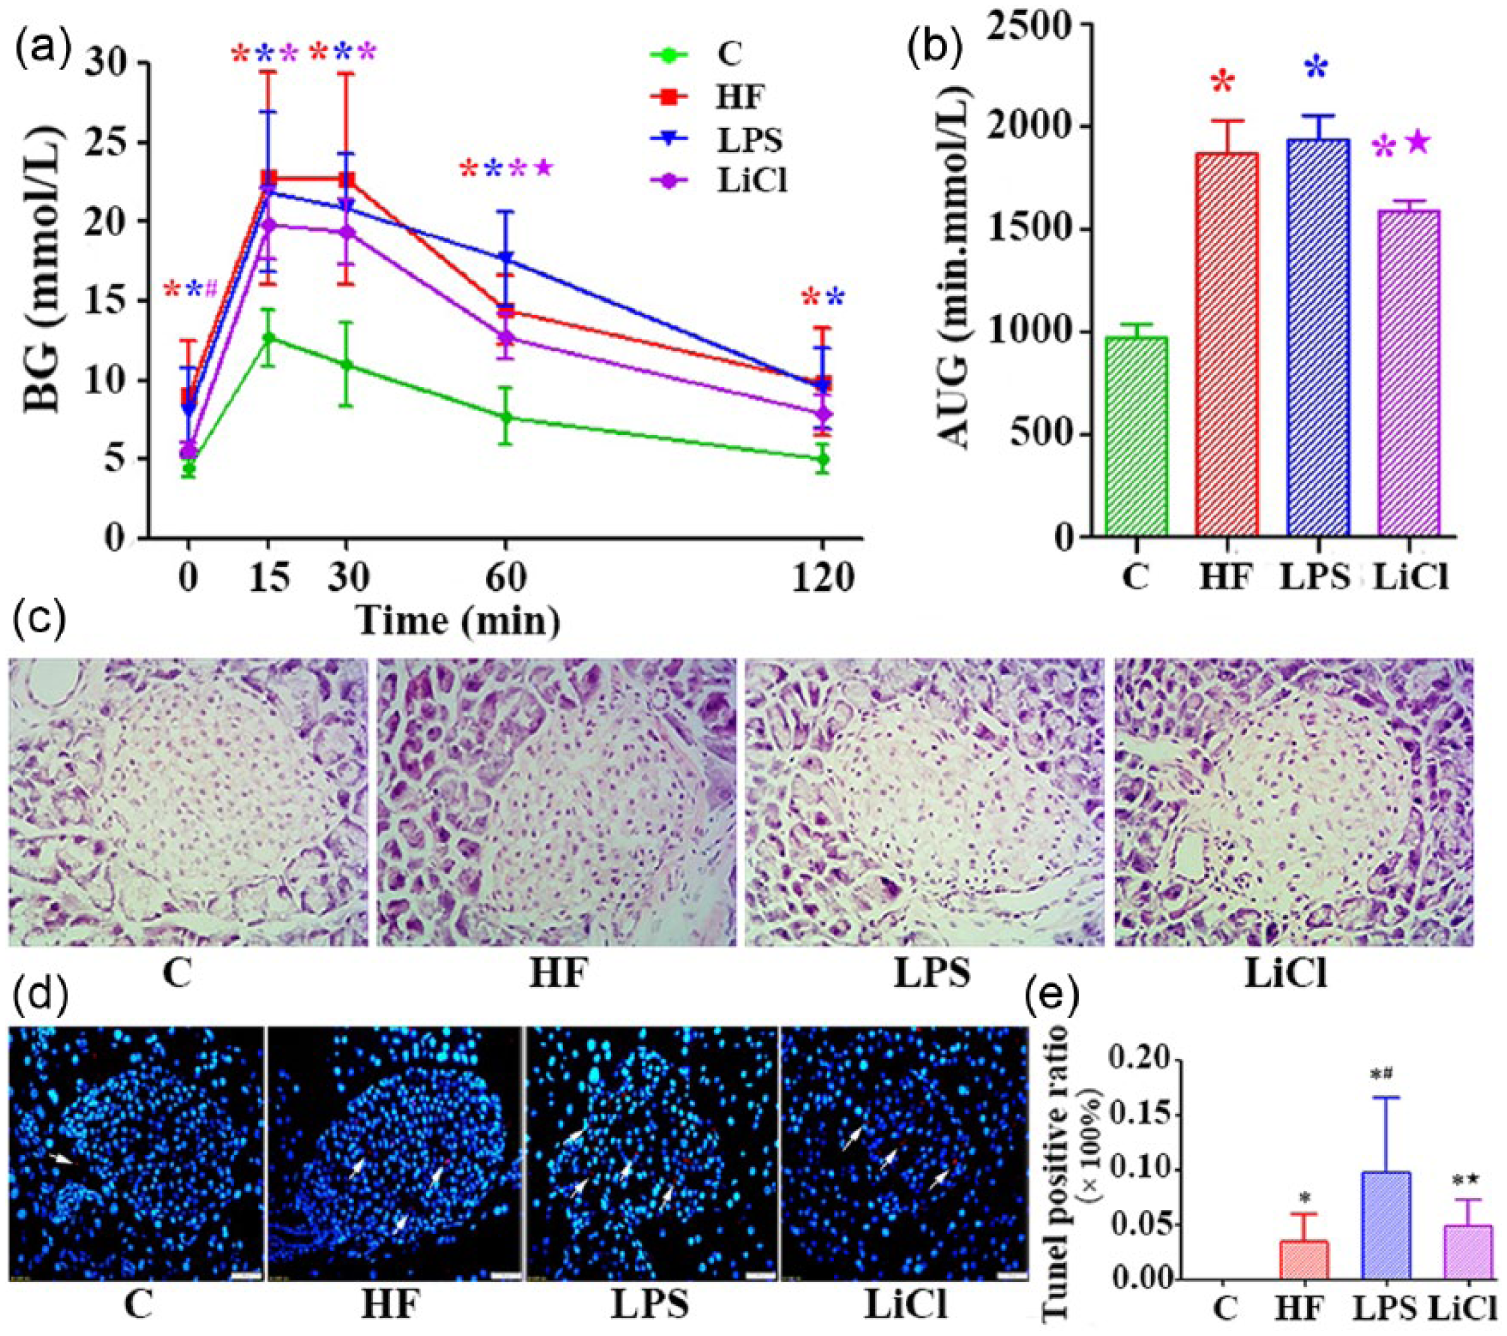
IPGTT and conditions of pancreatic islet at the end of 11 weeks with LPS and LiCl treatments for the last 4 weeks. (a) Blood glucose concentration during IPGTT. (b) AUC during IPGTT of (a). (c) Hematoxylin and eosin (HE) staining in mice pancreatic islet (400×). (d) TUNEL fluorescent staining (400×). (e) Quantitative analysis of apoptotic cells in pancreatic islets. Data are expressed as mean ± SD for each group. *P < 0.05 versus C group; #P < 0.05 versus HF group; P < 0.05 versus LPS group.
Islet morphology change
To understand the impact of chronic inflammation on islets, we observed change of islet morphology by hematoxylin and eosin (HE) staining. As shown in Figure 3(c), both islets and exocrine gland bubble were clearly visible in the C group, and the islets were in the shape of a cluster. Lipid droplets were seen in the islets of the HF group and the structure of acinar cells were loose. In LPS group, the acinar cells lost the normal tissue structure, the lobules were missing, the space was enlarged, some of the acini were isolated and inflammatory cells were infiltrated. In the LiCl group, inflammatory cell infiltration was observed, intercellular space was increased, and gland acinar structure was not clear.
Apoptosis in pancreatic islet cells
We assessed apoptosis of pancreatic islet cells by TUNEL staining and the results are shown in Figure 3(d) and (e). Compared with the C group, apoptotic islet cell was significantly increased in the HF group (P < 0.05). Compared with the HF group, the number of apoptotic islet cells was markedly elevated in the LPS group (P < 0.05). Compared with the LPS group, the number was significantly decreased in the LiCl group (P < 0.05).
Inflammatory cell infiltration in different organs
In order to determine whether high fat in combination with low dose of LPS subcutaneous injection could induce systemic inflammation, we observed the expression of F4/80 in the liver, fat, and islet by immunohistochemical staining. As shown in Figure 4, the tissue structures of liver, fat, and pancreatic islet were regular, cells were arranged orderly, and no F4/80 expression was observed in the C group. The expression of F4/80 was significantly higher in the HF and LPS groups than in the C group and was higher in the LPS group than in the HF group. The expression of F4/80 in LiCl group was lower than that in the LPS group as shown in Figure 4.
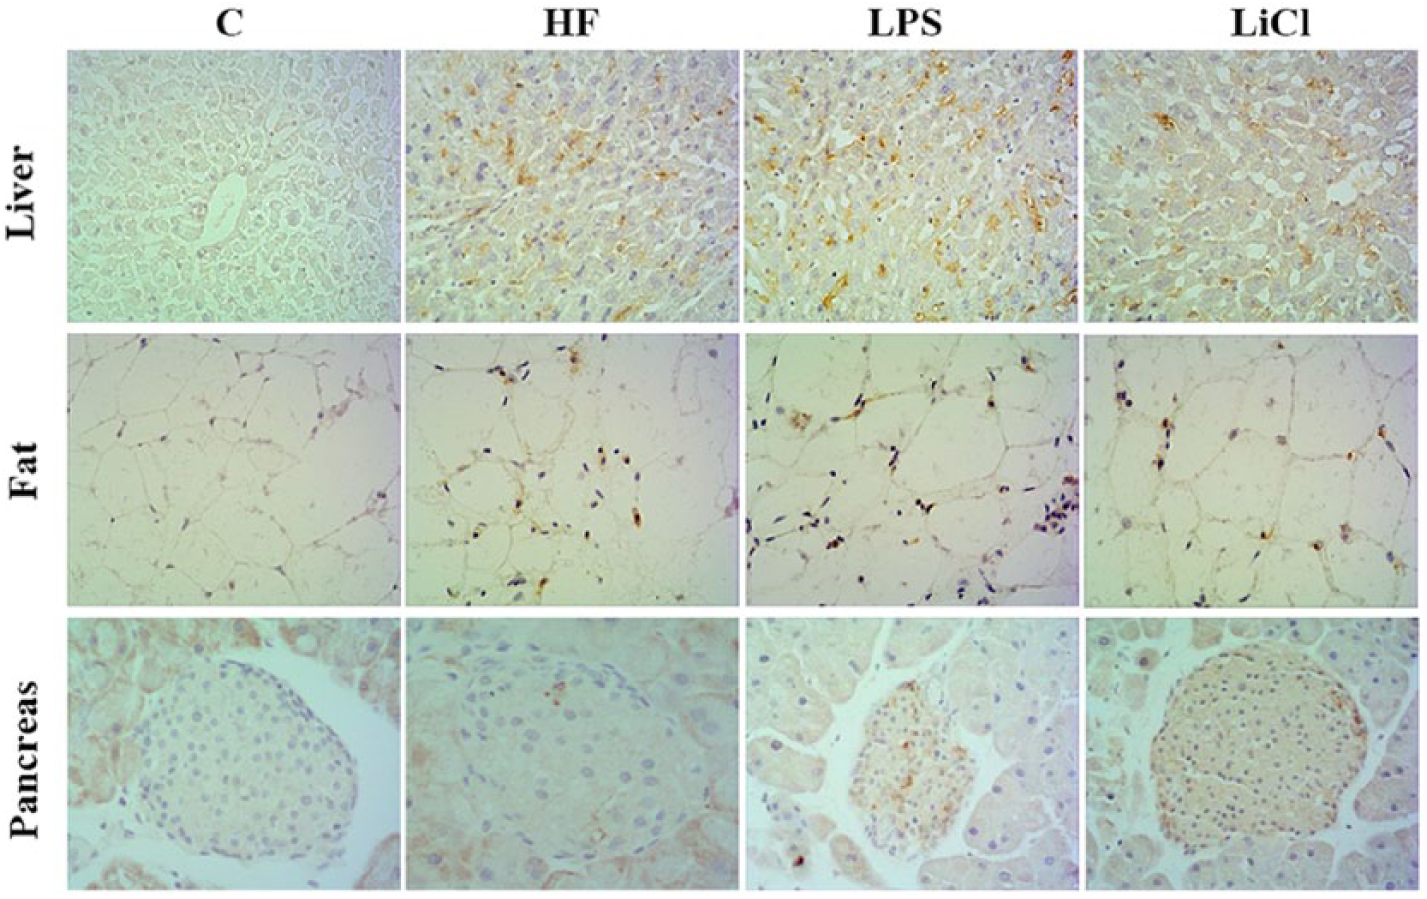
The immunohistochemical result of F4/80 in liver, fat, and pancreas via staining (400×).
Proliferation in pancreatic islet cells
We observed the expression of PCNA and PDX-1 using immunohistochemical staining to assess proliferation in pancreatic islet cells. There was no significant difference in expression of PCNA between HF group and C group. The expression of PCNA in LPS group was significantly higher than in the HF group (P < 0.05) and in the LiCl group it was significantly lower than in the LPS group (P < 0.05) (Figure 5(a) and (b)). The expressional trend of PDX-1 in pancreatic islet of each group was the same as PCNA as shown in Figure 5(c) and (d).

The expression of PCNA and PDX-1. (a) Detection of PCNA expression in pancreatic islets via immunohistochemical staining (400×). (b) Quantitative analysis of PCNA-positive cells of the immunohistochemical staining image. (c) Detection of PDX-1 expression in pancreatic islets via immunohistochemical staining (400×). (d) Quantitative analysis of PDX-1-positive cells of the immunohistochemical staining image. Data are expressed as mean ± SD for each group. *P < 0.05 versus C group; #P < 0.05 versus HF group; P < 0.05 versus LPS group.
Change of autophagy in pancreatic islet cells
We examined whether autophagy was present in mice pancreatic islet cells by double immunohistochemistry staining (insulin and LC3). LC3 was one of the autophagy markers. The expression of LC3 was increased when autophagy was induced and was shown by fluorescein isothiocyanate (FITC) (green fluorescence). Insulin, secreted by pancreatic islet β cells, was stained by tetramethylrhodamine (TRITC; red fluorescence). We could observe that the green fluorescence meaning for LC3 was much more in the HF group than in the C group, less in the LPS group, and LiCl group was more than LPS group (Figure 6(a)).

Immunofluorescence and western blot detection. (a) Detection of insulin and LC3 in pancreatic islets via immunofluorescence staining (400×). LC3 is shown by FITC, and insulin is shown by TRITC. (b) Western blot of LC3 in islets were detected. (c) Quantitative analyses of LC3 level. (d) Analysis of the expression of p62 in islets by western blot. (e) Quantitative analyses of p62 level. (f) Analysis of GSK-3β in islets by western blot. (g) Quantitative analyses of GSK-3β and p-GSK-3β. Data are expressed as mean ± SD for each group. *P < 0.05 versus C group; #P < 0.05 versus HF group; P < 0.05 versus LPS group.
In order to further quantify autophagy markers, we carried out isolation and purification of the islets to detect the expression of LC3 and p62 using western blot. p62 was another marker for autophagy, which could recognize ubiquitin protein aggregates by binding to LC3, and then scavenged by autophagy. Accumulation of p62 was a good indicator of suppressed autophagy. The results are shown in Figure 6(b)–(e): LC3II/I ratio in HF group was significantly higher than C group (P < 0.05), LPS and LiCl groups were lower than HF group (P < 0.05), and LiCl was lower than LPS group (P < 0.05). The p62 expression in HF and LPS groups was significant higher than C group (P < 0.05), LPS group was higher than HF group (P < 0.05), and LiCl group was lower than LPS group (P < 0.05).
Change of inflammatory signaling pathways protein GSK-3β
GSK-3β is one isoform of GSK-3, which is a serine/threonine kinase that regulates a variety of cellular functions including glycogen synthesis, proliferation, metabolism, and apoptosis. Besides, GSK-3β has also been implicated to play an essential role in regulating both pro- and anti-inflammatory responses. We observed change of GSK-3β and p-GSK-3β by western blot analysis. With regard to the ratio of p-GSK-3β/GSK-3β, there was no significant difference between HF group and C group. And the ratio was lower in LPS group than in the HF group (P < 0.05), higher in LiCl group than in the LPS group (P < 0.05).
Discussion
The influence on the metabolic index in different treatments
It has been recognized that high-fat diet was the “fuse” of obesity and insulin resistance. Although the feeding cycle was longer, it could better simulate insulin resistance, thus the method of high-fat diet to induce diabetes mice model was used by most researchers. 10 Some studies have shown that endogenous LPS level in the blood was elevated after high-fat diet. 11 In this study, IPGTT and ITT at the end of seventh week showed that blood glucose at 30 min in HF group was significantly increased, and body weight of high-fat diet mice was significantly higher than normal diet mice (Figure 2), which suggested that long-term high-fat diet could induce diabetes symptoms in mice. High-fat diet and long-term treatment meet the experimental needs of diabetic mice in this study.
After being treated with LPS for the last 4 weeks, blood glucose at all points were significantly higher than C group, however not significantly different compared with HF group. The blood glucose of LiCl group was significantly higher than C group and lower than LPS group (Figure 3(a) and (b)). These results indicate that LPS does not further aggravate the impaired glucose tolerance in high-fat diet and LiCl could decrease the influence of HF and LPS on blood glucose. There was report showing that glucose tolerance of mice induced by long-term high-fat diet was significantly abnormal. 12 Female rats induced by chronic inflammation for 8 weeks did not develop glucose intolerance. 13 Continuous subcutaneous infusion of LPS by micro pump for 4 weeks did not cause any change in glucose tolerance. 14 Six weeks of LPS combined with three weeks of high fat diet could affect the level of inflammation, but not abnormal glucose tolerance. 15 Our results of HF and LPS treatment were consistent with previous reports, and the LiCl could attenuate diabetes symptoms induced by HF and LPS.
The influence on the islet injury in different treatments
Results of HE staining (Figure 3(c)) showed that HF group and LPS group did not cause islet structure change. Some reports have shown that normal tissue morphology and cell integrity were preserved in both acute and chronic treatment with LPS, and no signs of cellular damage were visible by transmission electron microscopy (TEM). 16 The results of F4/80 expression (Figure 4) showed that long-term high-fat diet can lead to different degrees of infiltration of inflammatory cells in each tissue. Giving exogenous LPS intervention, inflammatory cell infiltration was further aggravated. LiCl intervention can partly reverse the above situation. Geurts et al. 15 reported that the level of LPS and the mRNA level of F4/80 were significantly increased in HF group and the mRNA level of F4/80 in LPS group was higher than that in the HF group and normal group, which were consistent with our study. Increasing free fatty acids and ceramide levels lead to the activation of NLRP3 inflammatory complex, inducing the release of inflammatory factors and systemic inflammatory response. 17 LPS stimulation could make the insulin secreting cells apoptotic and impair the function of glucose-stimulated insulin secretion, resulting in islet cell damage. 18 The TUNEL results (Figure 3(d) and (e)) showed that the level of apoptosis in HF group was higher than that in the C group, suggesting that the long-term high-fat diet can induce the apoptosis of islet cells. Previous studies have found that high fat through activating different signaling pathways, such as inositol kinase 1 or transcription factor 6 and so on, damaged the endoplasmic reticulum and mediated apoptosis of pancreatic islet cells.19,20 Some scholars believe that high-fat diet can lead to the accumulation of free fatty acids in islet β cells, increase the level of ceramide, and lead to β-cell apoptosis through the nitric oxide synthase (iNOS) pathway. 21 In this experiment, we observed that the levels of apoptosis in the LPS group were significantly higher than the HF group, suggesting that chronic systemic inflammation could worsen apoptosis of islet cells induced by high fat. It was reported that LPS could induce apoptosis of cardiomyocytes, and the higher the concentration, the more obvious the apoptosis, 22 which was consistent with our results. As a component of bacteria, LPS could activate a variety of signal transduction pathways, produce reactive oxygen species, cytokines, lysosomal enzymes and so on, causing the body’s inflammatory response, leading to cell apoptosis.
The results of PCNA immunohistochemistry staining (Figure 5(a) and (b)) indicated that islet cells still have compensatory capacity in a certain range of concentration of LPS. Some researchers reported that the dissolution of the synergistic action could cause the proliferation of cells alone, leading to the occurrence of tumor, or apoptosis alone, leading to organ damage and degeneration. 23 Different time and concentrations of LPS activated different proliferation and apoptosis pathways, resulting in different biological effects, which also suggested that proliferation and apoptosis of islet cells are greatly related to LPS function time and intensity, and early intervention could prevent further damage of islet cells.
Changes of autophagy in different treatments and possible mechanisms
As a body’s defense mechanism, autophagy could resist against various forms of injury, such as lack of nutrition, microbial infection, and so on. Autophagy activation could induce an increase in the formation of autophagosome. Autophagosome is one of the contents for degradation, although usually interpreted as enhanced autophagy, it also reflects disruption of lysosomal function. So, it was not accurate to only use autophagosome to evaluate the autophagy flow, it must be combined with other methods. P62 could be used to assess fluctuations in autophagy in certain conditions, which might mediate the recognition of ubiquitin protein, and then be eliminated by autophagy. Usually, the accumulation of p62 was a good indicator of impaired autophagy. In this study, we observed the expression of LC3 and p62 (Figure 6(a)–(d)), and further evaluated the status of autophagy and its role in the inflammation-induced islet injury. The results showed that the islet cells appear in small amount in LC3, and the expression of p62 was less in the C group, which indicates autophagy was at the basic level. The LC3 were intensive, and the expression of p62 was less in the HF group, suggesting that high fat could induce autophagy of islet β cell. Ebato et al. 24 reported that overnight starvation of c57BL/6 mice could not lead to an increase in autophagosome in islet β cells. In contrast, the mice after feeding with HF diet for 12 weeks showed that formation of large autophagosome and the number of β cells was compensatory increasing, which was in agreement with our study, and not only excluded the effect of overnight fasting on the autophagy of islet β cells, but also confirmed the proliferation effect of islet β cells in HF condition. However, parts of the studies had reported that high-fat fed rats or obese/diabetic gene models show a decline in multiple autophagy markers. 25 The difference was partly due to technical issues associated with performing in vivo autophagic assays, and was also attributed to factors such as the ages of experimental animal models, fat content, and so on. Autophagy flux was repressed in liver after high-fat feeding. 26 Maybe impaired autophagy could weaken the removal of the ubiquitin protein, pathogenic microorganisms, and other harmful substances in the liver cells, causing infiltration of inflammatory cells in the liver. The activation of autophagy in β cells in HF condition might partly counteract the cytotoxic response induced by endogenous LPS, which was one of the reasons for the mild inflammatory cell infiltration in islet tissue, and the feedback mechanism was necessary, which could eliminate the inflammatory response in case of minor injuries. At present, the interaction between inflammation of islet and autophagy was still not clear. Our results showed that compared with HF group, LC3 in islet cells was decreased, and the expression of p62 was increasing in LPS group, which indicated that long-term chronic inflammation could damage autophagy feedback mechanism. Impaired autophagy could limit the clearance of autophagy substrate proteins and damaged organelles, causing endoplasmic reticulum stress and p62 accumulation, leading to glucose intolerance. In the study of islets of old rats, Liu et al. 27 found that the level of LC3II was decreased, the level of p62 was increased, and the function of β cell was impaired, which was consistent with the effect of chronic inflammation in our study. Baker et al. 28 reported that super-low-dose LPS could disrupt lysosome fusion, and cause low-grade inflammation. In addition, some authors showed that p62 could interact with NLR family and inhibit the self-dimerization, but self-dimerization was a vital step for its degradation. 29 Based on the above points, p62 could accumulate after chronic low-grade inflammation. Impaired autophagy caused the infiltration of inflammatory cells in the islets. When there was a danger signal of apoptosis, autophagy could clear the signal in time to avoid the occurrence of apoptosis, while autophagy was impaired, the ability to clear the dangerous signal was weakened, which lead to the apoptosis of cells. 30 Apoptosis was not the only mechanism of islet cells dysfunction, which might be involved in the impaired autophagy. Impaired autophagy may play an important role in chronic low-grade inflammatory diseases, such as obesity and diabetes.
As an important regulator of nuclear factor κB (NF-κB), GSK-3β plays an important role in regulating the body’s anti-inflammatory and pro-inflammatory balance. GSK-3β could regulate autophagy through GSK-3β/TIP60/ULK1 pathway. 8 In this study, we selected LiCl as a GSK-3β inhibitor and observed the effect of GSK-3β on the function of pancreatic islet β cells and pathological injury in chronic inflammatory state. The results showed that chronic inflammation leads to the increase of GSK-3β activity in pancreatic islet tissue. LiCl could decrease the activity of GSK-3β, although promoting phosphorylation of ser9 on GSK-3β, reducing the infiltration of inflammatory cells in various tissues of mice. In addition, the number of autophagosome in LiCl group was more than in the LPS group, and the expression of p62 was decreased, indicating that LiCl could induce the increase of autophagy flow and reduce the cell damage caused by metabolic poison, and further improve the function of β cells. Multiple pathways could regulate the activity of GSK-3β, such as PI3K/AKT, AMPK, mTOR, and have different effects on autophagy. Interaction between AMPK and GSK3 could inhibit the activity of AMPK, and then block its effect on mTORC1. 31 In the study of MCF-7 lung cancer cells, GSK-3β was the positive regulatory factor of mTORC1. The overexpression of GSK3 could activate mTORC1, which impaired the process of lysosomal acidification and autophagy flow. In addition, mTORC1 involved cell proliferation, GSK-3β inhibitor could inhibit cell proliferation, probably due to its inhibition of the mTORC1, 32 suggesting that GSK-3β inhibitor might activate autophagy by inhibiting mTORC1, thus protecting the function of islet β cells. In addition, the inhibitory effect of LiCl on inflammatory signal pathway GSK-3β could alleviate inflammatory response, and then reduce the inhibitory effect of inflammation on autophagy. In conclusion, the protective effect of GSK-3β inhibitor on islet β cells might be achieved through activation of autophagy. In this study, we researched the connection between chronic inflammation-induced damage in islet cells and autophagy and observed that islet cells displayed LC3 fluorescent puncta, suggesting that alpha cells also have autophagy phenomenon. Wu et al. 33 confirmed that induction of autophagy occurred in renal cortex during LPS-induced AKI, and the renal medulla did not display LC3. Francois et al. 16 reported that the expression level of autophagy makers between cortex and hippocampus were different after LPS treatment. Some scholars believed that the different tissues and cells had different activity in the inflammatory process, which could partly explain the different expression of autophagy markers. 34 Therefore, LPS treatment could induce inflammation and autophagy in islet cells, and the effects could be via the GSK-3β-related way.
In summary, low-grade inflammation may cause autophagy flux impaired through activation of GSK-3β, thus causing islet cells damage. LiCl might play a role of protecting islet β cells through enhancing of autophagy. Therefore, regulation of autophagy through the drug may become a new means of prevention and treatment of metabolic disease (including obesity, diabetes, etc.) in the endocrine field.
Footnotes
Declaration of conflicting interests
The author(s) declared no potential conflicts of interest with respect to the research, authorship, and/or publication of this article.
Funding
This work was supported by grants from the National Nature Science Foundation of China (U1404805 and 81141059).