
Abstract
Objectives
Patients with an elevated ankle brachial index (ABI) > 1.3 have a high burden of disease and poorer outcome compared to patients with a lower ABI. Previously differences between patients with ABI > 1.3 have not been studied in detail. The aim of this study was to analyze the morbidity and mortality of patients with ABI > 1.3.
Methods
ABI measurements were performed in the vascular laboratory of Turku university hospital 2011–2013. Patients with ABI>1.3 in at least one lower limb were included in the study and divided into 3 groups: At least one lower limb ABI 1.3–2.5 but both limbs <2.5 (group 1), one limb ABI ≥2.5 (group 2), both limbs ABI ≥ 2.5 (group 3).
Results
534 patients were included in the study. The patients in groups 2 and 3 were more often female (p < .001), older (p < .001), had more diabetes (p = .013), coronary artery disease (p = .001) and chronic heart (p = .010) and kidney failure (p = .013) compared to patients in group 1. The survival of patients in group 2 and 3 was significantly poorer compared to the patients in group 1 (HR1.6, 95% CI 1.2–2.2, p = .002 and 1.7, 95% CI 1.2–2.3, p < .001, respectively). Overall and cardiovascular mortality was higher in groups 2 and 3 than group 1.39.5% of patients with incompressible ankle arteries (ABI ≥ 2.5) in both lower limbs had toe pressure (TP) <50 mmHg and a poorer survival compared to patients with a higher TP.
Conclusions
Patients with incompressible ankle arteries have significantly higher overall and cardiovascular mortality and a greater burden of disease compared to the patients with a measurable yet abnormally high ABI. TP is a useful diagnostic tool when ABI is immeasurably high. All patients with ABI > 1.3 should be considered as high cardiovascular risk patients.
Keywords
Introduction
Ankle brachial index (ABI) is the golden standard noninvasive method for diagnosing lower extremity artery disease (LEAD). 1 It is widely used for follow-up and screening of LEAD.2,3 The advantage of ABI is the simplicity and affordability of the method. 4 Therefore its use is feasible worldwide in medical facilities. 5
There is general consensus, that ABI values of 0.9–1.3 are considered normal, although a single measurement does not rule out substantial LEAD. 6 Patients with ABI lower than 0.9 have an increased risk of cardiovascular morbidity and mortality. 7 The prognosis of patients with ABI over 1.3 is even poorer, 8 and the burden of comorbidities is high. 9
The main cause for abnormally high ABI values is calcification of ankle arteries. 10 The calcification process leads to stiffening of the arteries. 11 Due to the decreased compliance ankle pressure and therefore ABI values are falsely elevated. 6 The calcification process eventually leads to ankle arteries being incompressible. In these patients the ankle pressure and ABI cannot be measured.
Although ABI > 1.3 has previously been associated with a poor prognosis, research is lacking of the differences between patients within this category. This study aimed to analyze differences in comorbidities, survival and causes of death within subgroups of patients with ABI > 1.3. In addition, toe pressures (TP) of patients with incompressible ankle arteries were analyzed to investigate the impact of lowered TP on the survival of the patients.
Material and methods
The data consists of all consecutive ABI measurements, fulfilling the inclusion criteria of the study, that were performed in the vascular laboratory of the department of clinical physiology in Turku university hospital during 2011–2013. The measurements were done because of known or suspected peripheral arterial disease. The first measurement during the study period of 2011–2013 from each patient was recorded. Follow-up ended 1st of January 2020. The present study is a retrospective registry-based cohort study and has the approval of the University of Turku and was reviewed and accepted by the ethical review board (IRB number T344/2017). Due to the nature of the study, no informed consent from the patients was required.
ABI measurements
Ankle brachial index and TP values were registered by trained and experienced vascular nurses according to current guidelines. 12 Shortly, the measurements were done with the patient in a supine position, feet at heart level, and in a standardized environment. In the protocol, the systolic arterial pressure from the anterior tibial and posterior tibial artery are measured on the level of the ankle, for TP from the great toe and the systolic pressure from the brachial artery with the laser doppler method using a Periflux 6000 (Perimed AB, Järfälla, Sweden) device. In some lower limbs blood flow in the anterior tibial and posterior tibial artery could not be blocked despite cuff inflation of over 250 mmHg. In these lower limbs the ABI could not be measured due to the incompressibility of the ankle arteries, and the patients are characterized as ABI ≥ 2.5 in the material. ABI and TP were measured from both lower limbs if possible.
Patients that had ABI over 1.3 in at least one lower limb were included in the study and divided into 3 groups: One or both limbs ABI between 1.3 and 2.5 but both limbs <2.5 (group 1), one limb ABI ≥2.5 (group 2), both limbs ABI ≥ 2.5 (group 3). The TP of patients with ABI ≥ 2.5 in both limbs were analyzed separately. The lower TP was included in the analysis and the patients were divided into three groups: TP < 30 mmHg, TP 30–49 mmHg and TP ≥50 mmHg.
Data collection
Baseline characteristics and medical history of the patients were collected retrospectively from the electronic medical records. Comorbidities were listed according to the International Disease Classification (ICD-10) diagnoses that were stated in each patient’s records. The causes and dates of death were provided by the Causes of Death Registry of Statistics Finland. The causes of death were classified according to 54 classes cause of death classification. The Causes of Death Registry registers all deaths of people with permanent residency in Finland, and the cause of death cannot be registered for approximately 0.2% of all deaths annually. 13
Statistical analysis
Statistical analyses were done using SPSS version 27 (IBM, Armonk, NY, USA). Chi-squared test was applied to compare categorical baseline characteristics and Kruskall–Wallis test to compare continuous variables. Unadjusted survival was calculated using Kaplan–Meier survival analysis. Cox regression analysis was used to calculate hazard ratios (HR) for comparison of patients in the three ABI groups. The analysis was adjusted for those baseline characteristics that were significantly different between the three ABI groups. The causes of death were expressed as percentages with confidence intervals. Significance of results was determined as p ≤ 0.05.
Results
ABI was measured from 2751 patients during 2011–2013 in the vascular laboratory of Turku University Hospital. The first measurements within the timeframe were included in the study. 534 (19.4%) patients had ABI over 1.3 in at least one lower limb. 99.4% (531) of these patients had measurements from both lower limbs. The material included 155 patients with ABI between 1.3 and 2.5 in one or both lower limbs but both < 2.5 (group 1), 169 patients with ABI ≥ 2.5 in one lower limb (group 2) and 210 patients with ABI ≥ 2.5 in both lower limbs (group 3).
Baseline characteristics
Baseline characteristics of patients in each ABI group.
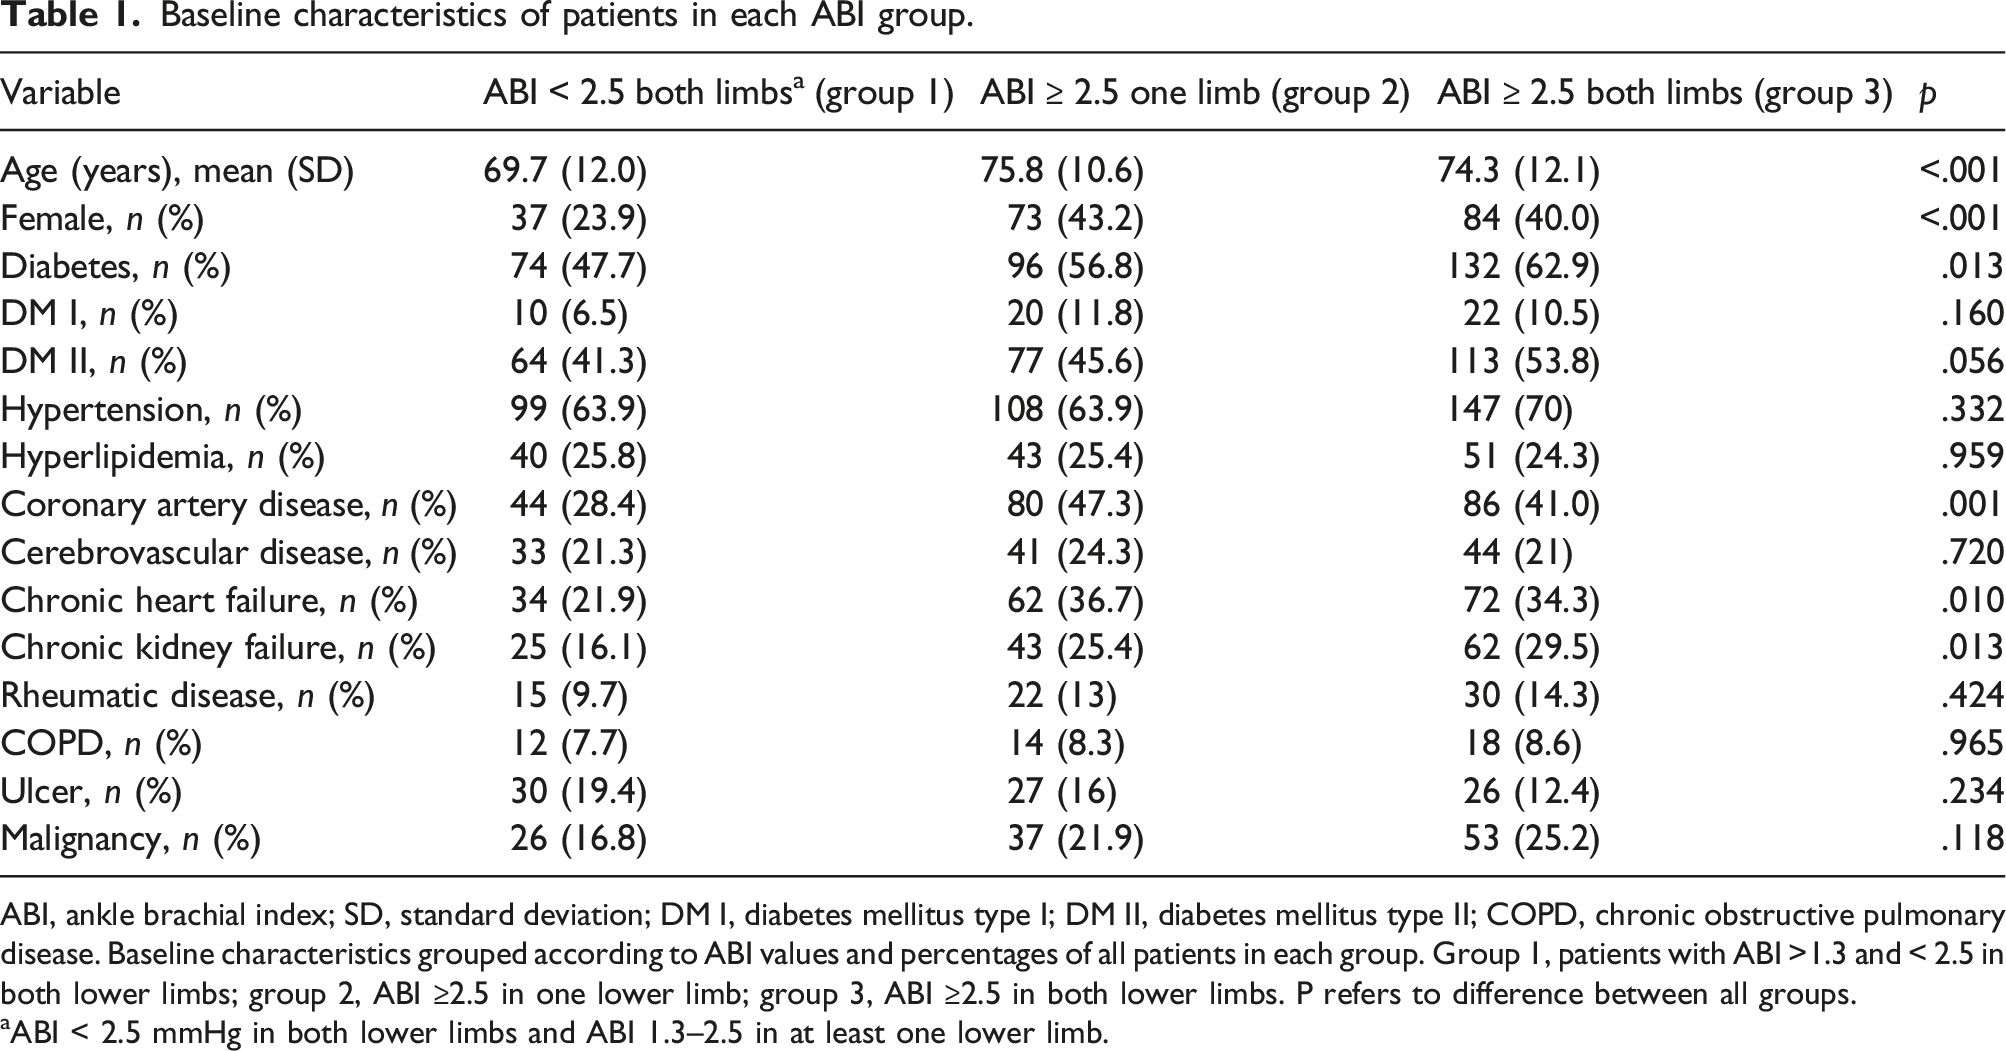
ABI, ankle brachial index; SD, standard deviation; DM I, diabetes mellitus type I; DM II, diabetes mellitus type II; COPD, chronic obstructive pulmonary disease. Baseline characteristics grouped according to ABI values and percentages of all patients in each group. Group 1, patients with ABI >1.3 and < 2.5 in both lower limbs; group 2, ABI ≥2.5 in one lower limb; group 3, ABI ≥2.5 in both lower limbs. P refers to difference between all groups.
aABI < 2.5 mmHg in both lower limbs and ABI 1.3–2.5 in at least one lower limb.
Survival
Survival of patients according to ABI group.
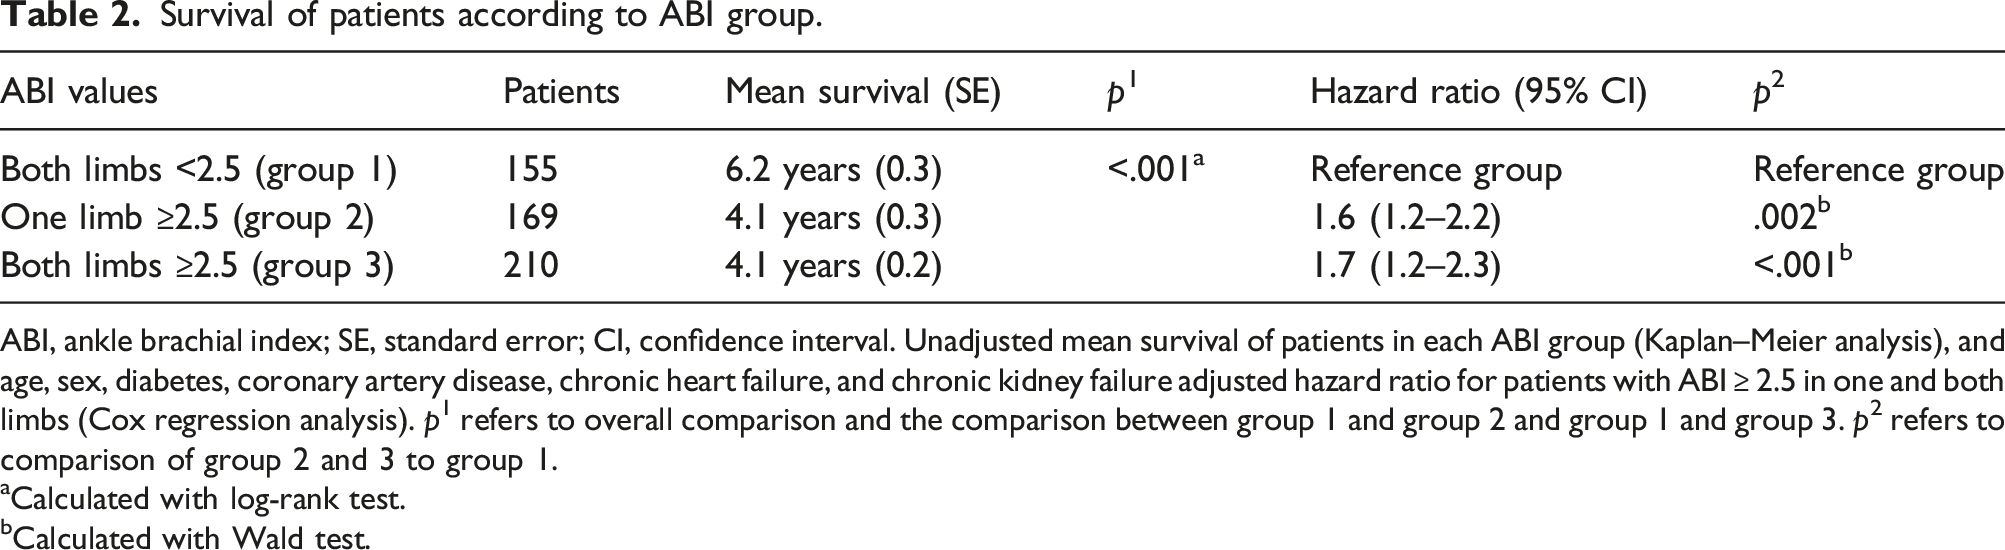
ABI, ankle brachial index; SE, standard error; CI, confidence interval. Unadjusted mean survival of patients in each ABI group (Kaplan–Meier analysis), and age, sex, diabetes, coronary artery disease, chronic heart failure, and chronic kidney failure adjusted hazard ratio for patients with ABI ≥ 2.5 in one and both limbs (Cox regression analysis). p1 refers to overall comparison and the comparison between group 1 and group 2 and group 1 and group 3. p2 refers to comparison of group 2 and 3 to group 1.
aCalculated with log-rank test.
bCalculated with Wald test.
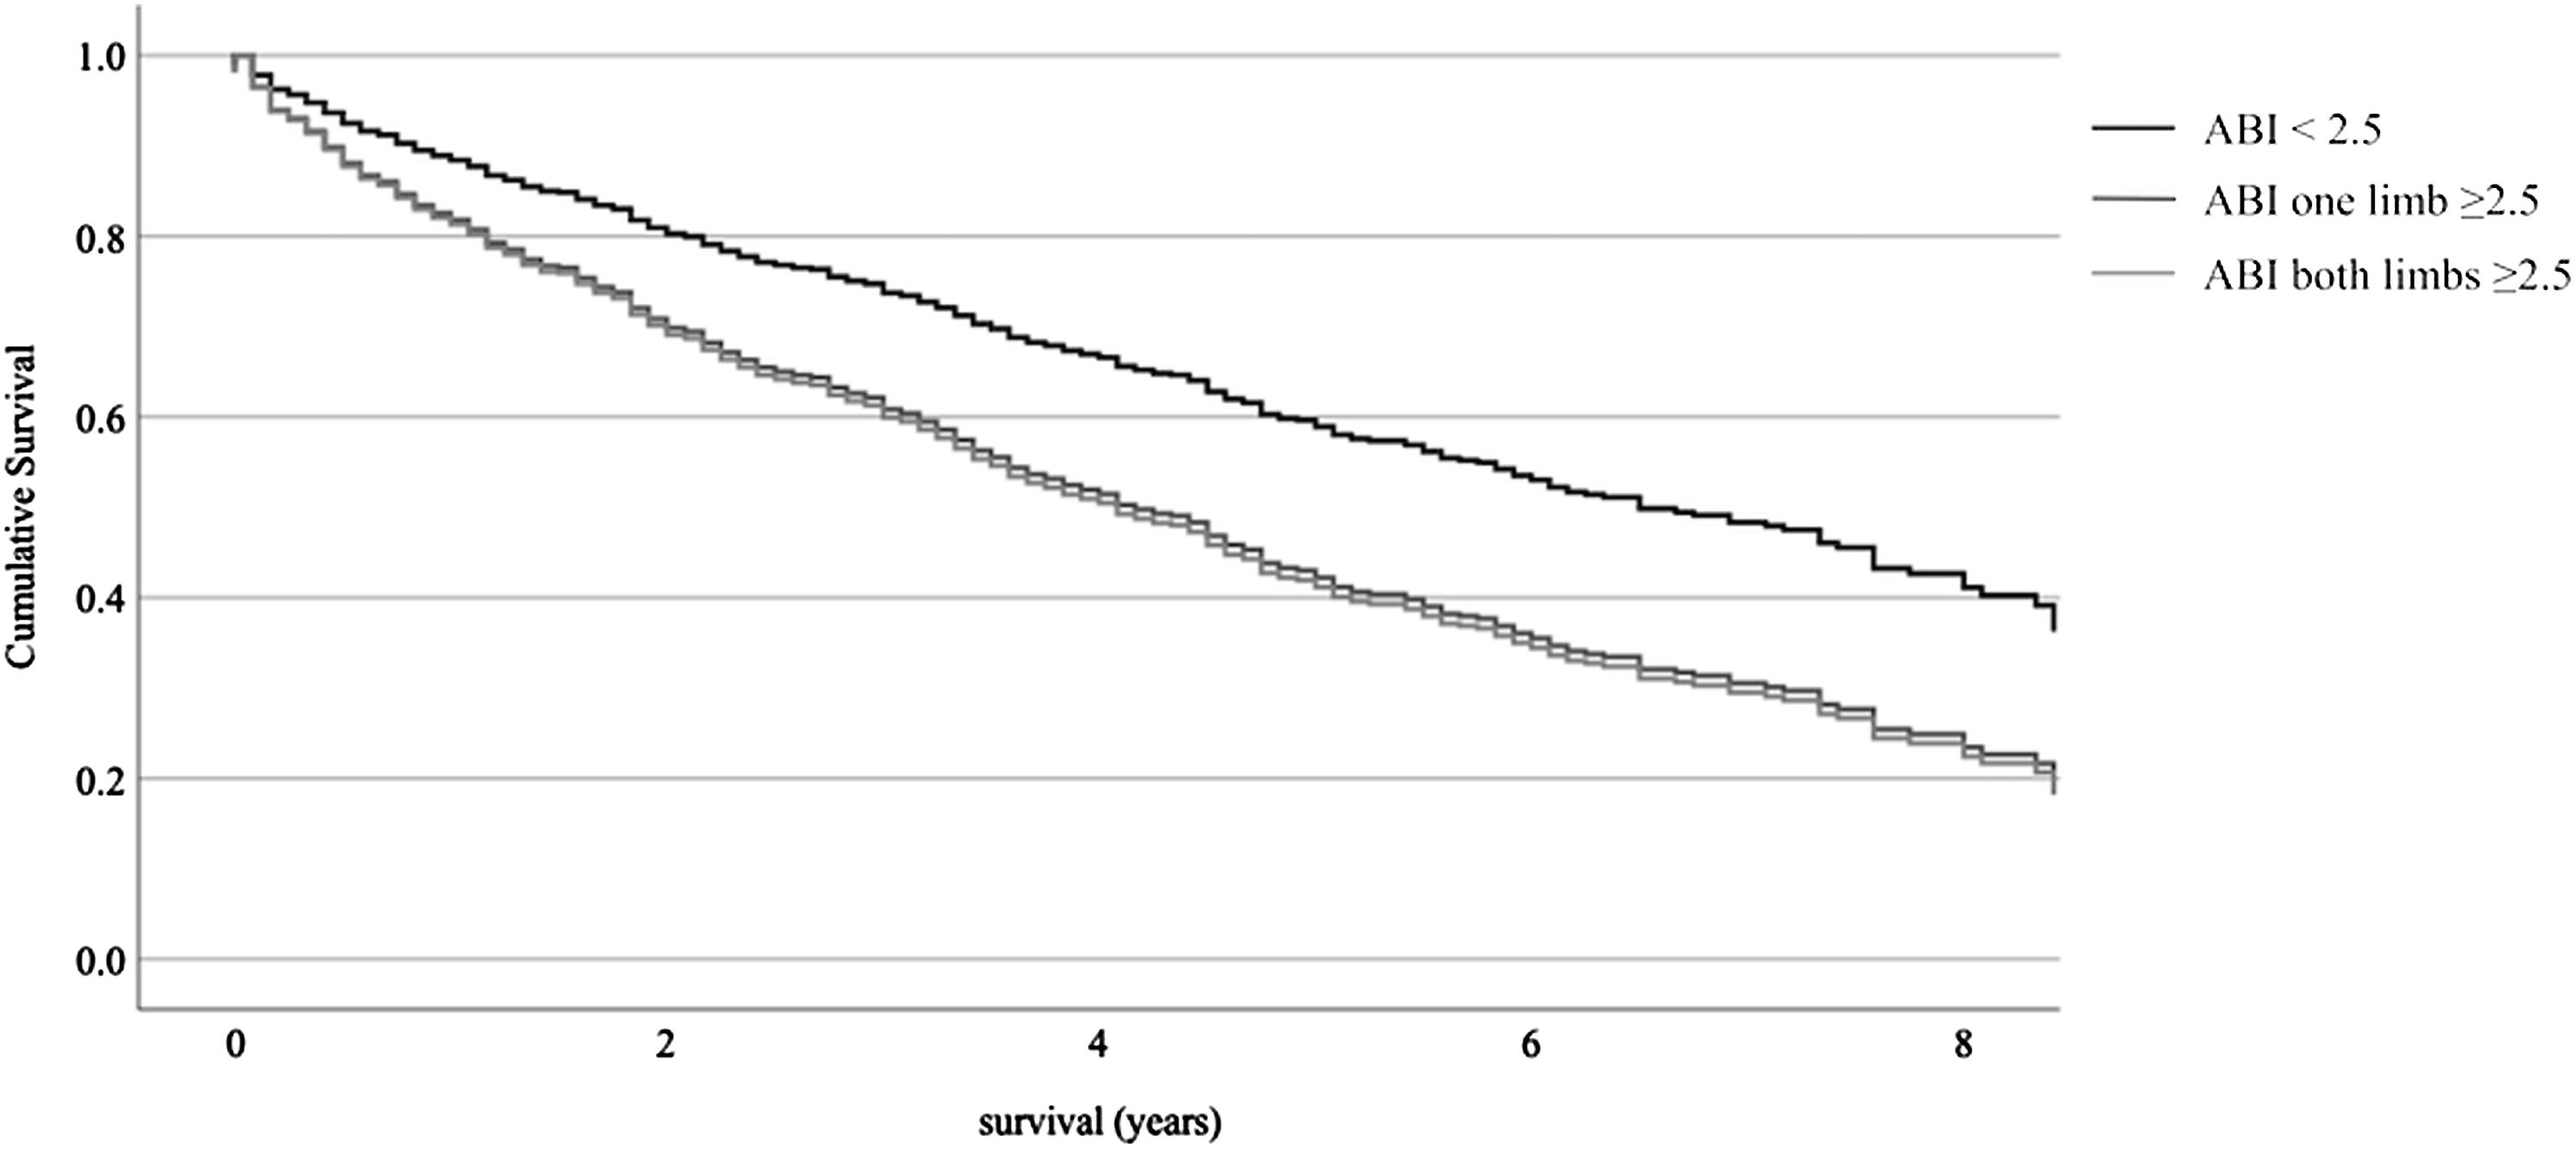
Adjusted survival in the three ABI groups. Age, sex, diabetes, coronary artery disease, chronic heart and kidney failure adjusted Cox regression analysis of patients in the three ABI groups. ABI, ankle brachial index.
The survival of patients with ABI 1.3–1.39 and ABI 1.4–2.49 did not differ significantly in Kaplan–Meier analysis (mean survival 6.4 (SE 0.3) and 5.8 (SE 0.4) years, respectively, p = .208).
Causes of death
At the end of follow-up 66.7% (n = 356) of the patients had died. The mortality rates in groups 1, 2, and 3 were 46.5%, 75.1%, and 74.8%, respectively. Overall mortality was significantly lower in group 1 compared to groups 2 and 3 (p < .001). There was no significant difference between groups 2 and 3.
Causes of death.
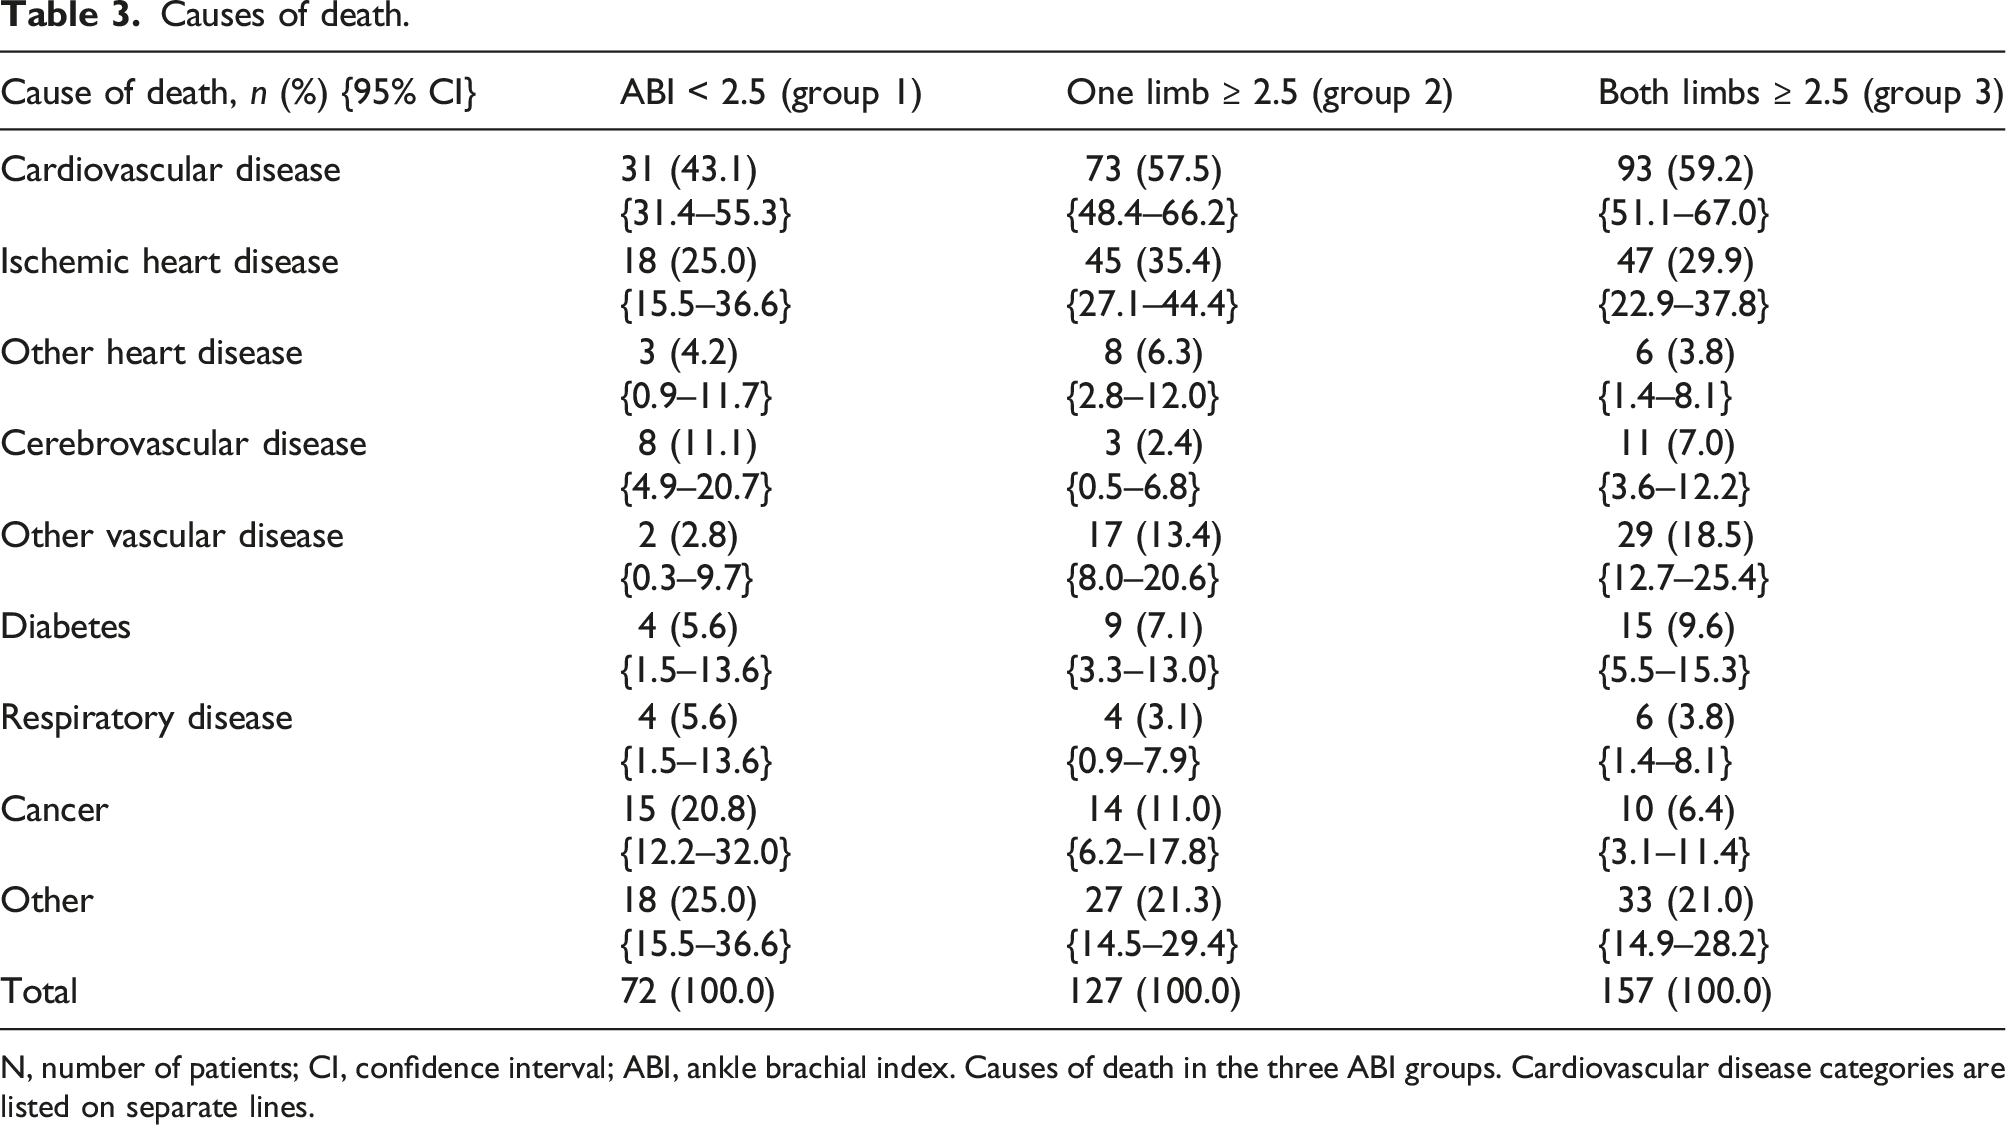
N, number of patients; CI, confidence interval; ABI, ankle brachial index. Causes of death in the three ABI groups. Cardiovascular disease categories are listed on separate lines.
TP of patients with incompressible ankle arteries (ABI ≥ 2.5) in both lower limbs
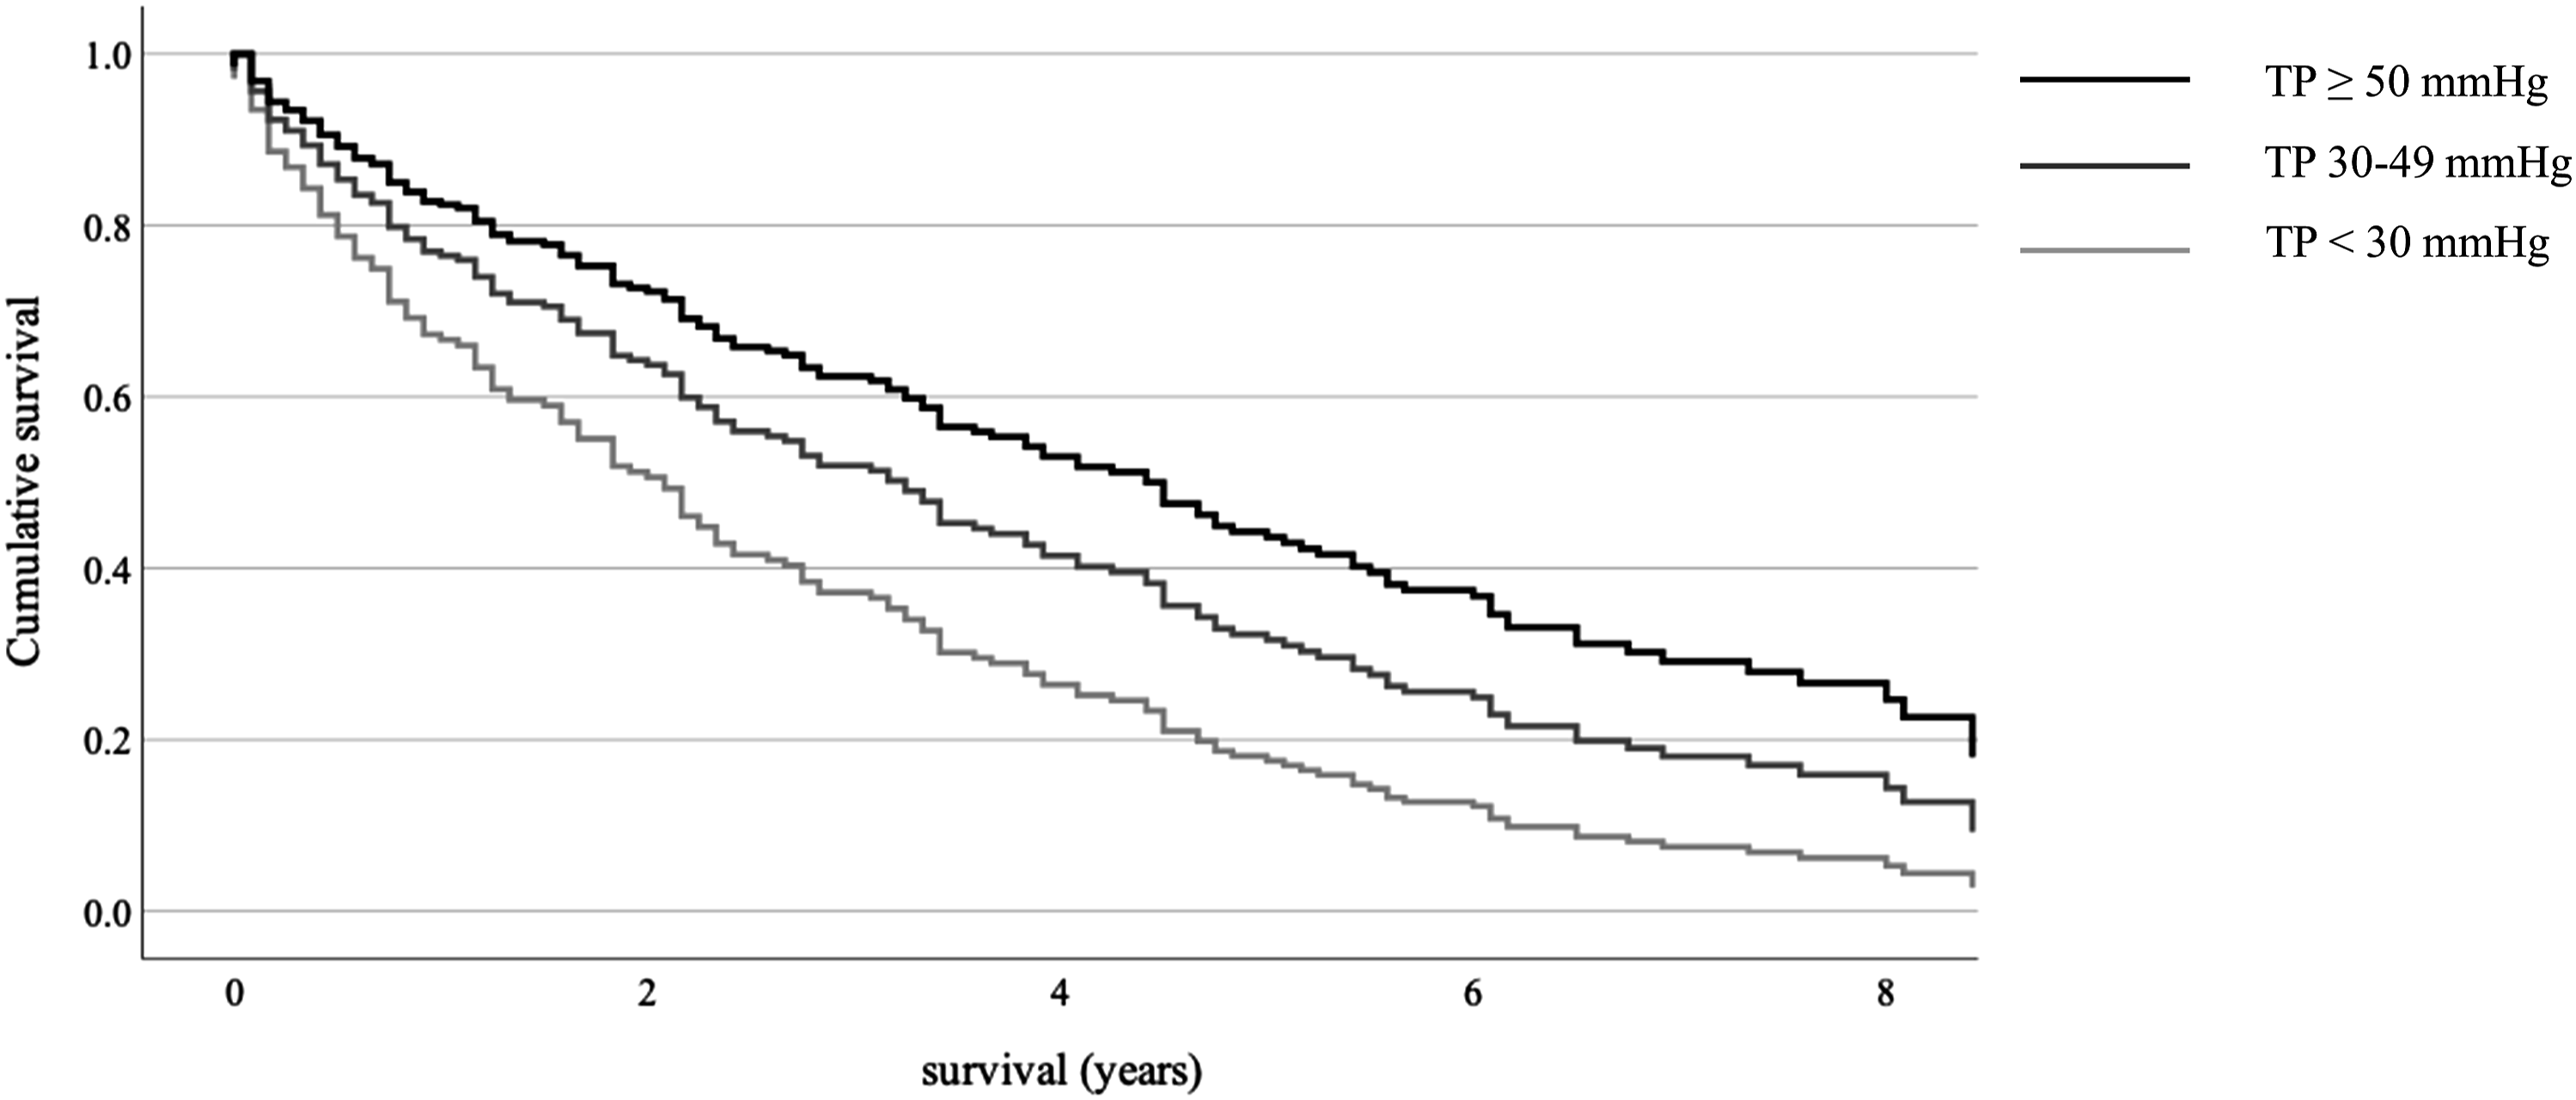
Survival of patients with ABI ≥ 2.5 mmHg in both lower limbs according to TP.

ABI, ankle brachial index; TP, toe pressure; SE, standard error; CI, confidence interval. Unadjusted mean survival of patients with ABI ≥ 2.5 mmHg in both lower limbs according to TP (Kaplan–Meier analysis), and age, sex, diabetes, coronary artery disease, chronic heart failure adjusted hazard ratio for patients according to TP (Cox regression analysis). p1 refers to overall comparison and the comparison between the patients with TP < 30 mmHg and ≥ 50 mmHg. p2 refers to comparison of patients with TP < 30 mmHg and 30–49 mmHg to the patients with TP ≥ 50 mmHg.
aCalculated with log-rank test.
bCalculated with Wald test.
Adjusted survival of patients with incompressible ankle arteries (ABI ≥ 2.5) according to TP values. Age, sex, diabetes, coronary artery disease, and chronic heart and kidney failure adjusted Cox regression analysis of patients with ABI ≥ 2.5 according to TP. TP, toe pressure.
Discussion
According to our present study, patients with ABI > 1.3 form a heterogenous population. There is variance in the profile of comorbidities that has not been studied in detail before. Coronary artery disease, diabetes, chronic heart disease, and kidney failure are more common in patients with incompressible ankle arteries compared to patients, that have an elevated but still measurable ABI. The patients with incompressible ankle arteries are also older and more often female compared to the patients with ABI > 1.3 but still measurable. The prognosis of the patients that have incompressible ankle arteries is significantly poorer and they have a higher risk of cardiovascular mortality compared to the patients with measurable ABI over 1.3.
ABI is the primary noninvasive diagnostic test for assessing peripheral arterial blood flow and diagnosing LEAD. 14 Normal ABI values range in studies from 0.9 to 1.3–1.4.12,15 An ABI of less than 0.9 is diagnostic of LEAD, 16 however, it also implies an increased risk of cardiovascular disease morbidity and mortality.7,17 ABI values of greater than 1.3–1.4 have received less attention in literature. High ABI values have, however, been associated with increased cardiovascular mortality and poor survival in patients with LEAD.8,18,19 There is evidence, that the prognosis of patients with ABI > 1.3–1.4 is even poorer than that of patients with ABI<0.9.8,20 In patients that do not have diagnosed cardiovascular disease the association of high ABI to increased morbidity and mortality is unclear. 21 Our study did not find a significant difference in the survival of patients with ABI 1.3–1.39 and ABI 1.4–2.49.
Diabetes and chronic kidney failure are more frequent in patients with abnormally high ABI values compared to those with a lower ABI. 22 Aging causes vascular calcification and as a result patients with ABI > 1.3 tend to be older than patients with a lower ABI. 23 These findings partly explain the poor unadjusted survival of patients with an elevated ABI. Our study supplements previous research by demonstrating that within the group of patients with ABI > 1.3 the aforementioned risk factors are more prevalent in patients with incompressible arteries compared to those with elevated ABI yet compressible arteries. High ABI values are associated with male sex. 2 In our study, there were more male patients in each of the ABI groups; however, the proportion of female patients was significantly higher in the group of patients with incompressible ankle arteries in at least one lower limb.
An elevated ABI is caused by decreased compliance of the ankle arteries. 24 Stiffening of the arteries is typically caused by vascular calcification that can either be concentrated in the medial or intimal layer of the artery. 23 Medial artery calcification (MAC) is caused by progressive calcification in the media of the artery. 25 The calcification process disrupts the structure of the elastic fibers of the arterial wall and consequently results in the loss of elasticity of the vessel. 26 When the calcification is mainly in the media layer, the lumen of the artery may not be stenosed or occluded. 26 However, due to the impaired mechanic function of the arterial wall blood flow to the target organ may still be impaired. 27 The reduced compliance of the arteries causes the afterload of the heart to increase and can ultimately lead to heart failure. 27 Consequently, in our study, chronic heart failure was more common in patients with incompressible ankle arteries compared to the patients with elevated ABI but still compressible arteries.
The intimal calcification process caused by advanced atherosclerosis is partly different in nature. 28 The calcified plaque protrudes into the lumen of the artery causing a stenosis that can lead to occlusion. 29 The hindered blood flow through the artery may be detected by a lowered ABI. 30 MAC and intimal calcification may also coexist and overlap and vessels with predominantly intimal calcification may become incompressible. 31 However, the risk factors are somewhat different. Known risk factors for MAC are diabetes, chronic kidney failure and old age, whereas smoking and dyslipidemia, classical risk factors for atherosclerosis, have not been strongly associated with medial calcification. 28
The results of the study at hand indicate that overall survival is poorer and cardiovascular mortality is higher when a patient has incompressible ankle arteries in at least one lower limb compared to patients that have an elevated ABI but compressible ankle arteries. The survival rate of patients in our cohort is comparable to previous studies where patients with ABI > 1.3–1.4 have been analyzed as a single group.32,20,8 Increased cardiovascular mortality has also been associated with patients that have an elevated ABI previously,33,34 though no differentiation has been made between the patients with an abnormally high ABI. The results of this study highlight that the difference is significant between patients with incompressible ankle arteries and those that have an abnormally high ABI but still compressible arteries and may be useful in guiding treatment of patients.
ABI is predominantly used as a diagnostic test for LEAD. Therefore, the clinician easily dismisses unmeasurable ABI results due to incompressibility of ankle arteries as undiagnostic. However, due to the high disease burden and increased overall and cardiovascular mortality of these patients the result of incompressible ankle arteries should prompt aggressive treatment of risk factors and antithrombotic medication. According to the results of this study, in the group of patients with abnormally high ABI values, it is especially those that have incompressible ankle arteries in at least one lower limb that have the poorest prognosis and may therefore benefit from intensified treatment. In addition, careful consideration of treatment modality and necessity should be exercised, since it is known that in patients with highly calcified arteries there are increased risks associated with interventions. 22
There was variance in the TP of the patients with incompressible ankle arteries and nearly 40% of the patients had a severely lowered TP < 50 mmHg in at least one lower limb indicating compromised arterial blood flow to the foot and LEAD. 35 According to our results, the survival of the patients with incompressible ankle arteries implying severe arterial calcification and a gravely lowered TP < 30 mmHg is especially poor. Previously, it has been shown that almost 20% of patients with normal ABI 0.9–1.3 have TP < 50mmHg. 8 This may imply that in the early stages of calcification of ankle arteries ABI may be elevated and falsely normal even though the patient has clinically significant LEAD.
Our study has several limitations. The patients in the study were all referred to vascular laboratory measurements because of known or suspected vascular disease. Therefore, the data is not applicable to the general population. There is no data of the medication used by the patients or possible interventions that could affect survival. It is noteworthy though, that there is no convincing evidence of a favorable influence of medication on the progression of MAC. 36
Conclusions
Our study presents novel data of the differences between patients with an elevated ABI. The burden of disease is not distributed evenly in these patients. The patients for whom ABI cannot be measured due to incompressibility of the arteries have significantly higher overall and cardiovascular mortality and a greater burden of disease compared to the patients with a measurable yet abnormally high ABI. In patients with falsely elevated ABI, TP is a worthy option to assess blood flow to the lower limb and provides additive information of the prognosis of the patient. The results of this study highlight the usefulness of abnormally high ABI measurements as an indicator of the disease burden and cardiovascular risk of a patient and calls for additional investigations into the natural flow of arterial stiffening, and variance between patients with an elevated ABI.
Footnotes
Author contributions
M.L., M.V., and H.H. analyzed the data and drafted the manuscript. M.L. performed the statistical analyses. H.H. collected the data. M.V. and H.H. supervised the study project. All authors contributed to study design, revised the manuscript and approved the final manuscript.
Declaration of Conflicting Interests
The author(s) declared no potential conflicts of interest with respect to the research, authorship, and/or publication of this article.
Funding
The author(s) disclosed receipt of the following financial support for the research, authorship, and/or publication of this article: Funding: This work was supported by a grant from The Finnish Foundation for Cardiovascular Research (ML) and Sydäntutkimussäätiö
Data availability
The datasets generated during and/or analyzed during the current study are available from the corresponding author and prof Harri Hakovirta on reasonable request.