
Abstract
Nowadays, with rising energy prices, energy efficiency is playing an important role in all industries. Differential pressure-based measuring instruments are still widely used instruments with orifice flow meters being the most popular ones. Due to its simplicity, reliability, and ease of maintenance, orifice flow meters are very common measuring instruments in many industries. As these instruments are differential pressure-based instruments, they are increasing energy costs due to increased pressure loss. Conventional single-hole orifice (SHO) flow meters have many advantages but also some disadvantages that are affecting energy efficiency. These disadvantages like higher pressure difference, slower pressure recovery, lower discharge coefficient can be overcome by multi-hole orifice (MHO) flow meters. Computational fluid dynamics (CFD) simulations were used to study energy consumption of both SHO and MHO with four different β parameters. Results showed MHO to be more energy efficient compared to SHO with same β parameter. These results are showing one more advantage MHO have compared to SHO, but further research is needed to make them a drop-in replacement.
Introduction
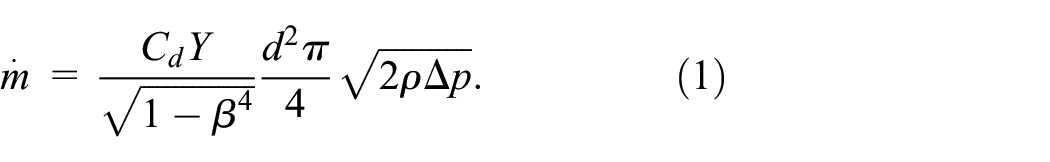
Having reliable data of flow measurements has always been an important issue, but today with limited availability of energy it is even more significant. Among the oldest flow measuring instruments, and still widely used, are those based on differential pressure measuring. Orifice flow meters due to its reliability, affordability, simplicity, and ease of maintenance are most popular differential pressure based instruments used in industry for accurate flow measurement. 1 Disadvantages of conventional single hole orifice (SHO) such as higher pressure difference, slower pressure recovery, etc. are influencing energy consumption. There are several standards covering orifice flow meters and method of use (e.g. EN ISO 5167-2:2012, API 14.3, BS 1042-1-1.2:1989), but the one used in this study was EN ISO 5167-2:2012. Measured pressure difference caused by the orifice plate installed in the pipe can be used to indirectly determine flow rate. In EN ISO 5167-2:2012 expression for the mass flow rate is defined as:
Important orifice structural parameter β is represented as ratio of square root of total orifice opening area and the pipe area ratio.

Extensive orifice flow meters research results were implemented in standards covering orifice flow meters. Expression for expansion factor used to compute flow rate of gases flowing through the orifice was first introduced by Buckingham 2 in 1932. First Kinghorn 3 presented expansion factor expression correction and after him Seidl 4 in his study presented additional correction. Cristancho et al. 5 introduced an alternative formulation of standard orifice equation for natural gas where discharge coefficient was expressed without Reynolds number. Ettouney and El-Rifai 6 analyzed discharge coefficient and expansion factor sensitivity to isentropic exponent and viscosity. Gomes-Osorio et al. 7 presented an equation that calculates mass flow rate using total orifice area and the pipe area ratio β, pressure change reduced by upstream pressure, heat capacity ratio, and upstream temperature.
Disadvantages of orifice flow meters and attempts to overcome them were also covered by numerous researchers. Installation effects and inlet velocity distribution were studied by Morrison et al. 8 Morrison et al. 9 studied effects of upstream velocity profiles on orifice flow meter performance. Disturbances caused by upstream bends and its influence on orifice and Venturi flow meters discharge coefficients were studied by Himpe et al. 10 Morrison et al. 11 experimentally studied response of an orifice flow meter to disturbances generated by a concentric tube flow conditioner and a vane-type swirl generator. Prabu et al. 12 experimentally studied effects of upstream pipe fittings (single 90° miter bend, double 90° miter bend in plane, and double 90° miter bend out of plane) on the performance on the orifice flow meter and conical flow meter. Zimmermann 13 experimentally studied disturbances of single bends and double bends out of plane with and without spacer tubes on orifice meter flow measurements. Recommendations for the revision of required upstream straight lengths defined in standard EN ISO 5167-2 were also presented.
Different improvements of orifice flow meters were also explored. Morrison et al. 14 proposed a slotted orifice flow meter with same total orifice area and the pipe area ratio (β = 0.5) as a replacement for conventional single hole orifice flow meter. Proposed slotted orifice flow meter had lower pressure difference, faster pressure recovery, higher discharge coefficient, and substantially less sensitivity to upstream conditioning compared to SHO flow meter. Elsaey et al. 15 studied fractal shaped orifice flow meter and its effects on flow mixing properties and pressure difference. Shaaban 16 proposed a new design, a ring installed downstream of the conventional orifice flow meter that reduces permanent pressure loss, increases discharge coefficient, and reduces required upstream lengths. The proposed new design could significantly save energy consumption, but no quantification of consumed or saved energy was presented.
Beside experimental studies orifice flow meters were topic of numerical studies, especially lately with growing power of computers and their application in engineering. In last two decades complex flow problems in different flow meters were successfully simulated with the use of computational fluid dynamics (CFD). 17 Hollingshead et al. 18 used the CFD to examine four different types of flow meters (Venturi, standard orifice plate, V-cone, and wedge flow meters) over a wide range of Reynolds numbers. In comprehensive numerical study, Shah et al. 19 presented CFD results of flow through a single hole orifice flow meter, while for numerical model validation experimental results of Nail 20 and Morrison et al. 21 were used. Singh and John Tharakan 22 used CFD to study SHO and MHO flow meters. Comparison of SHO and MHO flow meters in demineralized water over a wide range of Reynolds numbers showed that MHO are superior to SHO in terms of pressure recovery and discharge coefficient.
One more advantage of the orifice flow meters is their ability to measure multiphase flow rates. Morrison et al. 23 experimentally studied slotted orifice flow meter performance in air and water mixture. Studied slotted orifice flow meter showed to be insensitive to upstream flow conditions and responded to two phase flow in a way that can easily be characterized. Steven and Hall 24 researched conventional single hole orifice flow meter response to wet gas. Kumar and Ming Bing 25 numerically compared slotted orifice flow meters with different slot shapes and their performance in wet gas flow measurement.
In this work all orifices, in total 16 of them were simulated by commercially available CFD code Siemens Simcenter Star CCM+ and good agreement between simulation results and experimental results were obtained. Input parameters, homocentric circle diameter dc, β parameter, and Reynolds number were varied, while power consumption was analyzed through pressure loss. Structural parameters (β parameter and homocentric circle diameter dc) were varied by changing orifice geometry, while Reynolds numbers were varied by changing air mass flow rate. In Figure 1 detailed illustration of application range of pressure difference and pressure lose is shown. Pressure difference represents difference between upstream pressure p1 and downstream pressure p2, while pressure loss represents difference between upstream pressure pinlet and downstream pressure p3.
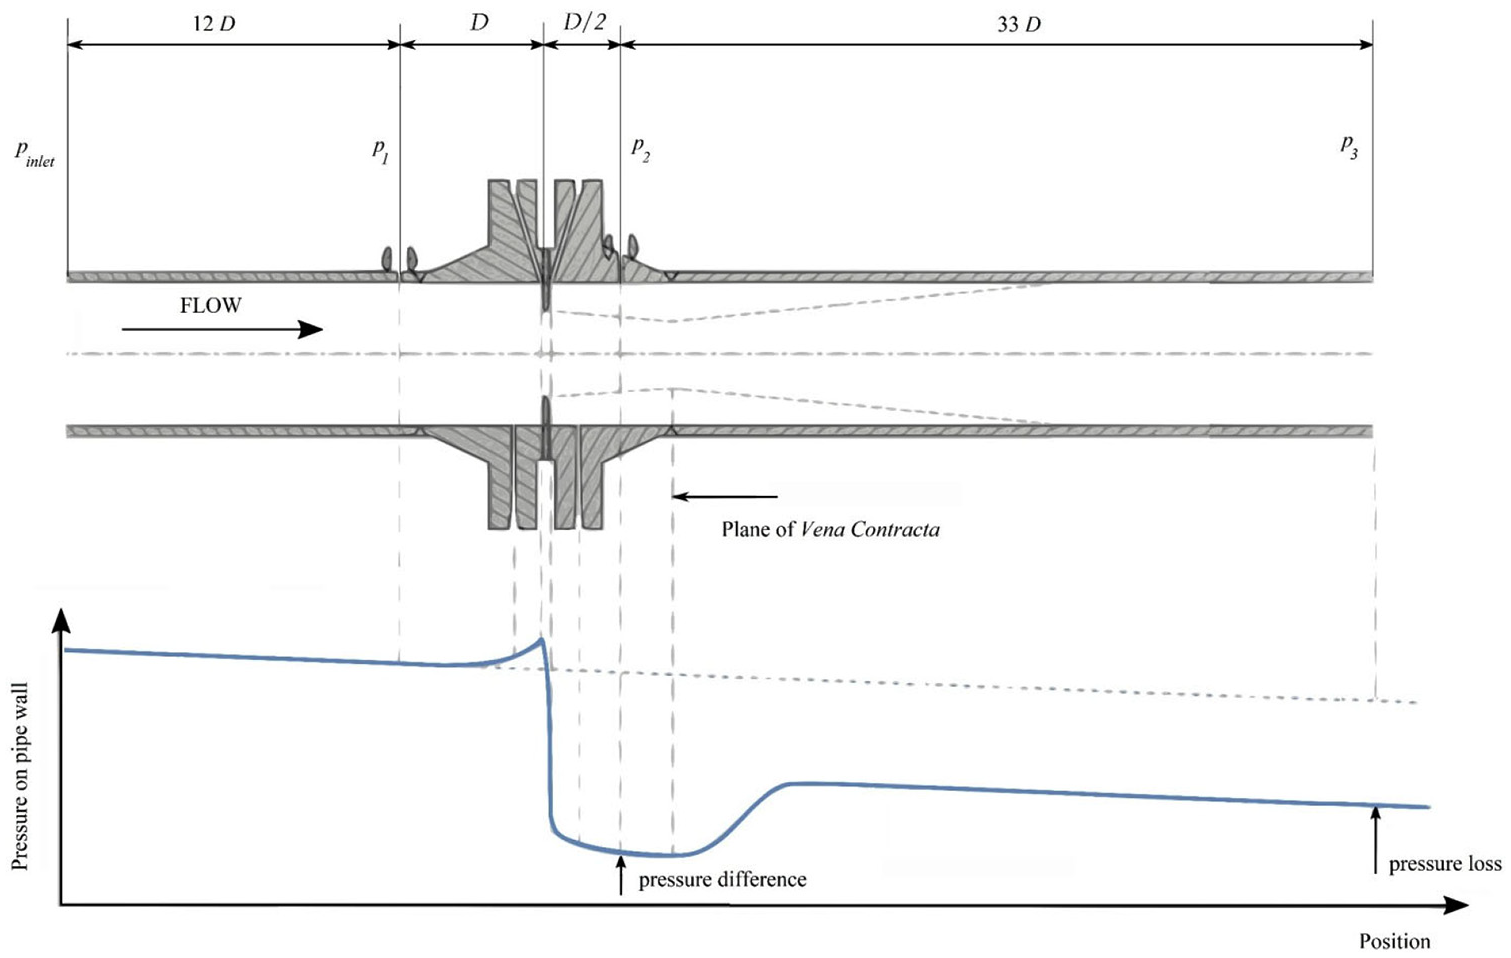
Flow through orifice plate with approximate pressure profile. 1
For all the analysis in simulations and experiments, fluid (air) compressibility was considered, where fluid density was defined as:

The main goal of the present work was to compare energy consumption of SHO and MHO flow meters with different β parameters. Consumed power by each orifice can be computed using expression:

Multiplying Bernoulli’s equation by mass flow rate (ρQ) power of the flow at pipe inlet can be obtained. In equation form this is 26 :

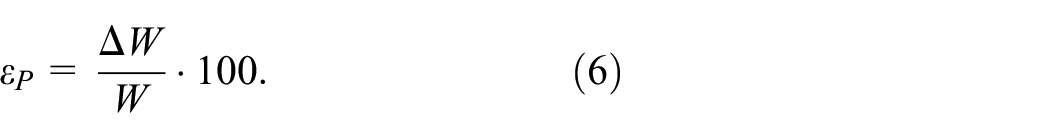
while relative power loss as:
Energy consumption of SHO and MHO flow meters was analyzed through pressure loss and equations (4)–(6). Structural parameter’s (β parameter and homocentric circle size) influence on SHO and MHO flow meters energy consumption was also analyzed. Direct energy consumption comparison was made between the MHO and SHO flow meters with same β parameters (0.5, 0.55, 0.6, and 0.7). Pressure difference for all cases was calculated across distance of 1D upstream and ½D downstream of the orifice, while pressure loss represents difference between inlet pressure at 12D upstream of the orifice and outlet pressure at 33D downstream of the orifice (Figure 1).
To analyze pressure recovery pattern for grid sensitivity study two nondimensional values were introduced, pn and Zn that were defined as:


To determine discharge coefficient Cd from equation (1) expansion factor Y had to be taken in consideration. Expansion factor Y should be determined experimentally but for the studied orifices it wasn’t, hence, singular pressure loss coefficient ξ was introduced. For numerical model validation singular pressure loss coefficient ξ was used as a parameter for SHO and MHO flow meters simulation and experimental results comparison. Expressions for singular pressure loss coefficient ξ are:

and

Open literature contains no information about energy consumption of simulated SHO and MHO flow meters for gaseous fluids.
Single-hole and multi-hole orifice design
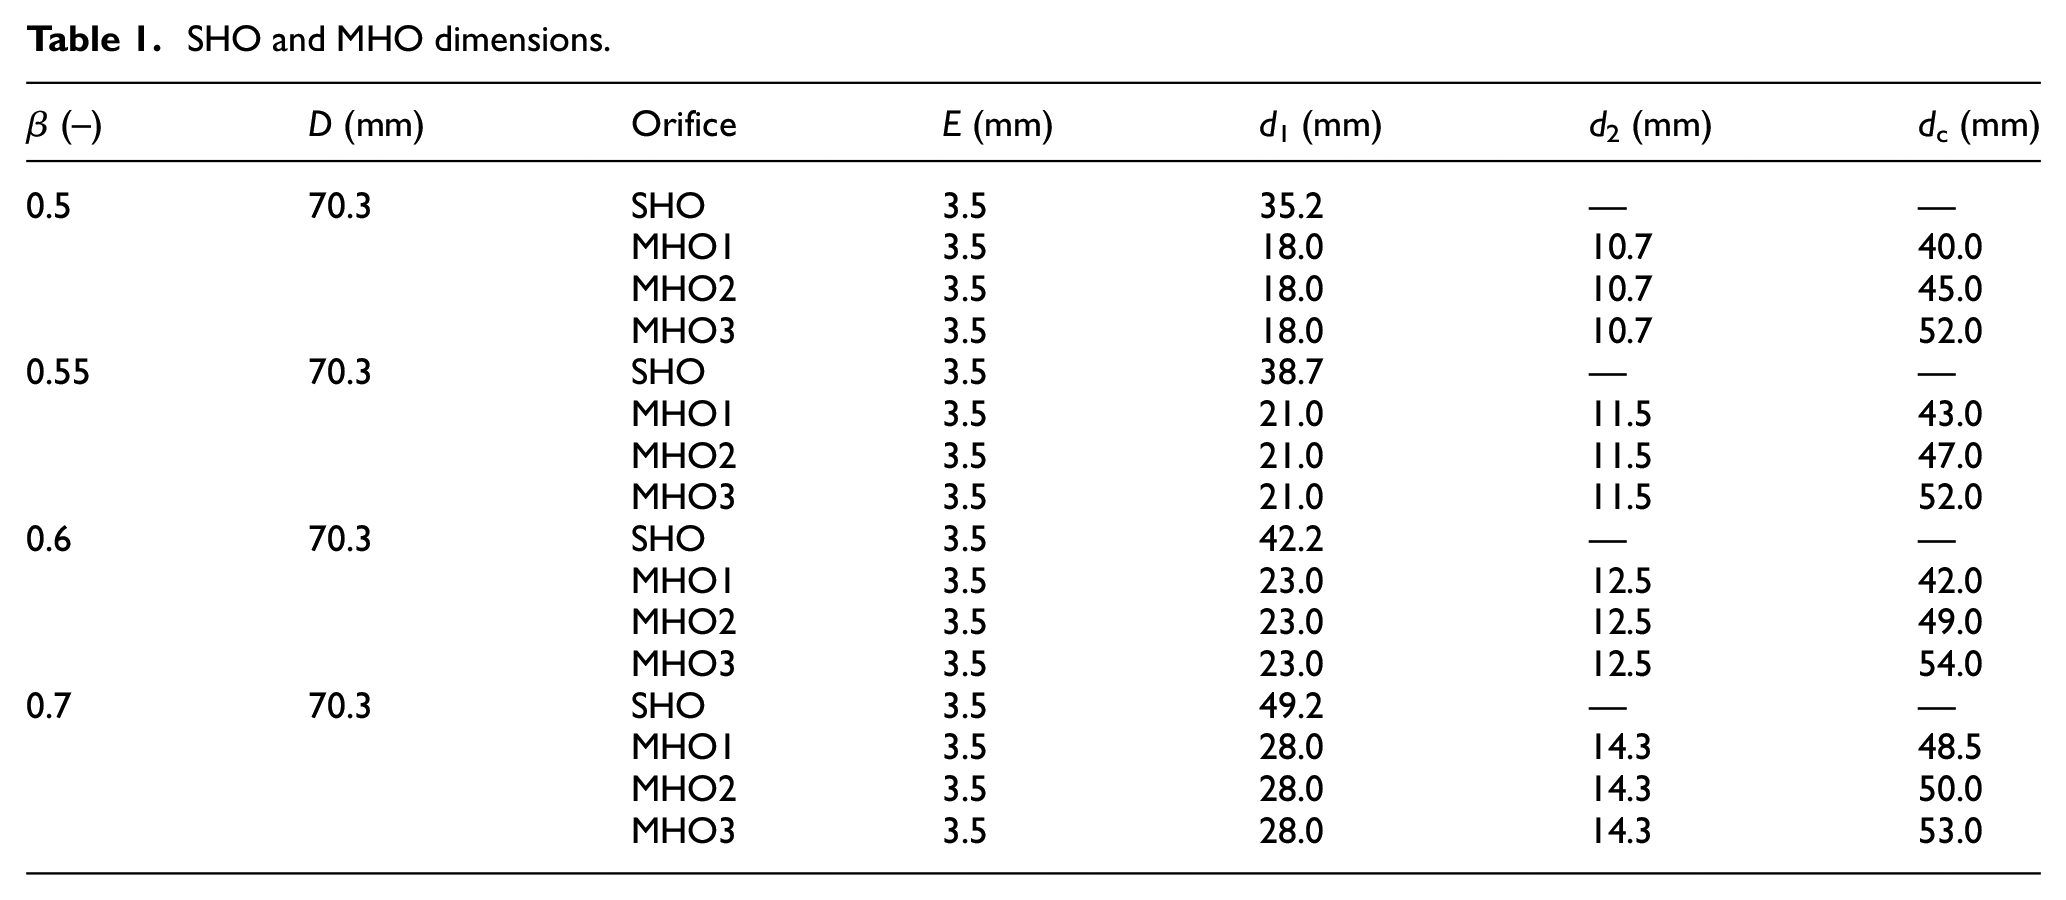
For this study both SHO and MHO were designed and numerically simulated. There were four different β parameters (0.5, 0.55, 0.6, and 0.7). For each β ratio one SHO and three MHO were designed, keeping the total flow areas of SHO and MHO equal. The MHO plates were designed with one central circular opening and eight smaller circular openings evenly distributed on a homocentric circle. Singh and John Tharakan 22 numerically studied and compared SHO and MHO with same total orifice area and the pipe area ratio (β = 0.5) in demineralized water. Their design of MHO was used as a model for MHO design in the present study. Reason for using similar MHO geometry as Singh and John Tharakan 22 was to explore this MHO performance in gaseous fluids. Table 1 and Figure 2 are showing details of studied orifice plates. All designed orifice dimensions were in accordance with EN ISO 5167:2-2012. Although MHO are not covered by available standards, same equations from standard EN ISO 5167:2-2012 for flow rate (equation (1)) can be used since MHO work on the same principle as SHO.
SHO and MHO dimensions.

SHO and MHO geometry.
Numerical model
Total of 16 orifice plates were simulated under fully developed laminar and turbulent flow with Reynolds numbers ranging from 500 to 400,000. To achieve this air mass flow rate was varied, while density, temperature and pressure were constant (p = 200 kPa, t = 298.15 K, and ρ = 3.513 kg/m3). Besides mass flow rate, structural parameters were also varied (β parameter and homocentric circle size). All simulations were set to be in steady state. Figure 3 is a schematic of computational domain, a pipe 3167 mm long and 70.3 mm diameter, with sections of 12D upstream and 33D downstream of the orifice.

Computational domain.
Grid design
Good quality computational grid is of key importance for obtaining reliable CFD results. For this study unstructured polyhedral grid was chosen. There were three regions, one around the orifice plate with unstructured polyhedral grid and two extruded regions that produced orthogonally extruded cells upstream and downstream of the orifice to help simulation converge. In regions near the wall prism layer was implemented to improve accuracy of the computation in the near wall regions. Four layers of prism cells with total layer thickness of 45% of the base cell size were modeled. In Figure 4 details of the grid can be seen.

Grid details.
Governing equations
The governing equations used in this study are
Continuity equation:

Momentum equation:

Numerous authors used standard k-ϵ turbulence model in their orifice flow meters numerical studies.19,22,27,28 Same model was chosen for this study and it is given by:
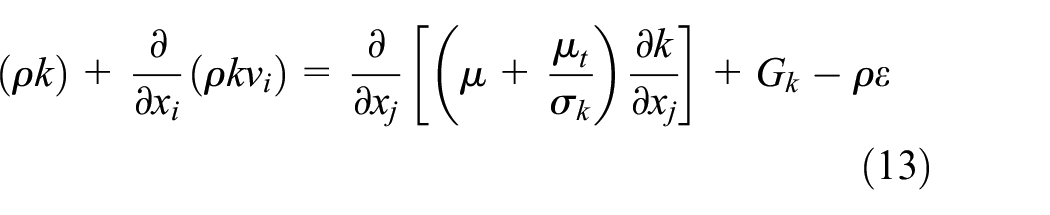

Where C1ϵ, C2ϵ, σk, and σϵ are standard k-ϵ turbulence model constants while Gk is turbulent production and it is modeled as:

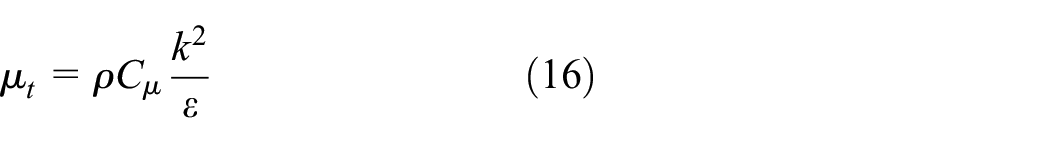
Turbulent viscosity is computed as:
Boundaries
A mass flow inlet boundary condition was used at the pipe inlet while flow split outlet boundary at the pipe outlet. Air as a working fluid was specified with temperature of 25°C and density of 3.513 kg/m3. The mass flow inlet boundary represents an inlet where mass flow rate is known and for the purposes of this study was varied from 0.00051 to 0.61415 kg/s. Flow split boundary represents the outlet of a pipe or duct with mass conservation and no specified pressure. All wall surfaces were specified as no-slip wall boundary types with high y+ wall treatment for near wall modeling. The high y+ wall treatment is a wall-function approach where it is expected that near wall cells centroid falls within the boundary layer’s logarithmic region.
Numerical solution strategy
Segregated flow solver was used to solve all governing equations in a segregated or uncoupled manner. This solver controls solution update according to SIMPLE algorithm as well as two additional solvers, Velocity solver and Pressure solver. Velocity solver solves the discretized momentum equations while Pressure solver solves discrete equations for pressure correction and updates the pressure field. The simulations were considered converged when the sum of each residual was less than 10−6.
Grid sensitivity analysis
In CFD simulations it is very important to evaluate grid quality by checking if simulation results are invariant with the grid size. Grid quality in this paper was evaluated through discretization errors. Discretization errors were estimated by grid convergence index (GCI) based on Richardson extrapolation. The GCI method is currently the most reliable method available for the prediction of numerical uncertainty. 29
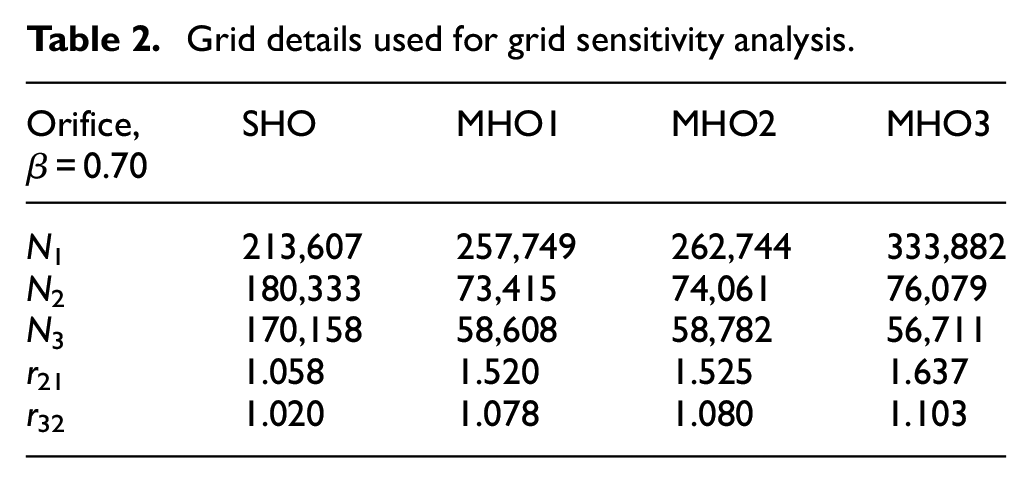
Details of three different grids used in the grid sensitivity study are shown in Table 2. Besides number of cells (N1, N2, and N3), grid refinement factor (r = hcoarse/hfine) for each generated grid was listed. For this study, four orifices (SHO, MHO1, MHO2, and MHO3) with same β parameter (β = 0.7) cases were coarsened to estimate the discretization error. Boundary conditions for all studied cases were same as conditions in experiments (Q = 166.84 m3/h, pin = 499 kPa, and t = 300.18 K).
Grid details used for grid sensitivity analysis.
GCI method results are presented in Table 3, where key variable important to the objective of the simulation study ф, is pressure difference Δp across distance of tappings 1D upstream and ½D downstream of the orifice. Pressure difference results for each grid (ф1, ф2, ф3), apparent order, p, of the method, extrapolated values фext21, approximate relative error ea21, extrapolated relative error eext21, and fine grid convergence index GCI fine 21 for each orifice are listed in table. Apparent order, p, of method was calculated using the expressions:


GCI method results for grid refinement.

Extrapolated values were calculated from:

For the last step, the following error estimates were calculated and reported along with the apparent order:


termed the approximate relative error, extrapolated relative error, and the fine grid convergence index, respectively.
Results in Table 3 are showing low values of GCI index meaning that with further grind refinement simulation results would change insignificantly. For example, pressure difference result of 20.979 mbar for orifice MHO1 would change for ±0.0224% with further grid improvement. Convergence for all studied orifices was monotonic.
Numerical model validation
Numerical model described above was validated with experimental data of Đurđević et al. 30 Figure 5 is a schematic of test facility where SHO and MHO flow meters were tested with air as working fluid. The air was drawn from air pressure tank, pressure regulator was used to regulate input pressure while globe valve was used to adjust the flow rate. Straight sections of 12D and 4D upstream and downstream respectively were provided. Elster quantometers type QAe250 and type QAe650 were used for air flowrate measurement with former having a measuring range 20–400 m3/h and latter 50–1000 m3/h, with an accuracy of ±1.5% over a scale of 20%–100% of Qmax while accuracy of ±3% was over a scale of 10%–20% of Qmax. Yokogawa’s absolute and differential pressure transmitters were used for upstream pressure and differential pressure measurement, respectively. Absolute pressure transmitter model EJA510A had a measuring range of 0–10 MPa and accuracy of ±0.2% while differential pressure transmitter model EJA110A had measuring range of 0–50 kPa and accuracy of ±0.065%.

Test facility.
Simulation and experimental discharge coefficient results comparison of SHO and MHO1 flow meters with β = 0.7 are shown on Figure 6. Good agreement between the two has been achieved with maximum deviation being within 7.9% for SHO flow meter and 5.4% for MHO1 flow meter. These results are validating numerical model and allowing further use of it in SHO and MHO flow meters energy consumption study.
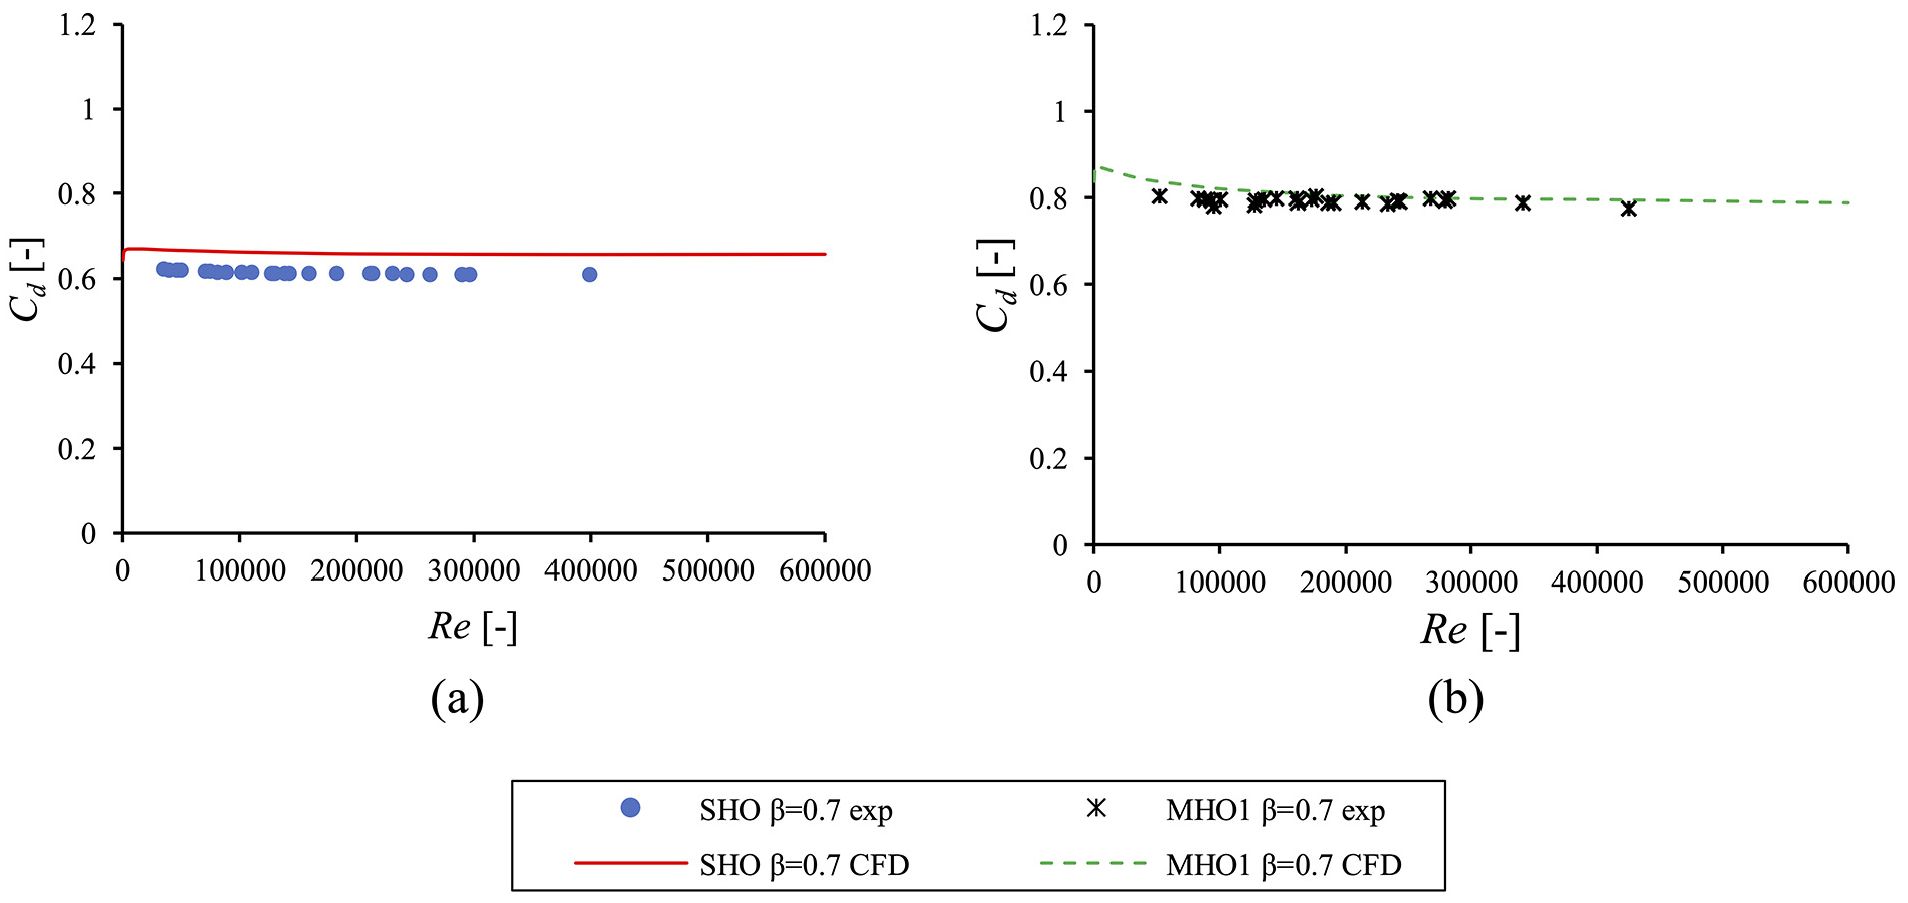
Comparison of experimental and numerical simulation results: (a) SHO β = 0.7 and (b) MHO1 β = 0.7.
Results and discussions
Pressure difference and pressure loss
A differential pressure orifice flow meter is required to have an approximately constant discharge coefficient in fully developed flows, and to have a known dependency of Reynolds number with insignificant change for the change of the Reynolds numbers. 31 Measuring pressure difference makes it possible to indirectly determine flow rate using equation (1), thus making pressure difference and flow rate relationship important for orifice flow meters. From the equation (1) a linear function of pressure difference square root and volumetric flow rate can be derived, and it is shown in Figure 7. Comparing SHO and MHO flow meters with same β parameter at same flow rates, MHO flow meters had lower pressure difference. With the β parameter increase pressure difference decreases thus can be concluded that orifices with higher β parameter are less responsive to flow changes (Figure 7). It can also be observed form Figure 7 that MHO flow meters with same β parameter as SHO flow meters are less responsive to flow changes than SHO flow meters. For all simulated MHO flow meters homocentric circle size had influence on orifices with β = 0.5 while for all other orifices homocentric circle had no significant influence on pressure difference.
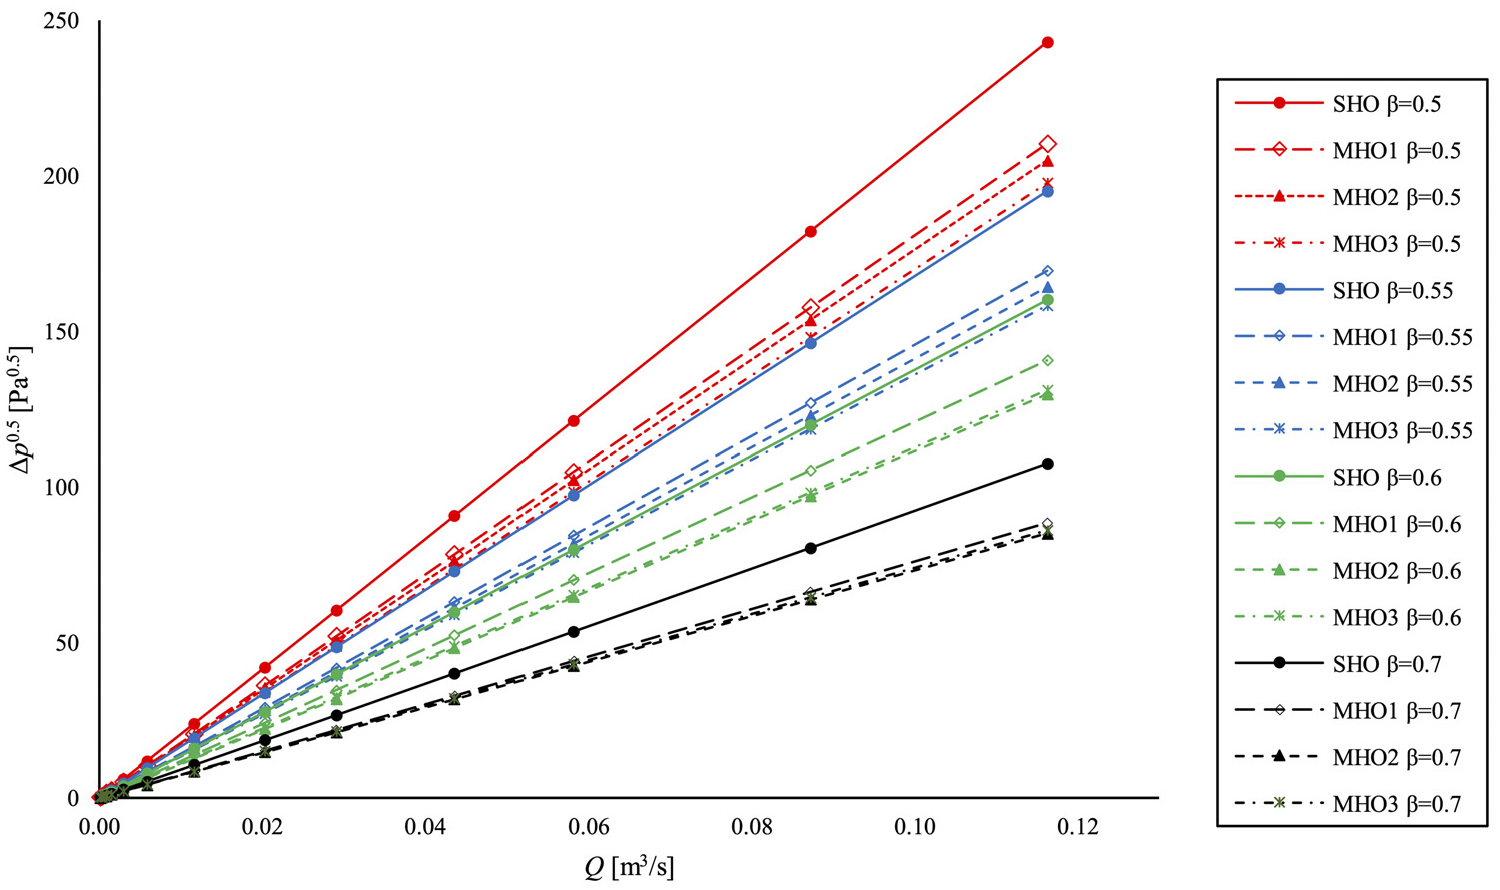
Pressure difference and volumetric flow rate relationship.
Figure 8 shows pressure loss and Reynolds number relationship. The higher the Reynolds number was pressure loss across computational domain was greater. With β parameter increase pressure loss was decreasing while with β parameter decrease pressure loss difference between SHO and MHO flow meters of same β parameter was increasing. For same Reynolds numbers SHO flow meter with β = 0.5 had greatest pressure loss while MHO1 flow meter with β = 0.7 had smallest pressure loss of all simulated orifices. Greatest pressure loss improvement for orifices with same β parameter could be seen for MHO flow meters with β = 0.5, while the least improvement for MHO flow meters with β = 0.7.

Pressure loss and Reynolds number relationship.
Power consumption
Figure 9 shows SHO and MHO flow meters power consumption according to equation (4). SHO flow meter with β = 0.5 had the greatest power loss of 5118.52 W while MHO1 flow meter with β = 0.7 had the lowest power loss of 748.08 W of all simulated orifices for Reynolds number of 400,000. With β parameter increase power consumption was decreasing, also for all studied orifices MHO flow meters had lower power loss compared to SHO flow meters with corresponding β parameter. With Reynolds number increase, power loss was increasing and this was the case for all simulated orifices. From Figure 9 it could also be seen that power consumption of 2158.82 W for SHO with β = 0.5 at Reynolds number of 300,000 is close to power consumption of MHO1 β = 0.55 of 2543.26 W at Reynolds number of 400,000 meaning that MHO with greater β at higher Reynolds numbers have similar energy consumption as SHO with smaller β at lower Reynolds numbers.
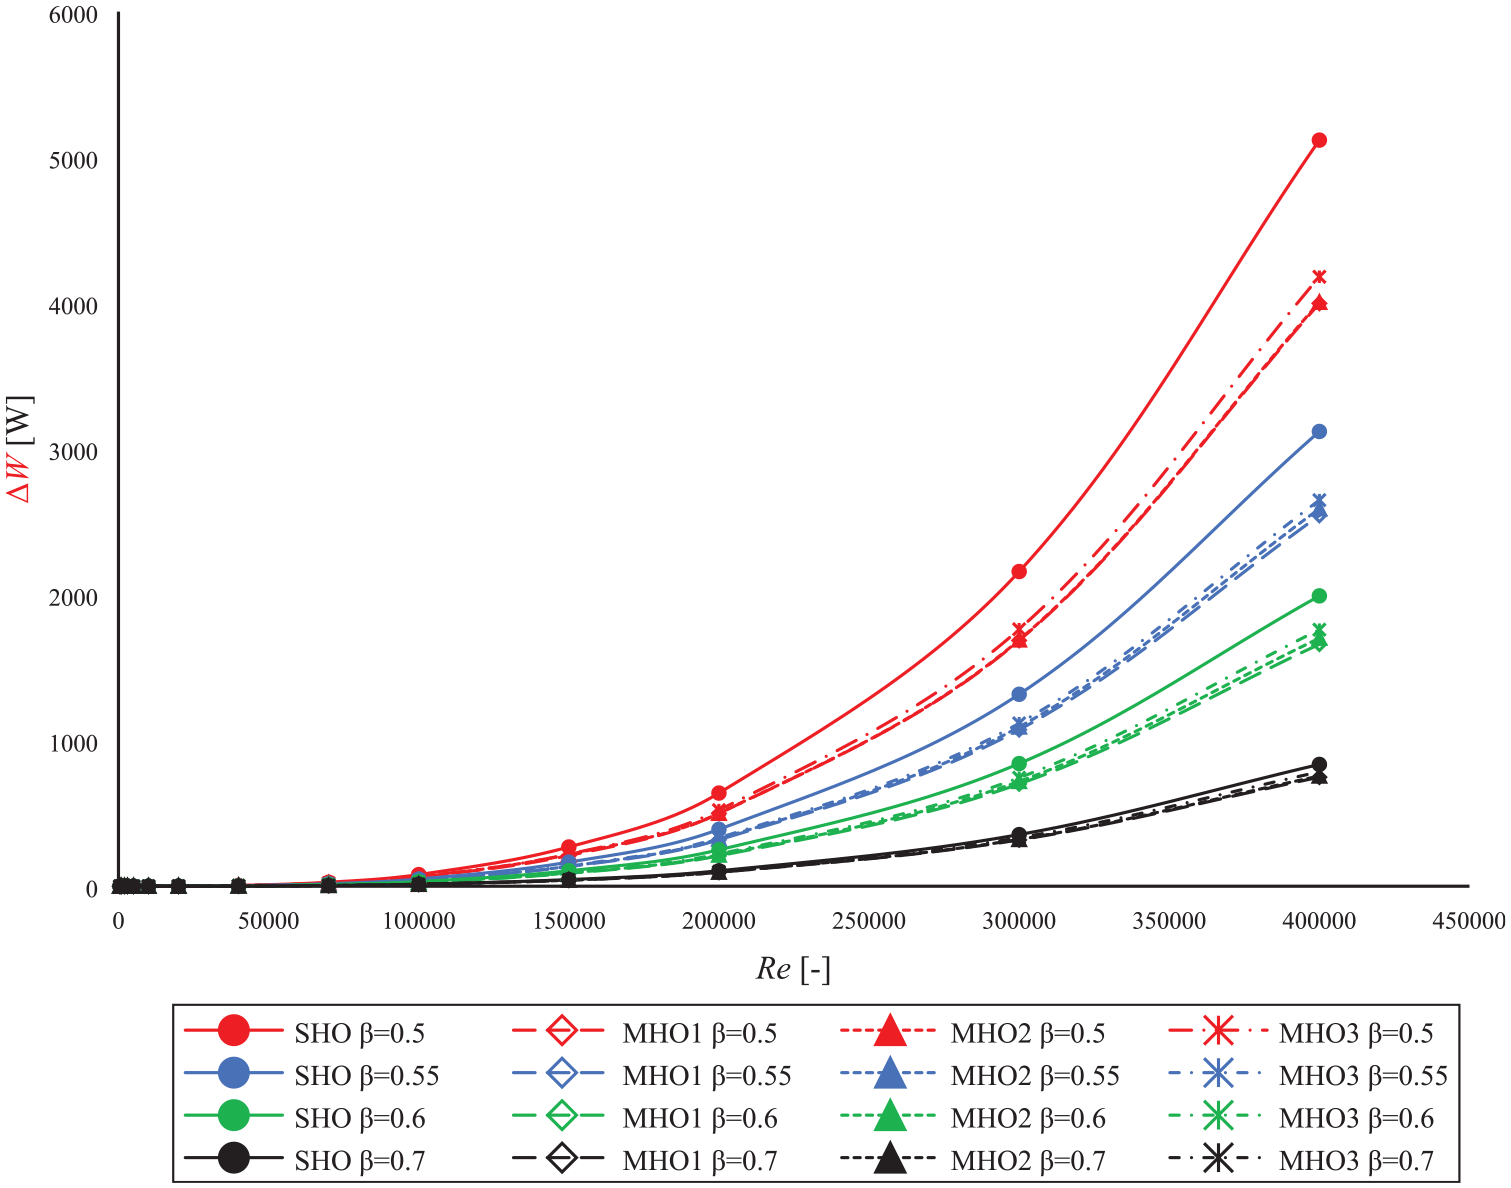
Power consumption.
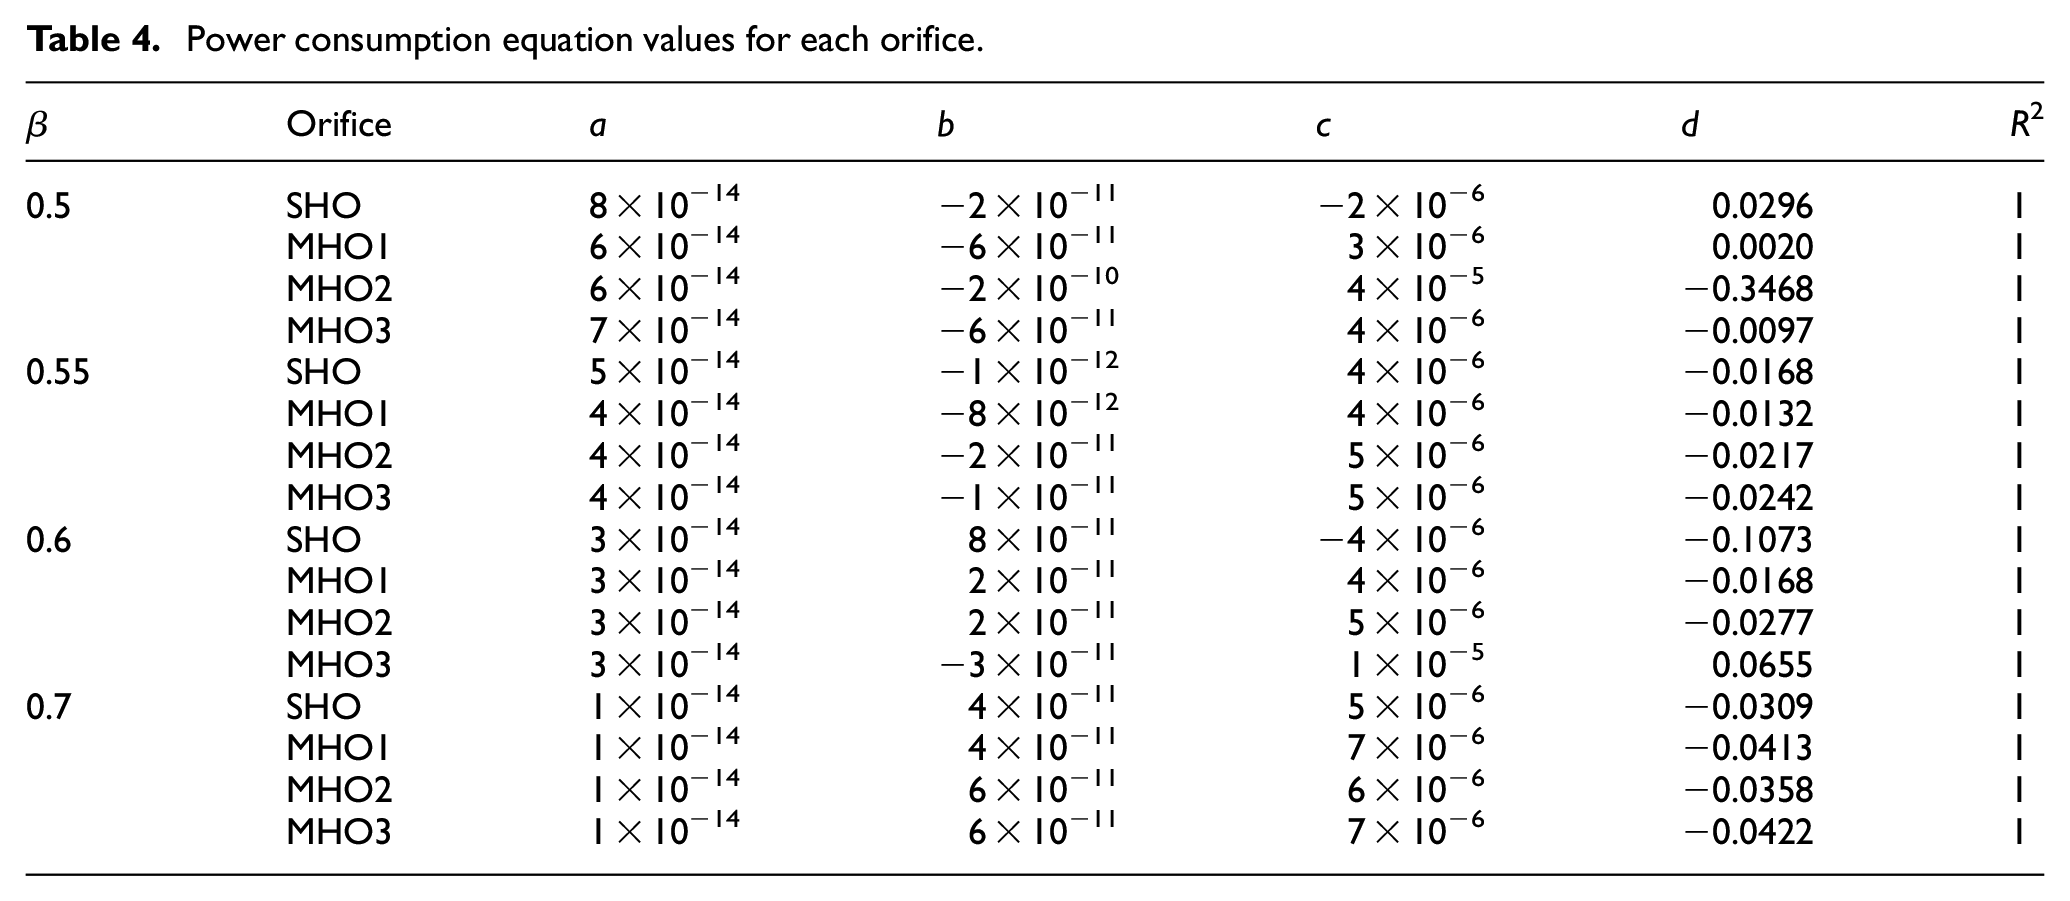
Based on simulated results presented in Figure 9, equation (24) can be extracted. Equation (24) is an estimate of power consumption for all orifices, while values listed in Table 4 are defining power consumption equation for each orifice.

Power consumption equation values for each orifice.
Relative power loss
Figure 10 shows dependence of the relative power loss (equation (6)) as a function of the flow power (equation (5)) for all simulated orifices. This shows which orifice is the most energy efficient in gaseous fluids. It can be observed that relative power loss of all orifices (SHO and MHO) with β = 0.7 is the lowest, while all orifices (SHO and MHO) with β = 0.5 had the greatest relative power loss. With the increase of flow power relative power loss increased as well, while relative power loss decreased with β increase. MHO flow meters for all simulated cases had lower relative power loss compared to SHO flow meters of corresponding β parameter. Comparing MHO with different β parameters it can be observed that MHO3 had the biggest relative power loss for all simulated orifices with results of 35.19%, 22.29%, 14.81%, and 6.6% for β parameter values of 0.5, 0.55, 0.6, and 0.7. MHO2 relative power loss was 33.72%, 21.79%, 14.32%, and 6.36% for β parameter values of 0.5, 0.55, 0.6, and 0.7, while for the same β parameter values MHO1 had relative power loss of 33.72%, 21.4%, 13.97%, and 6.29%. The biggest energy saving for orifices with same β parameter was observed for orifices with β = 0.5 where MHO1 flow meter relative power loss was 33.72% compared to SHO flow meter relative power loss of 43.08%, while orifices with β = 0.7 had lowest energy saving where MHO1 flow meter’s relative power loss was 6.29% compared to SHO flow meter’s relative power loss of 7.03%. It can also be noted that the size of homocentric circle is not significantly influencing relative power loss for all simulated orifices. This energy saving for MHO flow meters can be attributed to MHO flow meters geometry where there are more evenly spread area compared to only one central opening of SHO flow meter (Figure 2). Downstream of the central SHO flow meter’s opening, large sized eddies are generated, while downstream of the MHO flow meter smaller size eddies are generated due to more evenly spread open area (Figure 11). MHO flow meters have smaller obstruction of the flow which makes them more energy efficient compared to SHO flow meters.

Relative power loss.

Scalar vortex representation for orifices with parameter β = 0.7 at Re = 70,000: (a) SHO and (b) MHO2.
Conclusion
In this study SHO and MHO flow meters with different β parameters (0.5, 0.55, 0.6, and 0.7) were numerically studied in air flows over a wide range of Reynolds numbers. Energy consumption comparison for all simulated orifices has been done. Pressure difference, pressure loss, and structural parameters influence (total orifice area and the pipe area ratio –β and homocentric circle size) on energy consumption, were analyzed.
This study showed that orifices with lower β parameter had higher pressure difference compared to orifices with higher β parameter for the same flow rates. For pressure loss same trend was observed as for pressure difference. For all simulated orifices MHO flow meters had reduced pressure difference and pressure loss compared to SHO flow meters. Homocentric circle size had influence only on orifices with β = 0.5, for all other simulated orifices homocentric circle size influence on either pressure difference or pressure loss was insignificant.
Besides pressure difference and pressure loss, power consumption and relative power loss for all simulated orifices were reported. Orifices with higher β parameter had lower power consumption as well as lower relative power loss compared to orifices with lower β parameter. MHO flow meters for all studied orifices had lower power consumption and lower relative power loss compared to SHO flow meters of corresponding β parameter. Homocentric circle size had influence on orifices with β = 0.5 while for other simulated orifices homocentric circle had insignificant influence on power consumption.
This study showed that MHO flow meters are more energy efficient than SHO flow meters with same β parameter, but they are less responsive to flow changes than SHO flow meters, hence require pressure difference measuring devices of higher quality to have reliable flow measurement data. MHO flow meters reduced energy consumption can be attributed to lower pressure loss. Main reason for the reduced pressure loss is MHO flow meter geometry which cases less of the flow obstruction casing lower pressure difference, thus making systems where they are installed more energy efficient. Results presented in this study are showing one more MHO flow meter advantage compared to SHO flow meters and are putting it step ahead of SHO flow meters, but further research is needed to make them a drop-in replacement.
Footnotes
Appendix
Acknowledgements
The authors gratefully acknowledge all support from GasTeh d.o.o. Inđija that allowed use of their test facility as well as manufacturing all necessary orifices and parts for the study. This paper is the result of research within the project “Research and development of ionic bio fluids – RIDIBF” which is implemented within the Program for excellent projects of young researchers – PROMIS funded by the Science Fund of the Republic of Serbia.
Handling Editor: Chenhui Liang
Author contributions
Marko Đurđević dealt with modeling of geometry and execution of numerical simulations. Siniša Bikić has conducted set up of numerical model. Maša Bukurov was in charged for verification of results of numerical simulations. Slobodan Tašin has carried out data processing. All researchers participated in the writing of manuscript. It is worth of mentioning that all researchers participated in the past in experimental investigation of the considered single-hole and multi-hole orifices.
Declaration of conflicting interests
The author(s) declared no potential conflicts of interest with respect to the research, authorship, and/or publication of this article.
Funding
The author(s) disclosed receipt of the following financial support for the research, authorship, and/or publication of this article: This work was supported by The Scientific Fund of the Republic of Serbia under grant “Research and development of ionic bio fluids – RIDIBF.”
Ethical approval/patient consent
In our research we did not use human and animals.