
Abstract
Due to its serious consequences, cavitation in pipeline systems is one of the main concerns of engineers. In this context, the incipient cavitation index defined in many international standards such as those from International Society of Automation and International Electrotechnical Commission is a very important parameter as it accounts for the onset of cavitation. However, the standards define only the experimental determination of the incipient cavitation index, which is furthermore difficult to perform due to the considerable technical and economical burden of the experimental tests, above all in case of large-size systems. In this work, we propose a new method for predicting the incipient cavitation index by means of computational fluid dynamics, avoiding the need of making any experiment. The method is based on the generalized pressure criterion and requires only one Reynolds-averaged Navier–Stokes simulation of single-phase incompressible flow to provide estimates of the incipient cavitation index. The method is applied to predict the incipient cavitation index of multi-hole orifices with different geometrical characteristics, in terms of equivalent diameter ratio (0.40–0.70), relative thickness (0.73, 1.00), and number (13–52) and disposition of the holes. The experimental data revealed the reliability of the method. Its applicability was also confirmed for more complex geometries, and an application example regarding a control valve is briefly illustrated at the end of this article.
Keywords
Introduction
Cavitation in pipeline systems is one of the main concerns of engineers as it can result in serious damages of the plants. It is well known that cavitation is more likely to occur in case of a high variation in the flow velocity, as in correspondence of either moving parts (vanes of turbines, pump impellers) or non-moving parts (pipeline fittings, valves). Among the non-moving elements, multi-hole orifices (Figure 1) are widely used to reduce flow nonuniformities or, placed side by side a valve, to attenuate noise and vibrations and reduce the cavitation itself.
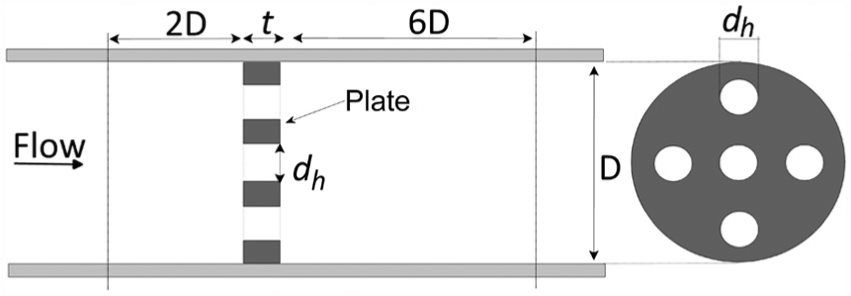
Sketch of a multi-hole orifice and position of the reference upstream and downstream sections according to ISA-RP75.23-1995. 1
Cavitation is a two-stage process associated with the flow of liquids, which is based on the formation and collapse of vapor cavities in low-pressure regions, causing noise and vibrations of the plant. According to the international standards, different cavitation regimes are identified. Following ISA-RP75.23-1995, 1 they are: (1) Regime I: absence of cavitation; (2) Regime II: incipient cavitation, the onset of cavitation, when only small vapor bubbles are formed in the flow stream; this condition is detected by measuring increased sound pressure level (SPL) or vibration; (3) Regime III: constant cavitation, involving a sufficiently large volume of vapor to produce a uniform and constant level of cavitation; and (4) Regime IV: maximum vibration, that is, the level of cavitation associated with peak vibration measurements. The cavitation level that causes damages to the components of a plant is difficult to determine a priori, and it is usually indicated by the manufacturers on the basis of experience. Clearly, the more conservative choice consists in restricting all operations to a cavitation-free regime even if typically the incipient cavitation is of mild level and therefore may be acceptable in the design phase.1,2
Cavitation is often studied by means of specific indexes, such as the different cavitation numbers proposed in the literature,2–4 or the net positive suction pressure common in the context of pumps and turbines.
5
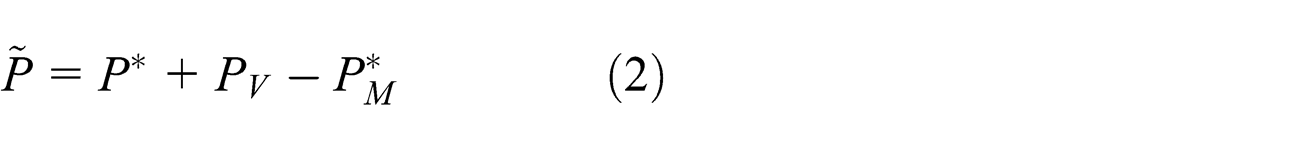
In this work, we make reference to the cavitation index

where
Different threshold values of σ are defined: the incipient cavitation index

Qualitative trend of sound pressure level (or pipe wall acceleration) as a function of cavitation index. The horizontal axis is in logarithmic scale. As indicated, the incipient cavitation index corresponds to the change in slope of the data.
A plot of the flow rate

Identification of cavitation by the plot of square root of pressure drop versus flow rate.
Many researchers investigated experimentally the cavitation characteristics of different devices; among them, Tullis,2,7 Kim et al., 8 Testud et al., 9 Maynes et al., 10 and Malavasi et al. 11 focused on single- and multi-hole orifices. However, the already mentioned procedure reported in the ISA-RP75.23-1995 1 and IEC 60534-8-2 6 for estimating the incipient cavitation index by means of SPL or pipe wall acceleration measurements is not free from difficulties mainly arising from the fact that the change in slope in the plot of Figure 2 is not always clearly identifiable, even in the presence of a large number of sampling points. In addition, the economical burden of the tests may be considerable especially for large-size systems. Computational fluid dynamics (CFD) has been explored as a possible alternative approach to deal with cavitation. Some authors12–15 made use of two-phase models to describe the process of rising and implosion of the vapor bubbles under cavitating flow conditions. These models appear able to reproduce the position of the cavitation pockets as well as the flow field of the cavitating fluid very accurately, but compared to a single-phase Reynolds-averaged Navier–Stokes (RANS) model they introduce numerical difficulties and are more time-consuming. Above all, the estimation of the cavitation limits (which are the really significant parameters in most engineering applications) is not straightforward when using these two-phase models; focusing on the incipient cavitation index, several flow conditions may need to be simulated in order to determine in the end the one which corresponds to the onset of cavitation.
In this work, a new method for estimating the incipient cavitation index using CFD is proposed. The method relies on the generalized pressure criterion that we previously developed to predict the presence of cavitating conditions in single-hole orifices. 16 The proposed procedure requires just one RANS simulation of single-phase incompressible flow to estimate the incipient cavitation index. This feature makes the new method attractive and very useful for engineers, especially with regard to its application to complex geometries and large-size systems.
This article essentially concerns the application of the method to multi-hole orifices which, despite their apparent simplicity, are devices of considerable interest for the applications. The good predictive capacity of the proposed method is tested with respect to our own experimental data, paying particular attention in quantifying the uncertainties of both measurements and computations. Table 1 reports the geometrical characteristics of the orifices considered, which differ in terms of diameter
Geometrical configuration of the tested plates.

The remainder of the article is divided into four sections, followed by the conclusion. Section “The proposed method” explains the proposed method for estimating the incipient cavitation index. Section “Experimental setup” describes the experimental design and methods used to collect the data, together with the quantification of measurements uncertainty. Section “Numerical model and consistency of the numerical solution” focuses on the numerical model with reference to the key settings (domain configuration, mesh resolution, differencing schemes, boundary conditions, turbulence modeling). Section “Results” proves the capacity of the proposed method to correctly estimate the incipient cavitation index in multi-hole orifices by comparison to our own experimental data. The end of the same section is dedicated to showing the reliability of the method in case of more complex devices and briefly reports an application example regarding a control valve.
The proposed method
As already mentioned, the proposed method relies on the generalized pressure criterion that we developed in previous works. At first, we will briefly illustrate the fundamentals of such criterion (the reader may refer to Malavasi and Messa 16 for more details). Afterward, we will explain the procedure for estimating the incipient cavitation index, which constitutes the novelty of this article.
The starting point of the generalized pressure criterion is that when running a RANS simulation of incompressible flow, the computed pressure field
In Malavasi and Messa,
16
we noticed that with reference to some works of the research group of Joseph and colleagues,17–19 the equality
so that the minimum value of

It is worth noticing that although it is defined making reference to the translated field

In section “Results,” we will show that the values of
Experimental setup
The experiments have been performed in a pilot plant located at Pibiviesse S.r.l., Nerviano, Italy. The rig, sketched in Figure 4, consists of 10″ and 12″ steel pipes, supplied by a pump that guarantees pressures up to 10 bar at the reference section upstream the plate. Control valves placed upstream and downstream the test area allowed setting the proper fluid-dynamic conditions for each experimental test. Pressure drop has been measured with a series of absolute and differential pressure transducers in reference sections located, as reported above, 2D upstream and 6D downstream the plate according to the ISA-RP75.23-1995.
1
Several other measurement points were placed up to 8D downstream the device to verify the proper occurrence of pressure recovery. The accuracy in the pressure measurements was 44, 155, or 260 Pa depending on the transducer used. The flow rate has been measured by an electromagnetic flowmeter of 10″, placed upstream the test section. As indicated by the manufacturer of the flowmeter on the basis of laboratory tests, the uncertainty on the pipe bulk-mean velocity

Sketch of the test rig.
The tests have been performed maintaining constant pressure at the upstream reference section, and decreasing the downstream pressure, in order to increase the Reynolds number and display the cavitation phenomena. The vapor pressure was taken as −0.98 bar, the temperature being close to 20°. The determination of the uncertainties of the experimental data was performed with respect to the International Organization of Standardization-GUM; 20 the maximum relative error on the cavitation index (equation (1)) was found to be about 0.8%. A more detailed description of the test rig and the experimental procedure is reported elsewhere. 21
Numerical model and consistency of the numerical solution
The PHOENICS 2009 CFD code was used to simulate the flow. PHOENICS uses the finite-volume method. The calculations were performed following the elliptic-staggered formulation in which the scalar variables are evaluated at the cell centers and the velocity components at the cell faces. Central differencing is employed for the diffusion terms, while the convection terms are discretized using the hybrid differencing scheme of Spalding,
22
as in previous studies concerning similar flows.
23
A parallel version of the SIMPLEST algorithm of Spalding
24
was used to solve the finite-volume equations. The code was run until the sum of the residuals over the whole solution domain was less than 0.1% of the variables, based on the total inflow. Convergence was reached within 9000 iterations for all the multi-hole orifice simulations. Additional checks revealed that the minimum computed pressure
Figure 5 shows the configuration of the computational domain. Due to the geometrical symmetry of the multi-hole orifices simulated, and because the steady RANS was being solved, only a quarter of the pipe section was simulated. At the inlet, a 1/7th power law velocity profile was set, while the distribution of the turbulent kinetic energy and of its dissipation rate was derived imposing a turbulent intensity of 5% and an inlet mixing length equal to 7% of the hydraulic diameter. At the outlet, the normal gradients of all variables and the value of the relative pressure were set to 0. As already remarked, with a single-phase incompressible RANS solver, the static pressure at the outlet section must be specified only to obtain a unique pressure field, which, otherwise, would be defined up to a constant. This property allowed us running all the simulations with a zero relative pressure at the outlet, and then, if necessary, add or subtract an arbitrary pressure to the whole computed pressure field. The inlet boundary was located 7D upstream the plate; such distance was verified to be sufficient to achieve fully developed flow conditions, confirming the results of Morrison et al. 25 20D were modeled downstream the device to provide accurate estimation of the region in which the pressure field is affected by the plate. Specific tests were performed to guarantee that such distance is sufficient for all the case study considered.

CFD domain configuration.
No-slip conditions were imposed on the walls of both the pipe and the plate. In the near-wall region, the non-equilibrium wall function of Launder and Spalding 26 was set, as per the indications of previous workers who dealt with similar kind of flows.23,27 In all cases, it was checked that the application of such condition was consistent with the non-dimensional distance of the first grid points from the walls.
To close the system of equations, use is made of the k–ε renormalization group (RNG) turbulence model which, taking care of the effect of rapid strain in complex flows, allows predicting the gross flow behavior in the recirculation region downstream the plate. The choice was made on the basis of previous literature studies. Koronaki et al. 28 report that, for separated flows, among the two-equation turbulence models, the k–ε RNG is the one which performs best when coupled with non-equilibrium wall functions.
A block-structured mesh of about 4.1 million cells was used to discretize the domain. In the section normal to the flow, the grid consisted of 87 × 87 uniformly distributed cells. Along the flow direction, 255 and 258 cells were set upstream and downstream the plate, respectively, while the number of cells in the inner region was varied between 28 and 35 according to the thickness of the plate. A grid sensitivity study was made to choose the optimum discretization for the investigations. The tests were performed for the case of Plate C in Table 1 and Q = 15.1 L/s. The flow simulation was repeated employing five different grids in which the number of cells was increased from 0.5 to 9 million, and the effect of the number of cells upon the minimum compute pressure
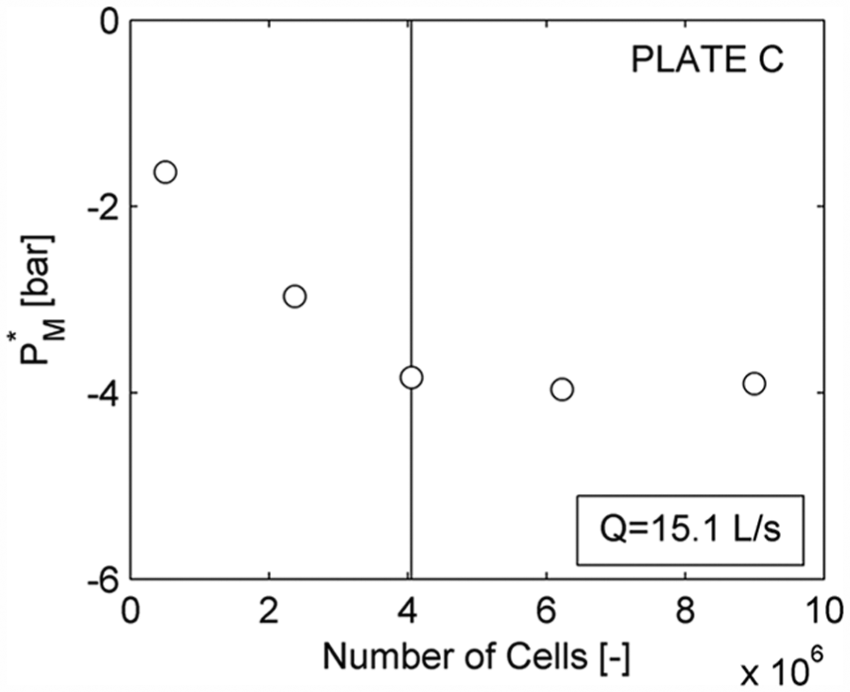
Grid independence study for the case of Plate C in Table 1 and Q equal to 15.1 L/s. Effect of mesh resolution on the minimum computed pressure
As a preliminary step, the good predictive capacity of the numerical model was checked with reference to the Euler number
Results
Before using the procedure described in section “The proposed method” to estimate the incipient cavitation index of the four orifices whose geometrical characteristics are reported in Table 1, we applied the generalized pressure criterion to check its capability to predict whether, under certain flow conditions, multi-hole orifices are subjected to cavitation or not, thereby extending the validation study which, in our earlier article,
16
was limited to single-hole orifices. However, we no longer made reference to the plot of the flow rate


The vapor pressure is
It has already been remarked that the addition of the constant value


The difference
Figure 7 shows the trend of SPL as a function of the cavitation index for the experimental data considered for comparison. Vertical lines representing the numerically derived values

Measured values of SPL as a function of the cavitation index
The new method for predicting the incipient cavitation index is now checked by comparison to the experimental data regarding all the four plates in Table 1. Since the incipient cavitation index
Application of the generalized pressure criterion to Plates A and B in Table 1 and different flow rates.

The incipient cavitation index
For all plates, the estimated incipient cavitation index
Figure 8 reports the measured SPLs versus the cavitation index together with the predictions of incipient cavitation index obtained by averaging the values reported in Table 3, corresponding to different flow rates. The predictions of equation (4) show agreement with our experimental evidence. We emphasize that whilst a large number of experimental points are required (and may not be even sufficient) to estimate

Experimental data of sound pressure level as a function of the cavitation index
The method proposed in this article has been applied to several control valves of different types and geometrical characteristics and proved capable in providing reliable estimates of the incipient cavitation index also for these devices. As an example, we report here the results obtained for the control valve sketched in Figure 9, in which two perforated plates are inserted in the valve body. Particularly, Figure 10 shows the measured value of pipe wall acceleration (normalized with respect to its maximum value) versus the cavitation index σ at a valve opening angle of 40°. The data were collected in the test rig described in section “Experimental setup.” As in Figure 8, a vertical bar is used to indicate the estimates of the incipient cavitation index obtained by the proposed methodology, that is, by applying equation (4). The good agreement between estimates and experiments confirms the reliability of the proposed method also for cavitation in more complex geometries.
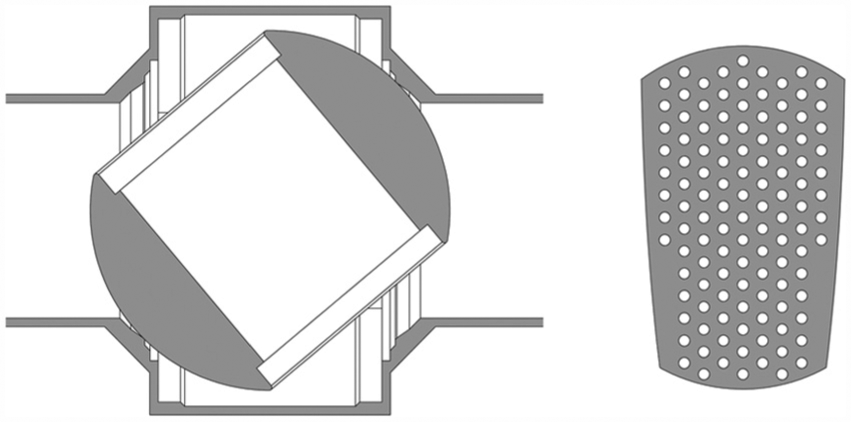
In the control valve considered in the application example, two perforated plates are inserted in the valve body.

Experimental data of pipe wall acceleration (normalized with respect to its maximum value) as a function of the cavitation index σ for the control valve at an opening angle of 40°, together with the incipient cavitation index estimate
Conclusion
In this work, a new method is proposed for predicting the incipient cavitation index—introduced in many technical standards1,6 as an indicator of the onset of cavitation—by means of CFD simulations. The method is based on the generalized pressure criterion that we developed and reported in an earlier article 16 in order to estimate whether, under certain flow conditions, a single-hole orifice is subjected to cavitation or not. The strength of the new method relies in its simplicity, as it allows estimating the incipient cavitation index from just one single-phase incompressible RANS simulation without performing any experimental test. This feature makes the proposed method very attractive for engineers, especially in view of its application to complex geometries that are very hard to investigate experimentally, above all in case of large-size systems.
The case of multi-hole orifices is considered in this article, referring to our own experimental data for comparison. After verifying that the sign of the difference between the minimum computed pressure and the vapor pressure is a suitable parameter to provide an estimation of the presence of cavitating conditions also in multi-hole orifices, extending to a more complex flow the results of our previous work, 16 the proposed method is employed for estimating the incipient cavitation index (equation (4)). Good agreement between predicted and measured values of the incipient cavitation index was obtained for multi-hole orifices with different geometrical characteristics as well as for more complex devices including different types of control valves, revealing the reliability of the method and its relevance for engineering purposes.
Footnotes
Appendix 1
Acknowledgements
The authors acknowledge the CINECA and the Regione Lombardia award under the LISA initiative, for the availability of high-performance computing resources and support. The authors would also like to acknowledge Pibiviesse S.r.l. for giving the possibility to perform the experimental tests in their test rig.
Academic Editor: Junwu Wang
Declaration of conflicting interests
The authors declare that there is no conflict of interest.
Funding
This research received no specific grant from any funding agency in the public, commercial, or not-for-profit sectors.