
Abstract
Selective laser melting (SLM) provides significant design freedom for hydraulic components, yet the inherent wall roughness from powder adhesion degrades fluid flow performance, an effect standard CFD models struggle to capture. This study presents a systematic framework to address this challenge by integrating experimental surface data into fluid dynamics simulations. A user-defined function (UDF) was developed in Fluent to translate experimentally measured 3D surface topographies of as-built TA15 titanium alloy into a non-uniform, equivalent sand-grain roughness model. This approach specifically accounts for stochastic, localized powder agglomerates. The feasibility of the UDF methodology was first verified against a benchmark case, confirming its capability to represent localized flow disturbances. When applied to a complex, self-supporting diamond-shaped channel, this data-driven model predicted a 55 Pa pressure loss increase (a 4.5% rise) and significantly intensified near-wall turbulence compared to a smooth-wall assumption. This work provides a methodologically verified and practical framework for more accurately predicting the hydraulic performance of as-built SLM components. It offers a critical tool for designers to anticipate and mitigate the impacts of surface roughness in next-generation, high-efficiency lightweight hydraulic systems.
Introduction
The hydraulic transmission technology is currently widely used in industrial applications. As a critical component of hydraulic systems, flow channel structures face limitations when manufactured using conventional methods, making it challenging to meet the growing demands for lightweight, compact, and high-efficiency hydraulic components. In recent years, additive manufacturing (AM) technology has advanced rapidly. Selective laser melting (SLM), as the most commonly used metal AM process, has found extensive applications in aerospace, medical, automotive, and industrial sectors. 1 Compared with traditional manufacturing, SLM overcomes the forming constraints of conventional methods and is not limited by design complexity. 2 This capability enables the fabrication of flow channels with arbitrary orientations and curvatures, making SLM particularly promising for next-generation hydraulic valve block design and production. The technology offers significant potential for achieving lightweight designs, improving overall system efficiency, and effectively reducing fluid energy losses. However, a primary drawback of the SLM process is the inherent surface roughness, which significantly exceeds that of conventionally machined components. This roughness primarily stems from the adhesion of partially melted powder particles to the component’s surface and the “stair-step” effect on inclined or curved surfaces. For internal channels in hydraulic systems, this elevated roughness can induce premature turbulence, increase frictional resistance, and consequently lead to higher pressure drops and reduced system efficiency. Therefore, understanding and accurately predicting the hydraulic impact of this as-built roughness is a critical challenge for the widespread adoption of SLM in high-performance fluidic applications.
Flow channel structures serve as critical components in functional fluid devices such as hydraulic valves and heat exchangers, prompting extensive research into their flow performance characteristics. Kumar et al. 3 conducted numerical simulations of fluid flow in pipes at varying velocities, concluding that frictional resistance dominates head loss in straight pipes while centrifugal forces primarily govern losses at bends. Chen et al. 4 developed a laminar flow model for rough microchannels using computational fluid dynamics (CFD), revealing that surface roughness induces near-wall vortices that increase pressure drop compared to smooth channels. Marchis 5 employed CFD to investigate the effects of regular and irregular roughness on logarithmic layer mean velocity profiles. The study observed that vortex structures within roughness cavities intensify with increasing roughness magnitude, causing the effective logarithmic region to shift toward the channel centerline. While average roughness height remains the most common parameter, Marchis demonstrated that it inadequately represents complete roughness geometry—both the height and length of roughness elements contribute significantly to energy dissipation. Li et al. 6 investigated the amplified roughness effects in high-aspect-ratio microchannels through CFD analysis. Their results demonstrated that: pressure drop per unit length increases linearly with Reynolds number at constant roughness height, and follows a quadratic relationship with roughness height at fixed Reynolds number. Lu et al. 7 systematically studied microchannels with randomly distributed roughness elements of five geometries (rectangular, arc-top, and triangular). Their CFD results showed that rough walls reduce near-wall velocities while increasing core flow velocities, with flow resistance growing dramatically with roughness height. Tan and Liu 8 performed detailed CFD analyses of microchannel flows with varying roughness element shapes, heights, and spacing. Their work identified that roughness elements induce flow separation and recirculation, resulting in: decreased velocities in near-wall regions, increased mainstream velocities, and pressure losses. Under identical height, width, and spacing conditions, rectangular elements exerted the strongest influence on flow characteristics, followed by arc-top and triangular elements (rectangular > arc-top > triangular).
In summary, wall roughness constitutes a critical factor influencing fluid flow characteristics. The frictional resistance in flow channels primarily stems from fluid viscosity, where wall-fluid interactions generate internal shear stresses—making wall roughness a direct determinant of flow behavior. However, current research on additively manufactured flow channels often examines process parameters and performance metrics in isolation. Shi 9 investigated the limiting dimensions of overhanging circular holes fabricated from AlSi10Mg powder, demonstrating that holes with diameters ≥1.5 mm remained fully open, though significant dimensional deviations occurred for 12–16 mm diameters due to dross formation. Han et al. 10 compared supported versus unsupported circular holes, revealing that unsupported holes exhibited greater shape distortion, higher surface roughness, and more pronounced deviations at diameters >15 mm. Yang et al. 11 confirmed that SLM could successfully produce overhanging holes (≥0.5 mm) in 316L stainless steel, with geometric accuracy inversely proportional to diameter. Alshare et al. 12 optimized an SLM-fabricated hydraulic manifold via fluid-structure interaction (FSI) simulations, achieving 84% weight reduction and 25% pressure drop decrease. Dickman et al. 13 redesigned a complex hydraulic component using SLM, simultaneously reducing mass and improving flow performance. Xie et al. 14 employed topology optimization to minimize energy loss in SLM-printed valve blocks, reducing pressure losses by up to 71.38% and mass by 68.9%. Recognizing this challenge, a significant body of research has focused on mitigating SLM-induced roughness. As reviewed by Jiao et al., 15 these strategies often involve optimizing process parameters or applying post-processing techniques. For example, methods such as ultrasonic vibration-assisted finishing 16 and surface treatments like laser shock peening 17 have proven effective. However, these post-processing methods are often limited to external surfaces or simple, accessible internal geometries. For the complex, tortuous internal channels found in advanced hydraulic manifolds, such treatments are frequently impractical or infeasible. This limitation creates a critical need to accurately predict the hydraulic performance of components in their as-built state. Conventional CFD simulations typically approach this by applying a single, area-averaged roughness value (e.g. S a or R a ) to the channel walls. While simple, this approach fails to capture the stochastic and localized nature of SLM roughness, particularly the large, adhered powder agglomerates that can disproportionately affect the flow field. Therefore, the primary contribution of this work is not to propose a new post-processing technique, but to establish a practical methodological framework that bridges the gap between experimentally measured 3D surface topography and a computationally feasible, non-uniform boundary condition for CFD analysis. This is achieved through a custom user-defined function (UDF) designed to represent the wall roughness with much higher fidelity than conventional methods.
However, a critical gap persists in literature: previous studies either rely on simplified, uniform roughness parameters (e.g. average R a or S a ) which fail to represent the localized nature of powder adhesion, or they attempt full-scale explicit modeling, which is computationally prohibitive for complex channels. This leads to inaccurate predictions of pressure loss and turbulent behavior, hindering the effective design of high-performance AM hydraulic components. To bridge this gap, this paper aims to achieve the following objectives:
Systematically characterize the 3D roughness morphology of SLM-fabricated TA15 surfaces at various overhang angles.
Develop and propose an equivalent sand-grain model, implemented via a UDF, that accurately captures both the background roughness and the stochastic, localized powder agglomerates.
Validate the proposed model’s effectiveness in predicting localized flow disturbances and pressure losses.
Apply the validated methodology to a complex, self-supporting channel to quantify the precise hydraulic penalty induced by as-printed surface roughness.
Shaped surface roughness measurement of overhang structures
Measurement objective
In traditional machining, surface roughness primarily results from friction between the cutting tool and workpiece, as well as high-frequency vibrations of the equipment. In contrast, for selective laser melting (SLM), parts are typically categorized into distinct surface types: top surfaces, side surfaces (including vertical side faces, up surfaces, and down surfaces), and bottom surfaces, as illustrated in Figure 1.

Surface classification.
The formation mechanisms of surface roughness vary across different part orientations: the top surface roughness primarily results from molten pool spattering during laser scanning and the deposition of airborne powder particles transported by shielding gas flow within the build chamber 18 ; the side surface roughness stems from the “stair-step effect” caused by layered powder deposition combined with thermal-induced powder adhesion, where peripheral laser energy partially melts powder beyond the focal spot, forming sintered particle attachments (dross formation) 19 as illustrated in Figure 2; while the bottom surface roughness, being the interface between the part and substrate plate, is solely determined by the part separation method from the build plate and remains independent of the printing process.
“Step” effect and surface sticky powder phenomenon.
Material and SLM process
The specimens for this study were fabricated using a Solution SLM 280 additive manufacturing system, as shown in Figure 3. The material used was gas-atomized TA15 titanium alloy powder, characterized by a particle size range of 25–63 µm. The powder exhibited high sphericity and a uniform particle size distribution, ensuring good flowability. The chemical composition, in weight percentage (wt.%), is presented in Table 1.
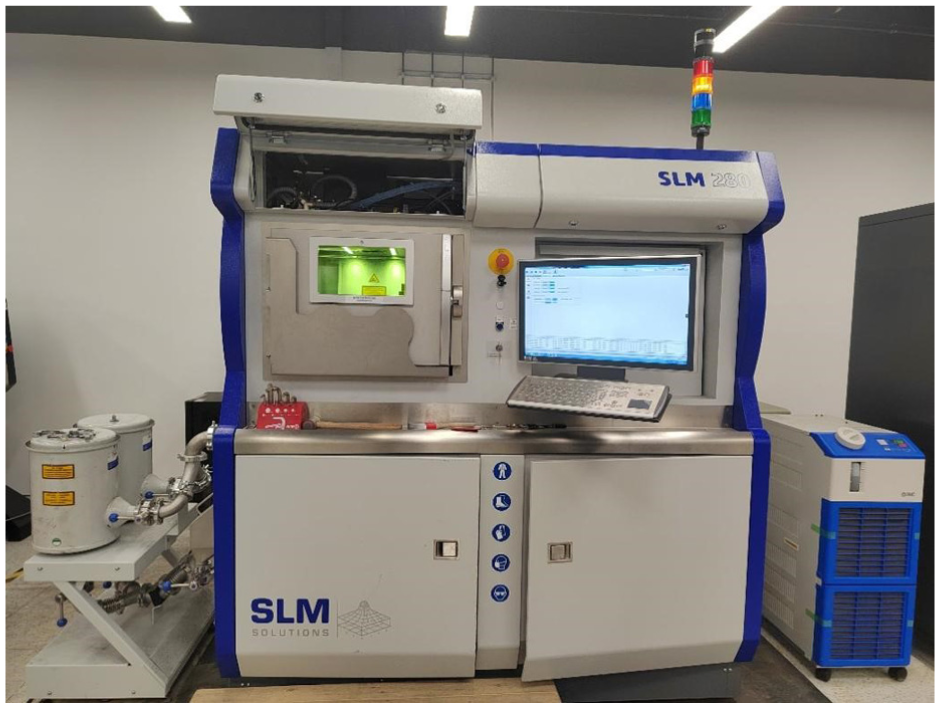
Solution SLM 280.
Chemical composition of TA15.

The test specimens featuring six different overhang angles (25, 35, 45, 55, 65, and 75) designed in the process qualification block, as shown in Figure 4, using the key process parameters: a powder layer thickness of 0.04 mm, laser power of 200 W, scan speed of 1000 mm/s, and hatch spacing of 0.12 mm, after which the surface roughness of both the upper and lower surfaces of each specimen was measured.

Overhanging block.
Measurement methodology
In general industrial machining, the surface roughness of components is typically evaluated using the R a parameter (arithmetic average roughness), which represents the arithmetic mean of absolute deviations of the roughness profile from its mean line over a specified sampling length L, where the sampling length must encompass at least five consecutive peaks and valleys, 20 with the mean line defined as the reference line that follows the general shape of the roughness profile and divides it such that the areas above and below the line are equal, 21 as illustrated in Figure 5 and calculated by equation (1).

It can be observed that while the aforementioned two-dimensional roughness evaluation method describes the relationship between the heights (depths) of surface peaks (valleys) and their spacing, it only reflects the profile characteristics along a single linear direction, which may result in surfaces with significantly different three-dimensional topographies exhibiting identical R a values; consequently, this two-dimensional assessment approach is relatively limited and provides incomplete surface characterization with substantial constraints,22,23 particularly for selective laser melting (SLM)-fabricated part surfaces where randomly adhered metal powder particles and occasional large powder agglomerates can severely disrupt fluid flow, making three-dimensional roughness characterization far more valuable than profile measurements for accurate surface feature quantification; this study therefore employs a laser confocal microscope (Zeiss LSM900) equipped with specialized surface analysis software (Confomap) to perform comprehensive three-dimensional roughness morphology measurements.

Roughness average.
Measurement results
The surface roughness measurement results for the upper and lower surfaces are presented in Tables 2 and 3, respectively, revealing that for any given overhang specimen, the S a values of the upper surfaces were consistently lower than those of the corresponding lower surfaces, which can be attributed to the distinct powder adhesion mechanisms during printing: while the upper surfaces only accumulated partially sintered powder particles from the current layer due to thermal conduction effects, the lower surfaces exhibited additional powder adhesion from both the current and subsequent layers through similar thermal processes; both S a and S z parameters for the upper surfaces initially increased with overhang angles from 25 to 45 (peaking at 22.91 μm for S a and 320.5 μm for S z at 45) before decreasing at higher angles, whereas the lower surfaces showed a continuous decrease in both S a (from 40.18 μm at 25 to 16.22 μm at 75) and S z (from 698.8 to 188.6 μm) with increasing angles; although the “stair-step” effect would theoretically predict increasing roughness with decreasing angles for both surfaces, the observed reverse trend on upper surfaces suggests that powder adhesion density, rather than layer artifacts, dominates the final roughness characteristics.
Up skin roughness of overhanging block.

Down skin roughness of overhanging block.

The three-dimensional surface topographies of the overhang specimens at various angles are presented in Figures 6 and 7, clearly demonstrating that both upper and lower surfaces exhibit randomly distributed clusters of aggregated powder particles, where the localized accumulation creates significant surface undulations around these clusters; this phenomenon results in surfaces with identical S a values displaying fundamentally different roughness morphologies, highlighting the critical limitation of conventional roughness parameters and underscoring the necessity for developing alternative characterization methods that can adequately capture these three-dimensional topographic variations.

Three-dimensional up skin roughness of each overhanging block at varying overhang angles: (a) 25°, (b) 35°, (c) 45°, (d) 55°, (e) 65°, and (f) 75°.

Three-dimensional down skin roughness of each overhanging block at varying overhang angles: (a) 25°, (b) 35°, (c) 45°, (d) 55°, (e) 65°, and (f) 75°.
Effect of powder adhesion on fluid flow characteristics
Mesh definition methods for surface roughness
For the aforementioned research demonstrates that printed components exhibit surface powder adhesion with randomly distributed particle agglomerates, and since the internal surfaces of complex-shaped flow channels can be considered as a combination of these printed upper and lower surfaces, directly incorporating S a values into fluid flow calculations would be technically unsound, necessitating a dedicated investigation into the effects of powder adhesion phenomena on fluid dynamics; current studies primarily adopt two approaches for defining wall roughness in fluid flow simulations:
1. The conventional approach of treating roughness values as boundary conditions in simulation software, where roughness is introduced through predefined input parameters, can only assign fixed or linearly varying roughness values to wall surfaces, lacking the capability for localized roughness characterization in specific regions, thereby rendering it fundamentally unsuitable for accurately representing the wall roughness characteristics of selective laser melted (SLM) flow channels.
2. The alternative method of explicitly modeling roughness as physical features on the channel wall surfaces, where geometric protrusions directly replicate the roughness morphology to enable intrinsic roughness representation in flow simulations, is predominantly employed in two-dimensional fluid analyses; however, when applied to characterize the wall roughness of selective laser melted (SLM) flow channels, this approach would require an exponential increase in mesh density, resulting in prohibitive computational costs and impractical modeling efforts for three-dimensional simulations, thus rendering it equally unsuitable for accurate SLM roughness representation.
Fluent is a comprehensive general-purpose CFD software with extensive capabilities, yet it often falls short in addressing specialized and complex problems such as incorporating the powder adhesion characteristics of selective laser melting (SLM)-fabricated flow channel walls into simulations, necessitating functional extensions to the software; while Fluent allows roughness to be introduced into calculations through the “Roughness Height” parameter setting, its limitation to fixed or linearly variable values proves inadequate for accurately representing the roughness of SLM-produced flow channels, and since wall roughness constitutes a boundary condition in fluid flow computations, this constraint can be overcome by implementing customized roughness distributions via user-defined function (UDF).
Calculation method for surface powder adhesion
In Fluent, the surface roughness model is described using uniformly distributed sand grains on the surface. The diameter of these sand grains serves as the input value for roughness calculation, known as “Roughness Height.” This model simulates the impact of wall roughness on fluid flow by modifying the flow velocity near the wall. The calculation of the roughness model in Fluent is illustrated in Figure 8.

Roughness model in Fluent.
When configuring roughness parameters in Fluent, two key values must be specified: the “Roughness Height,” which represents the equivalent sand-grain diameter (K s ) in the roughness model, and the roughness constant “C s ,” typically set to 0.5 to indicate uniformly distributed roughness; consequently, it becomes necessary to convert the measured roughness values into corresponding sand-grain diameters before they can be properly incorporated into the calculations, where the three-dimensional roughness parameter S a is derived through a calculation method analogous to that used for two-dimensional R a values, with its computational formula expressed as:
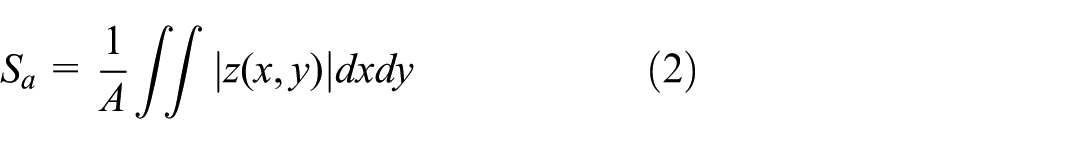
From the above equation, it can be observed that the S a value represents the ratio of the volume enclosed between the contour and the reference plane to the measured surface area, and assuming the roughness value for uniformly distributed sand grains is S a 1, the relationship between S a 1 and K s can be derived as:


where n represents the number of sand grains on the measured surface, and A denotes the measurement area (m2).
To approximate the phenomenon of surface powder adhesion, we model it as the presence of several large-sized sand grains within an otherwise uniformly distributed sand-grain roughness profile; by incorporating this powder adhesion effect into the roughness calculation, the modified roughness parameter can be expressed as: where this formulation accounts for both the baseline uniform roughness and the localized perturbations caused by adherent powder particles:

where N denotes the number of large-sized sand grains and R represents the radius of these large sand grains (m).
For typical titanium alloy printed components with post-processed powder removal exhibiting a base surface roughness of S a = 10 μm, when measuring an area of 1 mm2, equations (3) and (4) yield corresponding sand-grain parameters of K s = 20 μm and n = 2500; to model the powder adhesion phenomenon, a large sand-grain with R = 200 μm (N = 1) was introduced within the measurement area, and through equation (5), this configuration results in an effective roughness value of S a = 39 μm; subsequent recalculation using equation (3) with this modified S a value produces an equivalent uniformly distributed sand-grain height of K s = 75 μm that comprehensively captures both the baseline surface texture and powder adhesion effects.
Methodological verification of the UDF approach
To verify the proposed methodology for characterizing wall roughness in selective laser melted (SLM) flow channels, a square flow channel with 1 mm edge width and 100 mm length was established as the test subject (as shown in Figure 9), where the wall surface was discretized into 1 mm2 segments each containing one large sand-grain with R = 200 µm (totaling 400 such features distributed uniformly across the channel), with the central point of each segment assigned a localized roughness height of 400 µm while all remaining areas maintained a baseline roughness of 20 µm, and the corresponding user-defined function (UDF) code for implementing this discrete roughness distribution is as follows:
#include”udf.h” DEFINE_PROFILE(roughness,t,i) { real x[ND_ND]; real y; real z; face_t f; begin_f_loop(f,t) { F_CENTROID(x,f,t); y=x[1]; z=x[2]; a=x[0]; if((pow(a,2)+pow((y-0.0005),2)+pow((z-0.0005),2)<=0.000000004)) F_PROFILE(f,t,i)=0.0004; Else F_PROFILE(f,t,i)=0.00002; } end_f_loop(f,t) }
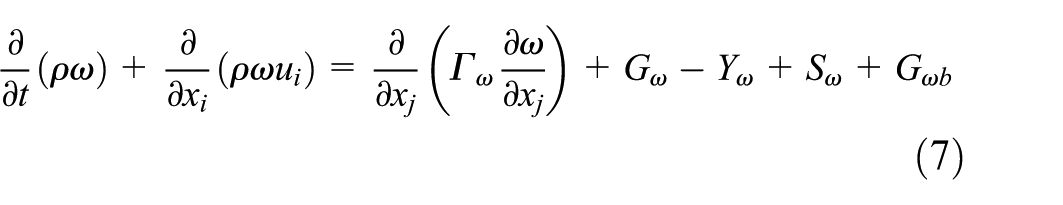
The square flow channel was subjected to numerical simulations under three distinct roughness configurations: uniform roughness heights of K s = 20 µm and K s = 75 µm, along with the UDF-specified discrete roughness distribution, using the k–ω shear stress transport (SST) turbulence model that preserves the original k–ω formulation in near-wall regions while employing the k–ε model in far-field domains, with explicit consideration of turbulent shear stresses for steady-state fluid flow analysis across various channel cross-sectional geometries, where the governing transport equations are expressed as:

where

Diagram of square flow channel.
Equations (6) and (7) sequentially comprise the transient term (for time-dependent problems), convection term (representing momentum/mass/energy transport by velocity), diffusion term (gradient-driven for gradient reduction), and source term (combining external contributions, pressure and gravity effects), while excluding the transient term, user-defined source terms, and buoyancy terms from the current model calculations.
The mesh type is tetrahedral with an element size of 0.04 mm. Five boundary layers are added with the first layer height set to 0.01 mm. The total number of mesh elements is 1.1 million. The solver parameters are detailed in Table 4.
Boundary conditions.

The verification cases for the UDF-based roughness calculation utilized 10 CPU cores. Since the outlet pressure was set to 0, the pressure at the inlet directly represents the pressure loss. Figure 9 compares the pressure losses for three different roughness heights. In the UDF implementation, large sand grains with a height of 400 µm were used to replace some of the smaller 20 µm sand grains; therefore, the pressure loss should be higher than that of the uniform 20 µm roughness case. The results in Figure 10 confirm this expectation, validating the feasibility of using UDFs to model surface powder adhesion. Additionally, the pressure loss predicted by the UDF model, which accounts for the actual roughness distribution, is ∼20 MPa lower than that of the equivalent 75 µm roughness height. This discrepancy highlights the limitations of using a single equivalent roughness height to characterize the surface roughness of selective laser melting (SLM) components. This benchmark comparison serves as a crucial methodological verification, confirming that our UDF implementation produces physically plausible results before its application to more complex geometries. It does not constitute a direct experimental validation, which remains a subject for future work.
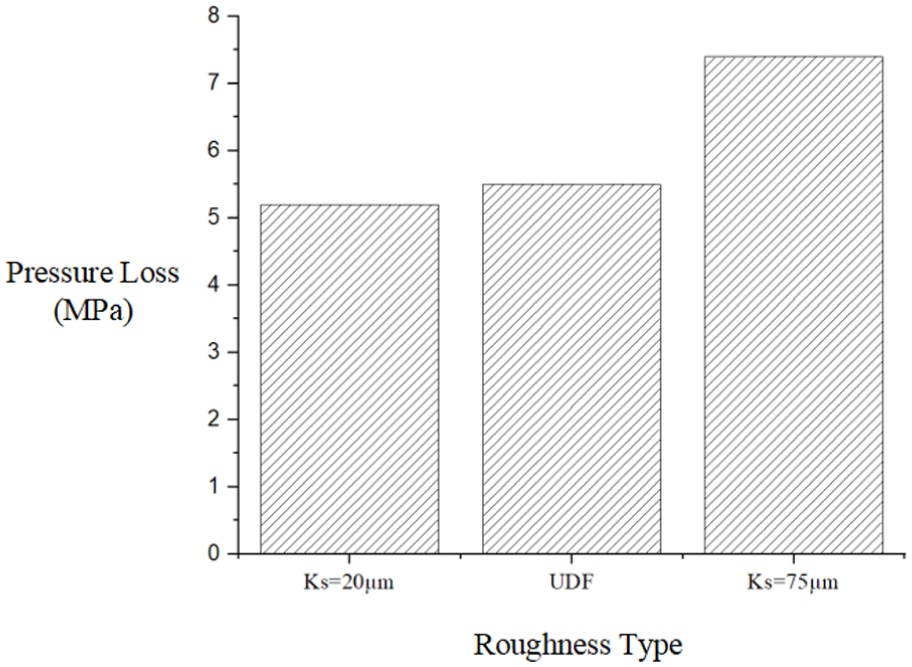
Comparison of pressure loss of three roughness heights.
The turbulent kinetic energy was selected as the key indicator to quantify turbulence intensity and evaluate wall roughness effects on fluid flow, with the analysis focusing on the wall surface at x = 0.5 mm in the square channel and examining the turbulent kinetic energy contour plots between y = 50 mm and y = 60 mm (as illustrated in Figure 11), where Figure 12 clearly demonstrates that in the UDF-implemented roughness model, each predefined 200 µm large sand-grain location generates a distinct circular zone of elevated turbulent kinetic energy compared to surrounding areas, thereby further validating the methodological feasibility while simultaneously revealing that substituting equivalent roughness height values fails to accurately capture the true flow characteristics in selective laser melted (SLM) channels.

Schematic showing observation positions (between black cross section).
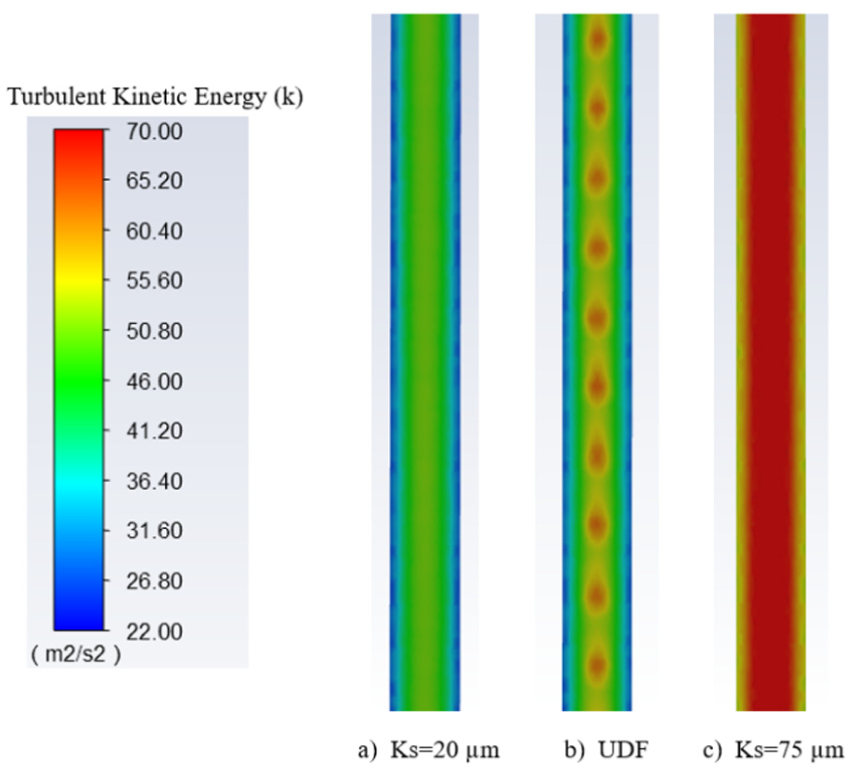
Cloud picture of turbulent kinetic energy under different roughness conditions: (a) Roughness height Ks = 20 μm, (b) UDF-based discrete roughness, and (c) Roughness height Ks = 75 μm.
Impact of powder adhesion phenomena on fluid flow in channel structures
Research subject
Following the validation of the UDF’s applicability and feasibility for roughness calculation in selective laser melted (SLM) flow channels, this methodology was subsequently implemented in functional flow channel structures to simulate realistic wall roughness distributions; based on previous work by Zhao et al. 24 involving self-supporting flow channel designs for one-inlet–four-outlet multi-channel structures where diamond and diamond-ellipse hybrid cross-sections with varying overhang angles were evaluated, the 65 diamond-shaped channel demonstrated optimal forming quality and was therefore selected as the representative case for this study’s fluid simulations incorporating as-printed roughness characteristics, thereby minimizing potential distortions from channel deformation in the computational analysis.
From Figure 13 illustrates the fluid domain division of the diamond-shaped 65 cross-section flow channel structure, where surfaces c and d of Branch Channel 1, surfaces g and h of Branch Channel 2, and surfaces k and l of Branch Channel 3 are designated as upper surfaces, while surfaces a and b of Branch Channel 1, surfaces e and f of Branch Channel 2, and surfaces i and j of Branch Channel 3 are defined as lower surfaces; under the assumption of one large sand-grain per 1 mm2 area, the outer channel surfaces a and c of Branch Channel 1 (total area: 71 mm2) incorporate 71 large sand-grains, the inner channel surfaces b and d (63 mm2) contain 63 sand-grains, all four surfaces e, f, g, and h of Branch Channel 2 (each 98 mm2) are assigned 98 sand-grains per surface, surfaces i and j of Branch Channel 3 (60 mm2) include 60 sand-grains, and the inner channel surfaces k and l (53 mm2) feature 63 large sand-grains to maintain consistent particle density across the flow network.

Flow domain division of diamond 65 section flow channel structure.
According to Table 2, the upper surface roughness values at a 65 overhang angle were measured as S a = 20.58 μm and S z = 210 μm, which were modeled by assigning one large sand-grain with radius R = 105 μm/1 mm2 area, allowing equations (3) to (5) to derive the background roughness parameters outside these large features as K s = 29 μm and S a = 15 μm; similarly, Table 3 shows the lower surface at 65 exhibited S a = 21.87 μm and S z = 259.5 μm, represented by one R = 125 μm sand-grain/1 mm2 that yielded peripheral roughness values of K s = 27 μm and S a = 14 μm through the same equations, with these comprehensive parameters—including both the quantity of large sand-grains per surface and their corresponding upper/lower surface roughness values—serving as the foundational inputs for UDF development to accurately simulate the as-printed surface conditions.
Impact of powder adhesion on fluid flow characteristics
During the fluid flow simulations, the main channel walls were configured with a baseline roughness of S a = 10 μm and K s = 20 μm, while the roughness distributions for surfaces a, b, c, d, e, f, g, h, i, j, k, and l were implemented through customized UDF programming; the computational mesh consisted of tetrahedral elements with a characteristic size of 0.04 mm, augmented by five boundary layers with an initial layer height of 0.01 mm, resulting in a total mesh count of 2.34 million elements, with the solution parameters detailed in Table 4 and the calculations performed utilizing 10 CPU cores for optimal computational efficiency.
Figure 14 presents the turbulent kinetic energy contour plots for different wall types in the diamond-shaped 65 cross-section flow channel structure, clearly demonstrating that rough walls exhibit significantly higher values compared to smooth walls, where abrupt variations in roughness height intensify turbulent fluctuations as Fluent’s wall-function adjustment for the logarithmic velocity profile accounts for reduced velocities in the rough-wall logarithmic layer relative to smooth walls, consequently increasing near-wall velocities—while maintaining constant cross-sectional flow rates—and thereby amplifying generation, which conclusively proves the substantial impact of wall roughness configuration on near-wall turbulence characteristics; furthermore, the pressure loss comparison in Figure 15 reveals a 55 Pa increase in pressure loss for rough surfaces versus smooth surfaces, quantitatively validating the hydraulic penalty induced by surface roughness.

Cloud picture of turbulent kinetic energy at each surface of fluid domain with different wall types of diamond 65 section flow channel structure.

Comparison of pressure loss with different wall types of diamond 65 section flow channel structure.
The predicted 55 Pa pressure increase for the rough channel, representing a 4.5% rise over the ideal smooth condition, quantitatively validates the significant hydraulic penalty induced by as-printed surfaces. This penalty, while seemingly modest in absolute terms, can become substantial in complex systems with long channel lengths or multiple bends, directly impacting overall system efficiency and power consumption. The underlying mechanism, clearly visualized in the turbulent kinetic energy plots (Figure 13), is the generation of localized micro-vortices and flow separation at the sites of large powder agglomerates. These structures disrupt the boundary layer and convert mean flow energy into turbulent dissipation, a phenomenon that traditional smooth-wall or uniform-roughness models would entirely miss. This finding underscores the necessity of employing realistic roughness models, such as the one proposed herein, during the design phase to avoid underestimating energy losses.
Conclusion
This study investigated the influence of as-built internal wall roughness in selective laser melting (SLM) flow channels on hydraulic performance. A methodological framework was established to integrate three-dimensional surface topography data, obtained from laser confocal microscopy of TA15 titanium alloy specimens, into computational fluid dynamics simulations. This was achieved via a customized user-defined function (UDF) in Fluent, which translates measured, non-uniform surface features into a localized, equivalent sand-grain roughness model. The key conclusions drawn from this work are as follows:
The surface roughness of SLM-fabricated TA15 components is highly dependent on orientation. Laser confocal microscopy revealed distinct trends for upper and lower surfaces with varying overhang angles (25–75). Upper surfaces showed an initial increase in roughness followed by a decrease, dominated by powder adhesion dynamics. In contrast, lower surfaces exhibited a consistent reduction in roughness with increasing angles, driven by the stair-step effect.
An equivalent sand-grain computational formulation was developed to quantitatively characterize the stochastic powder adhesion phenomenon. The feasibility of this UDF-based approach was verified using a benchmark square channel test case. The model successfully captured the localized flow disturbances and pressure loss increases induced by discrete powder clusters, confirming its physical plausibility and correct implementation before application to complex geometries.
The verified methodology was successfully applied to a self-supporting, 65 diamond-shaped flow channel. The data-driven roughness model predicted that the as-built surfaces significantly intensify near-wall turbulence and increase the overall pressure loss by 55 Pa. While a modest absolute value, this represents a significant 4.5% relative increase compared to an ideal smooth-wall model, highlighting a hydraulic penalty that could become substantial in longer or more complex hydraulic systems.
Limitations and future work
While this study provides a robust framework, certain limitations should be acknowledged to guide future research. The current model simplifies the complex geometry of powder agglomerates as uniform spheres. This is a first-order approximation necessary for computational tractability, but it does not capture the full range of particle shapes, sizes, and clustering present on a real surface.
To build upon this work, several avenues for future research are proposed. First and most critically, direct experimental validation of the pressure loss and flow fields in the as-printed diamond-shaped channel is required. This could be achieved using differential pressure sensors and flow visualization techniques like particle image velocimetry (PIV) to fully confirm the quantitative accuracy of the simulation predictions. Second, future work should focus on developing more sophisticated, statistically-driven roughness models that incorporate non-spherical particle shapes and size distributions. Ultimately, integrating this experimentally validated CFD methodology into topology optimization algorithms could enable the automated design of truly performance-optimized, as-printed hydraulic components.
Footnotes
Handling Editor: Divyam Semwal
Funding
The author disclosed receipt of the following financial support for the research, authorship, and/or publication of this article: PI start-up fund funding of ShanghaiTech University; Innovative cross-team project funding of Chinese Academy of Sciences (JCTD-2020-10).
Declaration of conflicting interests
The author declared no potential conflicts of interest with respect to the research, authorship, and/or publication of this article.