
Abstract
To improve machining quality and processing efficiency, the Taguchi analysis method is employed to design the milling tests of titanium alloy TC17. According to results based on the signal-to-noise ratio method, the cutting depth plays a critical role in improving the surface roughness and tool wear. The grey correlation analysis is a multi-objective optimization method that can help to acquire process parameters combination of the optimal surface roughness and the optimal tool wear. Finally, the correctness of multi-objective optimization results is verified through comparison experiments. The research results can provide process guidance and data reference for the actual production processing.
Introduction
Titanium alloy is widely used in the main structure and main bearing components of weapon equipment because of its good mechanical, physical properties and stable chemical properties. The count shows that the proportion of titanium alloy parts in aircraft and aeroengine is about 35%.1,2 In the process of machining, it is easy to appear unstable phenomena of the cutting process such as chatter and elastic deformation under the dynamic change of cutting force and temperature field produced by different process conditions, which makes it difficult to predict and control the machined surface quality and tool life. 3 Therefore, it is the critical problem to be solved in machining that how to improve the processing quality of titanium alloy materials and extend the service life of cutting tools.
Many scholars have experimented on titanium alloy machining. Mersni et al. 4 took the surface roughness as the optimal objective, and used the Taguchi analysis method to find the combination of cutting parameters of Ti6Al4V. Chen and Zhang 5 had experimented with ultrasonic elliptical vibration turning of TC4 in ABAQUS software. The experiment result indicated that when the tool rake angle is more than 32, cutter life became weak after the increasingly improved cutting temperature and cutting force.
Using the orthogonal turning experiment of TC21 titanium alloy, Liying 6 established a mathematical model of surface roughness depending on the principle of the response surface, and obtained different groups high-speed turning parameters of TC21 titanium alloy in different surface roughness. For thin-walled end face milling, Bolar et al. 7 revealed the effects of tool and cutting parameters applying analysis of variance. Employing an artificial neural network algorithm, Kant and Sangwan 8 established an empirical prediction model of surface roughness and obtained it’s the optimal solution by the genetic algorithm. Vijay and Krishnaraj 9 pointed out that the cutting depth greatly affected the cutting force than other cutting parameters, and the feed mainly contributed to the surface roughness than others. Sathyamoorthy et al. 10 adopted the variance method to optimize the surface roughness of AM60 magnesium alloy milling. The feed rate was the most influential cutting parameter on the surface roughness, followed by the cutting depth and spindle speed. And a better surface roughness could be obtained with higher cutting speed, and lower feed rate and depth of cutting. Dikshit et al. 11 reported the independent and interaction effects of milling parameters on tangential and radial forces. Then the cutting force prediction model is developed by regression analysis, and the cutting parameters at the minimum cutting force were optimized by genetic algorithm. Ting 12 optimized the cutting allowance of each layer based on the change of the milling parameters and the deformation of the workpiece. Moreover, the similar optimization works were done by Jimeng 13 and Jiajun et al., 14 aiming at the minimum cutting force to calculate the milling speed, axial milling depth, radial milling width and feed of per tooth.
However, designers and manufacturers often expect several indicators to reach the best value at the same time in practical engineering applications. For example, It is the cost of parts processing, production efficiency, surface quality and tool life that expect to get to the highest. For the overall blade disk milling, Xinmin 15 proposed the multi-objective optimization problem of tool life and Cutting efficiency. The Cutting efficiency under optimization parameters was increased by 31.2% and the tool life was improved by 19.7%. Abbas et al. 16 used multi-objective optimization algorithms to optimize the TC4 cutting process The results showed that excellent material removal rate and surface roughness could be guaranteed using high cutting speed, and low cut depth and feed rate. Eskandar et al. 17 optimized the cutting parameters based on the genetic algorithm method. To receive the minimum deformation and the shortest processing time, Yang 18 optimized the process parameters based on the genetic algorithm in the finishing of TC4 titanium alloy thin-walled plates. Using the same method, Renwei 19 set the goal as tool flank wear rate and high-efficiency machining, and finally obtained the most suitable process parameters as vc = 1.67 m/s and f = 0.2 mmm/z. With the aim of minimum cutting force and maximum metal removal rate, the milling parameters were improved based on mathematical analysis software during the titanium alloy milling. 20 Studying the milling test of superalloy GH4698, Bianzhi et al. 21 used Taguchi method to explore the change rule of cutting force and temperature and so on. It acquired the most appropriate parameters that produce lower cutting force and temperature by grey correlation analysis method. Rongrong 22 transformed multi-objective optimization problem with the high efficiency, low cost and high profit into single objective optimization drawing support from weight coefficient, and used the method of artificial neural network to optimize process parameters. It can be seen from above mentioned that surface roughness, cutting force and machining efficiency are the main objects during the machining process, but the research on multi-objective optimization of surface quality and tool life is still relatively scarce. In the paper, the significance of the milling speed (vc), feed per tooth (f), cutting depth (ap) and milling width (ae) on surface roughness and tool wear was analyzed based on Taguchi analysis method. Besides, employing the grey correlation analysis method to settle multi-objective optimization problem, and the results can provide process guidance and data reference for ensuring the quality of the workpiece and improving the tool life.
Experiment conditions and project
TC17 titanium alloy is a kind of near β titanium alloy, its chemical components and mechanics characteristics are shown in Tables 1 and 2. 2 It is mainly used for aerospace engine disk with high strength and hardness. During machining process, the cutting force and temperature of are high, and the chip is easy to stick on the tool surface to directly cause the tool wear and damage.
Chemical components of TC17.

Mechanics characteristics of TC17.

The shape of the workpiece is shown in Figure 1 with the size of 40 mm×30 mm×20 mm. All experiments are carried out in a three-axis vertical machining centre, and its spindle speed range is 0–8000 r/min. The other chosen processing conditions are a solid carbide 4 z milling cutter with a diameter of Φ8 mm, down milling and emulsion cooling.

Milling workpiece.
Experiment project
In this experiment, four factors and three levels of the orthogonal experiment were selected in Table 3. However, one layer was removed with the same parameters to eliminate the influence of the previous process before processing each specimen. As described in Table 3, the selected parameters are milling speed (vc), feed per tooth (f), cutting depth (ap), milling width (ae). It is worth noted that a new tool is mounted after each group of parameters.
Experiment parameters and their levels.

Take the arithmetic mean deviation of contour ‘Ra’ as the evaluation parameter of the surface of the test piece, which is measured by the traditional TR240 surface roughness tester. The tool wear was detected by the scanning electron microscope. To reduce the measurement error, all results are averaged over three measurements.
Taguchi analysis method is a robust parameter optimization design method combining orthogonal test and signal-to-noise ratio technology. According to actual needs, the selected combination of controllable variable factor levels can reduce the system’s sensitivity to noise changes, thereby reducing system fluctuations.
According to the research target response requirements, the quality characteristics of the optimized objects are divided into smaller-the-better (minimize), the nominal-the-better (equalize) and the larger-the-better (maximize), 23 which is shown in equations (1)–(3), respectively. During processing, the small surface roughness and tool wear are expected. This situation is related to the smaller-the-better. 24


Where: S/N is the signal-to-noise ratio, yi is the test result, N is the number of tests,
During the milling, the friction and squeezing between the tool and the workpiece make the workpiece generates elastic and plastic deformation resistance, and heat generating in the processing area. Then the high-temperature results lead to the tool wears seriously, the machining accuracy and surface quality are improved, and tool life is reduced. According to actual engineering needs, the small cutting force and temperature during processing can help improve surface quality and tool wear. Therefore, the mean value and signal-to-noise ratio (S/N) of the surface roughness (Ra) and tool wear (VB) are calculated by equation (3), which means the lower the better. 24 All the results are in Table 4.
Experiment results and S/N of Ra and VB.

Taguchi analysis
Signal-to-noise ratio analysis
The signal-to-noise ratio analysis can determine the influence priority of various factors on the output results, and can also optimize single objective parameters. The difference of the S/N ratio of each parameter represents the fluctuation amplitude in the machining process. The larger the difference, the more significant effect on the result. The S/N responses at different factor levels are reported in Table 5. It can be seen that the most conspicuous sign of the Ra is ap, the second is the f, the third is the ae and the last is the v. While for the VB, the first is also the ap, followed by the f and the v, the end is the ae. The results can conclude that the cutting depth greatly affects the surface roughness and tool wear.
S/N response of Ra and VB at various factor levels.

In general, the larger the average S/N ratio of the parameter level, the more appropriate parameter is. According to the principle that the larger the more S/N ratio of each control factor, the better results. So the most optimal level of machining factors with the minimum Ra and VB can be achieved from Figure 2 Among them, the milling parameters combined with the best surface roughness is A3B1C1D1, that is, v = 140 m/min, ap = 0.8 mm, f = 0.04 mm/z, ae = 0.4 mm. Meanwhile, the processing parameters combination with the least tool wear is A2B1C1D2, that is, v = 120 m/min, ap = 0.8mm, f = 0.04 mm/z, ae = 1 mm.
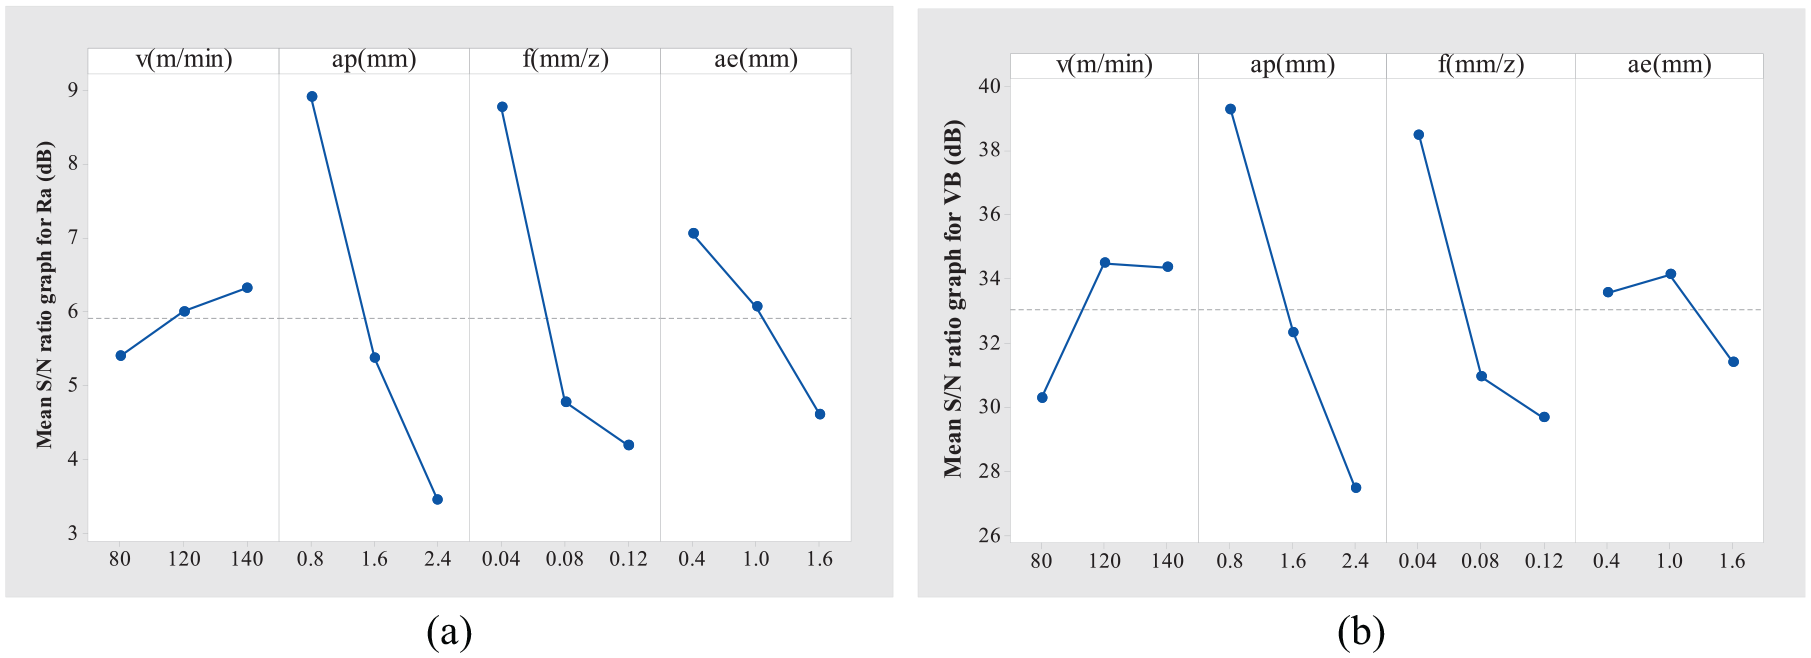
Mean of S/N ratio: (a) mean of S/N ratio for Ra and (b) mean of S/N ratio for VB.
Variance analysis (ANOVA)
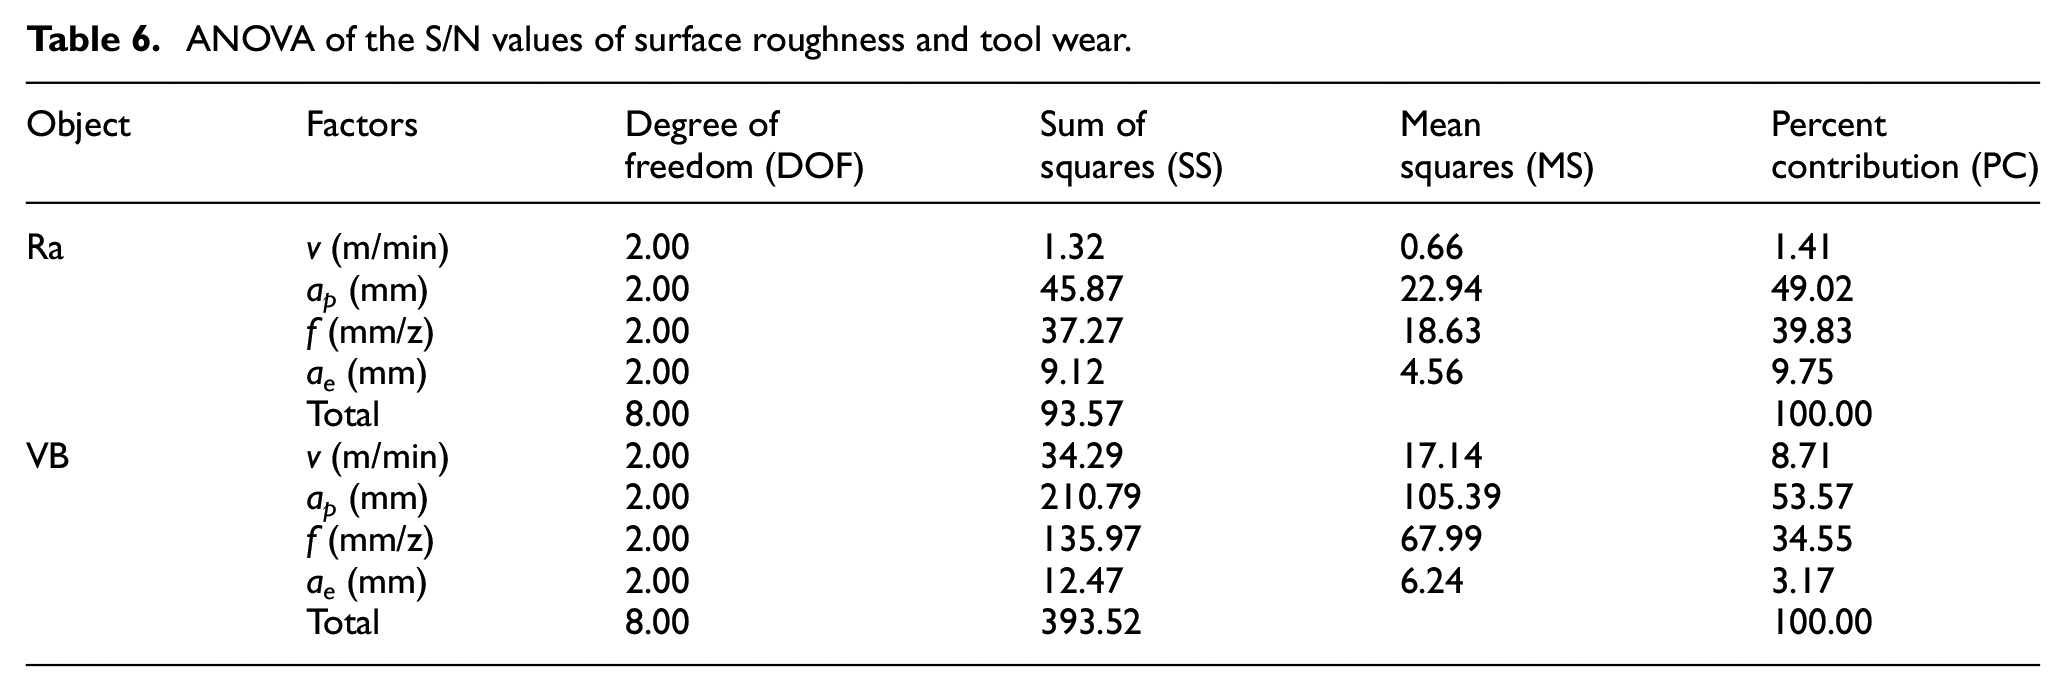
Analysis of variance method 25 is applied to determine the influence coefficient and contribution rate of cutting speed, cutting depth, feed rate and cutting width on surface roughness and tool wear. The analysis is conducted at 95% confidence level, and the calculation results are shown in Table 6. It can be concluded that the most significant factor on surface roughness and tool wear is cutting depth, and the contribution rate is 49% and 55%, respectively. The contribution rate of cutting speed to surface roughness is the smallest (1.41%), while the cutting width has the least effect on tool wear with 3.17 %.
ANOVA of the S/N values of surface roughness and tool wear.
Regression analysis
Regression analysis is used to effectively determine the effective relationship between input variables and output results, and to effectively predict the output performance. 26 In this paper, a regression relationship is established to realize the prediction of surface roughness and tool wear based on cutting speed, cutting depth, feed rate and cutting speed. The established prediction models are shown in equations (4) and (5). The correlation coefficient of the models is greater than 90%, which proves that the model is reliable. According to Figure 3, it can be seen that the predicted value is very close to the experimental value, which proves the usability of the prediction model again.


Comparison of the predicted values and experimental results for Ra and VB: (a) roughness comparison and (b) VB comparison.
Multi-objective optimization using grey relational analysis
The grey correlation analysis is used to optimize the cutting force and surface roughness all togethers. The basic steps are: performing dimensionless processing on the test results; analyzing the results of the dimensionless processing to obtain the grey correlation coefficient; solving the average grey correlation coefficient to obtain the grey correlation degree. 27
Firstly, equation (6) is used for dimensionless processing.

Where xi (k) is the tested result obtained by the i group test; i is the number of tested groups, and takes 1–9; k is the number of performance characteristic parameters output by each group of test, and takes 1–2. yi (k)results of dimensionless processing.
Secondly, equation (7) is employed to calculate grey correlation coefficient.
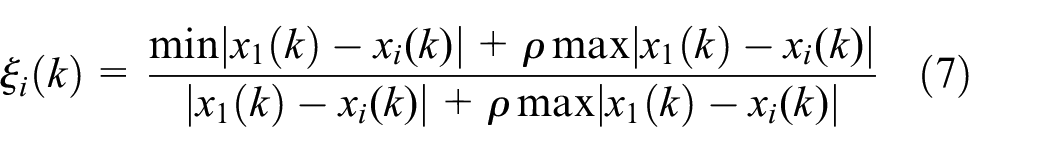
Where
Finally, the average value of the grey correlation coefficient is calculated to obtain the grey correlation degree, as seen equation (8).
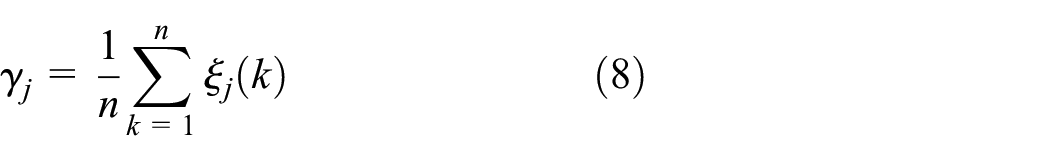
Where,
Grey correlation coefficient and grade are shown in Table 7 computed by equations (6)–(8). The results shown in Table 8 are obtained by calculating the grey correlation average of the factors and levels. It can be concluded that the most vital factor affecting the Ra and VB is the ap, followed by f, then the ae and the v. The higher the grey correlation degree, The better the multi-objective processing quality characteristics. Therefore, the combination of process parameters to obtain the best multi-target processing quality characteristics should be selected as A3B1C1D1 according to the grey correlation values depicted in Figure 4.
Grey relational coefficients and grades.

Response table for grey relational grade.


Grey relational grade.
Experimental validation
The accuracy of the optimization results is confirmed by machining experiments. It has been analyzed that the optimal combination of cutting parameters considering the Ra and VB is A3B1C1D1. Equation (9)26,27 is applied to calculate the grey relational grade at optimal milling parameters. The intermediate level parameter parameters and optimized parameters are selected for milling machining comparison, and the results are shown in Table 9. As it depicted, surface roughness (Ra) is reduced from 0.54 to 0.41 μm, and improved by 24%. The tool wear (VB) is dropped from 2.76E-2 to 2.52E-2 mm and decreased by 8.7%. The result of roughness improvement is twice as high as that of the reference. 28 It can be clearly deduced that the optimized processing parameters can significantly improve the surface quality and prolong the service life of the tool.

Where, σ t is the total mean of the grey relational grade, σ m is the mean of the grey relational grade at the optimal parameter, and n is the number of the machining parameter.
Comparison experiment results.

Conclusion
Based on the milling tests of titanium alloy TC17, the signal-to-noise ratio analysis method and the grey correlation analysis method were employed to acquire process parameters combination of the optimal surface roughness and the optimal tool wear, it can be concluded as follows:
Cutting depth plays the most significant effect on Ra and VB. The milling parameters combination with the best surface roughness is that v = 140 m/min, ap = 0.8 mm, ae = 0.4 mm, f = 0.04 mm/z. Meanwhile, the processing parameters combination with the lowest tool wear is that v = 120 m/min, ap = 0.8 mm, ae = 1 mm, f = 0.04 mm/z.
To achieve both the minimum cutting force and surface roughness, and the most appropriate process parameters is v = 140 m/min, ap = 0.8 mm, ae = 0.4 mm, f = 0.04 mm/z.
The suitable of multi-objective optimization is confirmed through experiment. The comparison proposes that it is effectively medium to solve the problem of parameter selection under multi-objectives in engineering practice.
Footnotes
Handling Editor: James Baldwin
Declaration of conflicting interests
The author(s) declared no potential conflicts of interest with respect to the research, authorship and/or publication of this article.
Funding
The author(s) disclosed receipt of the following financial support for the research, authorship and/or publication of this article: This research was supported by scientific research projects of Xi’an Aeronautical Polytechnic Institute in 2019 (NO.19XHZK-001, NO.19XHZK-007).