
Abstract
Glass fiber–reinforced plastics are extensively applied in engineering fields as a potential replacement to conventional steels, owing to its corrosive resistance property and high specific strength. But machining is complicated due to its anisotropic properties and non-homogeneous structure. In machining processes, minimum surface roughness and less tool wear are important factors influencing the quality of the surface, tool life, and productivity. Thus, the selection of tool and optimizing machining parameters are essential for perfect finishing. The tool used in this study is TiCN/TiN coated. The cutting parameters applied are cutting speed, feed, and depth of cut. As a dynamic approach, the multiple response optimization is carried out using grey relational analysis and desirability function analysis for simultaneous evaluation. These two methods are considered in optimization, as both are multiple criteria evaluation and not much complicated. Analysis of variance is employed to classify the significant parameters affecting the response.
Keywords
Introduction
In modern-day engineering, high demands are being placed on components made of fiber-reinforced plastics (FRP). Fiberglass composites are an economic alternative to stainless steel and other materials in highly corrosive industrial applications. Glass fiber–reinforced composite materials are used in various products including sporting goods, marine bodies, plastic pipes, storage containers, and construction works. Glass fiber–reinforced plastics (GFRP) are widely used in the transport industries. GFRP rods are generally manufactured by pultrusion process and it needs further machining for dimensional control. The machining of GFRP composites is dissimilar from conventional materials and it necessitates special considerations on wear resistance of the tool. Surface evenness plays an imperative role and is a factor of more importance in the assessment of machining accuracy. Surface unevenness of a product could affect its functional attributes, such as friction, wear, light reflection, transmission of heat, and capability for lubrication. In order to get fine surface finish and dimensional properties, it requires optimization techniques to find best possible cutting parameters and theoretical models for predictions. 1 The anisotropic property of fiber-reinforced composite could be brought into more efficient usage by organizing the machining parameters. This provides a wide range of choice for the manufacturers. For achieving the highest performance for specified requirements, it is necessary to find optimum parameters for machining composites and to select the appropriate parameter values. 2 Achieving an acceptable surface quality with conventional methods of machining has been found extremely difficult due to the anisotropic and heterogeneous nature of these materials. Excessive tool wear (TW) is prevalent and frequently induces fiber pullout and surface ply delamination in the component part. This limitation has provided both academic and industrial motivation for research on the application of traditional methods of machining to reinforced polymers. 3 There are many studies on the machining of GFRPs. Işık 4 obtained results on machining of the unidirectional glass fiber–reinforced composite (UD-GFRP) with cermet cutting tool and suggested optimum cutting parameters to obtain improved surface quality. Also, Palanikumar 5 took efforts and found optimum cutting parameters for reducing surface roughness (SR) using Taguchi’s method. It presents a simple and systematic approach toward optimizing design. Palanikumar and P Davim 6 formed a mathematical model to calculate the wear in tool used for machining glass fiber–reinforced composite by means of regression analysis, and to develop the model, analysis of variance (ANOVA) is applied. Naveen Sait et al. 7 performed turning experiments with K20 grade cemented carbide tool on filament wound GFRP pipes produced by hand layup process. It is based on L18 orthogonal array to present the influence of machining parameter.
Adam Khan and Senthil Kumar 8 were made an attempt to analyze the wear mechanism of alumina cutting tools while machining GFRP composite material prepared using a filament winding process. The machinability of GFRP by means of tools made of various materials and geometries was investigated experimentally by Lee 9 and revealed that proper selection of cutting tool material. S Kumar et al. 10 applied Taguchi method to find optimum process parameters for turning UD-GFRP rod using polycrystalline diamond (PCD) tool. G Meenu and S Kumar 11 developed a SR prediction model for the machining of UD-GFRP composite using regression modeling and optimization by simulated annealing and revealed that feed is the primary factor and has great influence on SR and then it is followed by cutting speed. They have also made an attempt to model the SR and material removal rate using principal component analysis to determine the influence of cutting parameters on UD-GFRP composite with PCD tool. 12 Chandrasekaran et al. 13 have applied grey relational analysis (GRA) for multi-response optimization of machining parameters for turning stainless steel. Kumar et al. 14 used Distance-Based Pareto Genetic Algorithm (DBPGA) approach to optimize tangential and feed force while turning UD-GFRP composite with various process parameters including feed rate, cutting speed, and depth of cut and investigated the influencing factor. NS Vyas et al. 15 investigated the influence of drilling parameters, such as cutting speed, feed, and point angle on delamination, thrust force, and circularity produced when drilling GFRP composite as its application is getting increased.
From the earlier work done and literature, it shows that most of the researchers have done the experiments on filament winding GFRP pipes produced by hand layup process and machined with costly tools such as cubic boron nitride (CBN), PCD, cermet, and alumina cutting tools and gave attention on individual objective. Studying the level of performance in using the coated tools for turning GFRP rods and collective objectives to minimize SR and TW has got less attention. So, in this study of research, low-priced TiCN/TiN-coated tool has been used for turning pultruded GFRP rods in dry conditions. The experiments were intended based on Taguchi’s L27 orthogonal array, by predetermined cutting conditions. The considering parameters of cutting speed, feed, and depth of cut have been optimized with multiple responses using GRA and also using desirability function approach with an aim to reduce TW and SR. To identify the significant parameters affecting the response, ANOVA was applied.
Materials and methods
Materials
GFRP rods produced by pultrusion method, shown in Figure 1, are used in this study. The diameter and length of specimen are 40 and 280 mm, respectively, having an L/D ratio 7, which were used for the experiments. The work piece was turned for 90 mm in all the trials. The reinforced fiber in the rod is E-glass and resin is epoxy. The scanning electron microscope image of the cross-section of the composite is shown in Figure 2. The properties of composite rod samples used are shown in Table 1.

GFRP rod specimen.

Scanning electron microscope image of the composite.
Properties of GFRP material.

GFRP: glass fiber–reinforced plastics.
Tool material
Machining studies were carried out in turning operation of GFRP composite rod using chemical vapor deposition (CVD)-coated carbide tool of CERATIZIT make of grade CTC 2135 HC-M30 and the type SNMG 120408 EN-TMR. This tool was preferred due to its excellent toughness and wear resistance. The composition and coating specification of the tool material are shown in Table 2. The cutting tool geometry is shown in Figure 3.
Composition and coating specification of the tool material.

HV: Vickers hardness.

Cutting tool geometry.
GRA
GRA is a measurement technique in grey system theory that analyzes the degree of relation in a discrete sequence. GRA had been used for optimization of multiple response characteristics in machining metal matrix composite, and this method for the optimization of the multi-response problems is a very useful tool for converting multi-responses into single response problem. 16 The step-by-step procedure followed by Noorul Haq et al. 16 for converting multi-responses into single response problem is used for the analysis:
Step 1. Signal-to-noise (S/N) ratio for the corresponding responses is calculated from equation (1). This is applied in the parts where maximizing the quality characteristic of attention is sought. Here, the smaller-the-better-type problem is intended to minimize the distinctive factors

where n is the number of tests and yij is the response value observed in ith experiment at jth test.
Step 2. To reduce the variability and to avoid the results of adopting different units, yij is normalized as Zij (0 ≤ Zij ≤ 1) by the following formula. A proper value is subtracted from the values at same array to compose the value of the array approximate to 1. The sensitivity of the normalization process in the sequencing results has been analyzed, as the rank is affected by the process of normalization. Therefore, the S/N ratio value is adopted when normalizing data in GRA. Equation (2). shows the smaller-the-better characteristic

Step 3. For the normalized values of S/N ratio, grey relational coefficient is considered from equation (3)

where yo(k) is the reference sequence (yo(k) = 1, k = 1, 2, …, m); yj(k) is the specific comparison sequence;
Step 4. Grey relational grade is made by equation (4)

where
Desirability function analysis in the Taguchi method
Desirability function analysis (DFA) is one of the most extensively used methods for the optimization of multi-responses problems. DFA is used to change the multi-responses problems into single response problems. As a result, optimization of the complicated multi-response problems could be converted into optimization of a single response problem termed composite desirability. 17
Step 1. Individual desirability function (di) for the corresponding responses has to be determined. For the smaller-the-better, the desirability function can be expressed as in equation (5). The value of

where the ymin denotes the lower tolerance limit of
Step 2. The index of individual desirability for entire responses can be united to form a single value named composite desirability (dG) by equation (6)

where di represents the individual desirability property Yi, wi refers to the weight of the property, “Yi” in the composite desirability, and w is the summation of the individual weights.
Step 3. At last, the optimal parameter and its level of combinations are to be determined: The higher the composite desirability value, the better the product quality. Thus, based on the composite desirability (dG), the effects of parameter and the optimum level for each parameter are estimated.
Experimental details
The turning experiments on GFRP rods were conducted in dry cutting conditions on KIRLOSKAR-make TURNMASTER-35 center lathe with variable speed and feed drive and 2.2-kW spindle power DC motor. The turning operation was carried out using SNMG 120408 EN-TMR, CVD-coated carbide tool insert of grade CTC 2135. This tool was preferred due to its excellent toughness and wear resistance. KISTLER TYPE 9257B multi-component dynamometer, measuring cutting forces, was setup on the lathe. Figure 4 shows the experimental setup for turning GFRP rod using a lathe.

Experimental setup.
Measurements of SR were taken at least five times, and the mean value is recorded as the Ra value. The Mitutoy- make SR tester of model SJ 210 had been used to measure the SR as shown in Figure 5. The TW was measured using optical tool maker’s microscope as shown in Figure 6. The image of the TW after turning GFRP is shown in Figure 7.
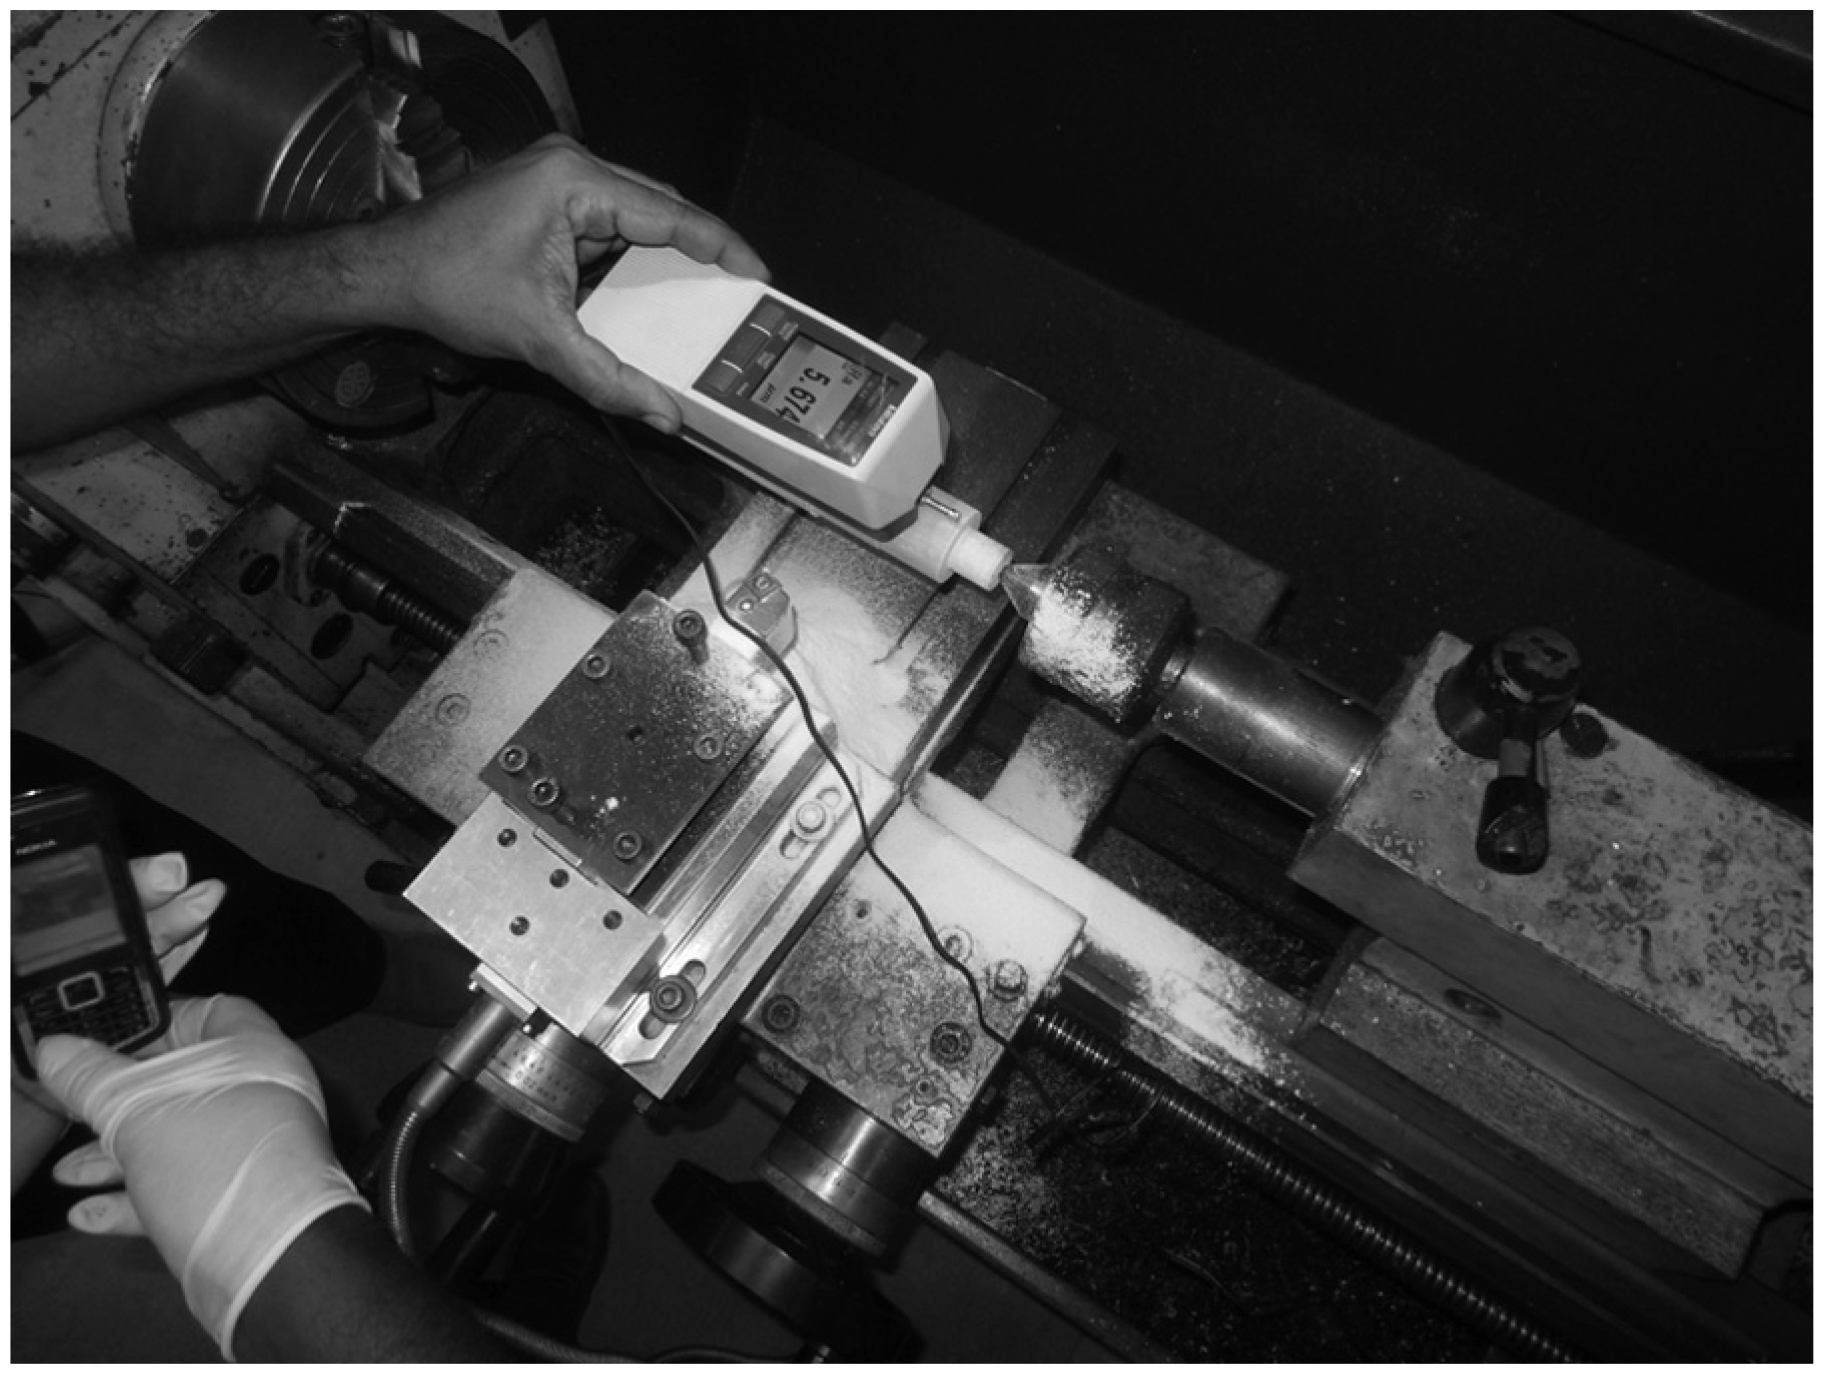
Surface roughness testing.

Tool wear measured using optical tool maker’s microscope.

Image of the tools after turning GFRP.
The most important cutting parameters affecting surface finish are cutting speed, feed, depth of cut, and wet and dry cutting conditions. The main objective of this study is to establish a relation among cutting speed, feed, and depth of cut responds on SR and TW. The range of cutting parameter values is chosen based on tool manufacture’s recommendation. In this study, three parameters set at three levels have been selected for experimentation. The turning parameters and their levels taken for both cases are presented in Table 3.
Machining parameters and levels.

Result and discussion
Multiple response optimizations for turning GFRP using GRA
The S/N ratio for SR and TW is computed using equation (1). Normalizing the S/N ratio values for SR and TW is computed using equation (2). Grey relational coefficient for the normalized S/N ratio values was calculated using equation (3), and the grey relational grade can be computed by equation (4). Finally, the grades were considered for optimizing the multi-response parameter design problem. The results are given in Table 4. The higher grey relational grade gives the better product quality and on its basis, the factor effect can be calculated and the optimal level for each controllable factor can be determined. The main effects are tabulated in Table 5, and considering maximization of grade values in Table 4, the optimal parameter conditions obtained are v1, f1, and a1. The cutting speed set as minimum level (50 m/min), the feed set as minimum level (0.08 mm/rev), and depth of cut was set to the maximum level (0.5 mm). The ANOVA of SR for machining GFRP is given in Table 6, and it clearly illustrates that the most significant factor that affects the SR with a p value of 0.002 is depth of cut and second by the feed with a p value of 0.126. The ANOVA for TW for turning GFRP is tabulated in Table 7, and it clearly illustrates that the depth of cut most significantly affects the TW with a p value of 0.000 followed by cutting speed with a p value of 0.022.
Grey relational analyses for GFRP.

GFRP: glass fiber–reinforced plastics; S/N: signal to noise; SR: surface roughness; TW: tool wear.
Main effects on grey grade for GFRP.

GFRP: glass fiber–reinforced plastics; Bold figures represent the higher value in the table.
Analysis of variance for SR.

SR: surface roughness; DF: degrees of freedom; SS: sum square; MS: mean square.
Analysis of variance for TW.

TW: tool wear; DF: degrees of freedom; SS: sum square; MS: mean square.
Multi-response optimization for turning GFRP using DFA
For every response, the individual desirability (di) is calculated depending upon the required quality characteristics. As all the responses are having minimization objective, the smaller-the-better-type equation is chosen. The calculated individual desirability for each quality characteristics with equation (5), is shown in Table 8. With equation (6), composite desirability values (dG) are calculated. Finally, these values are taken for optimization of multi-response parameter design problem. The results are shown in Table 9. Considering the minimization of composite desirability value, the optimal parameter condition is obtained as v3 f1 a1 for turning GFRP.
Individual desirability (di) and composite desirability (dG).

TW: tool wear; SR: surface roughness.
Parameters effects for composite desirability (dG).

Bold figures represent the higher value in the table.
Confirmation test
The objective of performing the confirmation test is to identify the selected machining parameters, which will make better results than the first part of the experiments. The confirmation experiments are used to confirm that the parameters and levels are chosen from an experiment. If the average of the results arrived in the confirmation test is within the range of confidence limits, then the appropriate levels and significant parameters for obtaining the desired results are properly chosen.
Confirmation test of SR and TW based on GRA
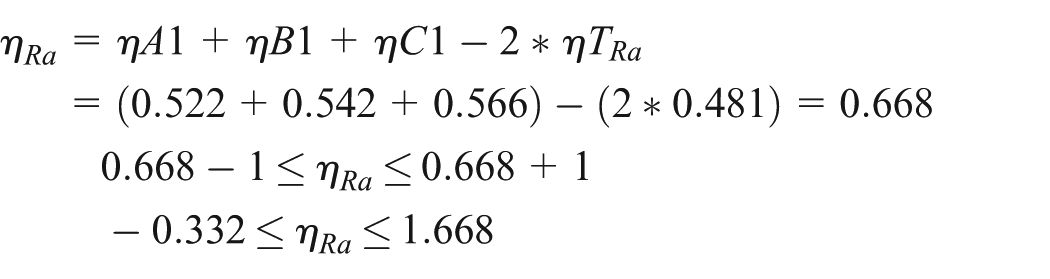
The optimal SR is predicted in the selected optimal setting of parameters, and A1B1C1 is the optimum parameter. The predictable mean at the optimum settings could be obtained from equation (7)

Equation (8) is referred for the prediction of mean in weighted grey relational grade of confirmation test

where
Confidence interval (CI) for the predictable results from the confirmation experiment is formed using equation (9)

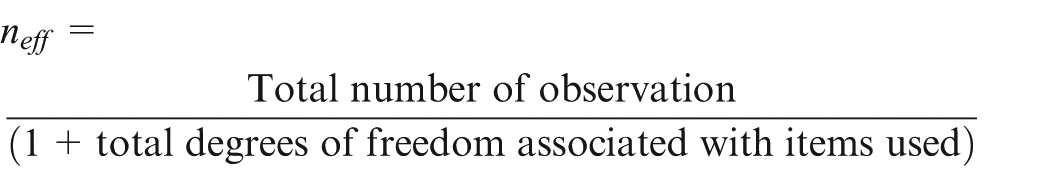
where Fα (1, fe) is the F ratio at a significant level of α%, α is the risk, fe be the error degrees of freedom, Ve is the error mean square, neff is the effective total number of tests, and R is the number of confirmation experiments

Therefore, the 95% CI must be given by


The confirmation test is conducted at the optimum settings to confirm the SR for turning. SR value found at the optimum setting of A1B1C1 is 2.942 and the corresponding grey relational grade is 0.78 dB. The result is obtained within the CI of the expected optimum performance characteristics.
The optimal TW is estimated at the selected optimal setting of parameters A1B1C1. The predictable mean at the optimum settings could be obtained from equation (12)

The expected mean of weighted grey relational grade on a confirmation experiment is as equation (13)

where ηTRa is grey relational grade overall mean of TW, and ηV1, ηF1, and ηD1 are the mean weighted grey relational grade corresponding to cutting speed v1, feed rate f1, and depth cut a1.
The CI for the expected results from the confirmation test is calculated using equation (14)

where Fα (1, fe) is the F ratio, at a significant level of α%, α is the risk, fe is the error degrees of freedom, Ve is the error mean square, neff is the effective total number of experiments, and R is the number of confirmation tests
Therefore, the 95% CI must be given by

The confirmation experiment is performed at the optimum settings to check the TW for turning. TW value found at the optimum setting of A1B1C1 is 0.01, and the corresponding grey relational grade is 0.78 dB. The result is obtained within the CI of the expected optimum performance characteristics.
Confirmation experiment for SR and TW based on DFA
The confirmation experiment is performed at the optimum settings to check the SR for turning. SR value found at the optimum setting of A3B1C1 is 2.342, and corresponding composite desirability is 0.943. The obtained result is within the CI of the expected optimum performance characteristics. TW value at the optimum setting of A3B1C1 was found as 0.025, and the corresponding composite desirability is 0.943. The obtained result is within the CI of the expected optimum performance characteristics.
Conclusion
This present investigation is focused on effective turning of GFRP using TiCN/TiN-coated tool with multi-response optimization of cutting parameters. From this study, using GRA, DFA, and ANOVA, the following results can be concluded:
From the results of using ANOVA, the significant cutting parameters affecting the SR is found as depth of cut followed by feed, and the significant cutting parameters affecting the TW is found as depth of cut followed by cutting speed.
Multi-response optimization using the GRA was performed for turning GFRP and found the optimum setting of cutting speed at 50 m/min, feed at 0.08 mm/rev, and depth of cut as 0.5 mm for minimization of SR and TW.
For the optimization of multi-response problems in turning GFRP, DFA is a very useful tool, and the optimal setting parameters for minimization of SR and TW are found as cutting speed set at 100 m/min, feed set at 0.08 mm/rev, and depth of cut set as 0.5 mm.
The most optimal among these two methods in this study could be found by equation (15)

where µa are µb are the predictable means of S/N value of SR and TW, respectively, at optimal condition of the used method. µc and µd are the predictable means of S/N value of SR and TW, respectively, at one normal condition and

where A, B, and C are the average S/N value at optimal speed, feed, and depth of cut, respectively, and T is the total average of S/N value. From this equation, the percentage of improved optimal condition to the normal one taken is 32.89% when using GRA and 17.42% when using DFA.
Footnotes
Academic Editor: Liyuan Sheng
Declaration of Conflicting Interests
The author(s) declared no potential conflicts of interest with respect to the research, authorship, and/or publication of this article.
Funding
The author(s) received no financial support for the research, authorship, and/or publication of this article.