
Abstract
To effectively predict the life of high voltage dc power relay, the authors design the structure of the relay to extending its life. The contact failure mechanism of relay products is analyzed by observing the appearance of several contact failures. The electromagnetic-thermal field coupling model is established and the state of heat flow and distribution of temperature increase between electrical and thermal coupling contacts are analyzed through simulations and experiments. An adaptive neural network control system is established to conduct sample training, obtain the best stiffness coefficient of the main spring, and optimize the design of the main spring structure composed of composite springs. The action voltage, release voltage, contact resistance, contact pressure, action time, and release time as characteristic parameters, and the relative error, correlation degree, variance ratio, and small error probability of each characteristic parameter, are calculated. The precision grade index of contact resistance and action time is defined as level 1. The two characteristic parameters are selected as the prediction variables to establish the life-prediction model based on gray theory. The relative error between the predicted and test life is 5.31%–5.6%, indicating that the life-prediction model has high accuracy. The test results show that the combined main spring structure can extend the life of a relay by 18.15%.
Keywords
Introduction
DC electromagnetic relays (high-voltage DC relays) with high current and voltage control in the range 450–750 Vd.c. are common in new-energy vehicles and charging equipment. As key components of new-energy vehicle motors and electronic control systems, they have attracted much attention from researchers, and their lifespan directly affects a vehicle’s safety and reliability. Owing to a variety of relays and specifications, performance index requirements vary greatly. The lives of different types of relays are highly discrete. The lifespan is affected by many factors, such as structural design dimensions, contact materials, performance parameters, and assembly process, leading to a difference in the number of relay lifetimes varies from thousands to tens of thousands.
There are many methods used to predict the life of a relay, such as starting from the analysis of degradation of multiple performance parameters that affect the life characteristic parameters, exploring the impact of multiple characteristic parameters, and establishing a life-prediction model with high accuracy and time-saving calculation. Chen 1 established an experimental high-voltage DC high-power relay to study the variation law of voltage and current of contact and magnetic blow strength in the process of life degradation. Li 2 determined the characterization parameters of electric life. An electric life-prediction model was established based on moving and static contact spacing, spring overpass pre-pressure, and blown magnetic field induction intensity. Wang et al. 3 used time-series analysis and a wavelet transform to measure parameter pre-processing methods to establish a storage life-prediction model for electromagnetic relays. The prediction model considered the effects of environmental temperature and stress, and required a large number of group test experiments. Liang et al. 4 used an entropy weight method and gray correlation analysis to optimize the key parameters that affect the life of electromagnetic relays. Through dynamic characteristic simulation, the contact breaking speed was hoisted, the contact collision speed was reduced, and the relay electrical life was improved. Li et al. 5 developed a dynamic contact resistance tester to analyze the change of contact resistance with increasing time and operation time. A fault occurred when the contact voltage exceeded the set threshold. Li 6 set up a life test bench of a testing relay to test the reliability and stability of a test system, which was a beneficial supplement to the traditional measuring instrument. Sun et al. 7 and Xu 8 considered the factors affecting the life of safety relays such as contact resistance and pull-in time as failure characteristic parameters, and adopted principal component analysis to realize the sensitive treatment of the parameters. Thus, it was feasible to establish the life-prediction model. Wang 9 determined the key characteristic parameters of the electromagnetic relay degradation process. Reliability and life-prediction models based on stochastic theory were established. This predictive model was applicable to a specified relay range. Many scholars start by studying the different design parameters of relays, delve into their failure mechanisms, and improve the accuracy of life-prediction models. Liu et al. 10 studied the failure mechanism of contact failure of relay contacts, and it was clear that an excessive contact gap and an unstable contact resistance were the main causes of failure. The contact pressure was increased and contact surface and other methods selected to reduce the stable contact resistance. Zhao et al. 11 proposed a residual storage life-prediction method of an electromagnetic relay and verified the validity and accuracy of the model. Fu 12 applied fault tree analysis to the fault of a railway signal relay, summarized the main fault modes based on the actual situation, and established a virtual prototype model of a relay to obtain its effectiveness. Zhou et al. 13 adopted fault tree analysis to define fault characteristic variables, establish a relay life model, and verify its effectiveness. According to finite element analysis and experimental measurement, Bo et al. 14 established the relationship among Holm force, ampere force, and contact pressure, and increased the contact force between contacts and the length of a moving conductive rod to suppress contact repulsion to a certain extent. The results showed that product life can be improved through mechanical parameters and by reducing the arc tension when the contact is broken. Qiao 15 proposed a numerical prediction method of fusion welding force and obtained the law of influence of different factors in the contact splitting process. Ye et al. 16 established a storage degradation model of the absorption time of a relay under high temperature, analyzed the reaction degradation caused by stress relaxation of a relay reed and the storage degradation of the absorption time, and predicted the storage life of a relay. Truong and Kahn 17 improved the gray theory method to improve the life accuracy of the predicted relay. Li et al. 18 used rough set theory to extract a set of performance parameters related to life and establish life decision rules. This method was suitable for similar products, and the initial values of performance parameters needed to be measured. Li et al. 19 analyzed the failure mode and mechanism of a space electromagnetic relay under long-term storage conditions from the aspects of process and environmental impact factors. Ma 20 compared the effects of load conditions on the failure mechanism and modes of an aerospace relay and determined the predictive variables and failure thresholds under different failure modes. Luo et al. 21 studied the reliability test method of an automobile relay at high temperature, conducted a failure life test of some samples, and evaluated the failure mechanism. Shan 22 conducted life tests of relay contacts of different materials, analyzed the largest influencing factors, and established linear regression prediction model. Yang et al. 23 used the finite element method to establish an electromagnetic thermal coupling model considering the joint influence of heating and environmental temperature of an electromagnetic mechanism and calculated the thermal stability temperature. Lin and Xu 24 calculated the stable temperature of a solenoid valve by means of electromagnetic thermal coupling and verified the effectiveness of the model. The influence of structural parameters on the temperature distribution of a solenoid valve was analyzed. It was concluded that optimized structure parameters can change the temperature distribution trend.
There are similarities and differences in scholarly research methods. Research may examine the influence of a single parameter or multiple parameters, and it may consider single or multiple physical fields. The factors considered in the life-prediction model are more comprehensive and closer to the actual application of electrical products. The constraints between the influencing factors are analyzed, the main influencing factors are extracted, and the life-prediction model is established to improve the prediction accuracy. The scholars referenced above were concerned about the influence of certain characteristic parameters on relay life after time-sequence degradation. There is no structural optimization to delay the time-sequence degradation of a characteristic parameter. There is less discussion on the mechanical reaction force degradation of the moving and static contacts during the suction and separation process. In this article the failure form of the contact is observed, its failure mechanism analyzed, the electromagnetic thermal coupling model of the relay established, simulation and experimental test results used to clearly identify the characteristic parameters that affect the life of a high-voltage DC relay, the main factors among them calculated, and the contacts formed by mechanical reaction forces studied. By using a neural network system to optimize the characteristics of the relay return force structure, successfully extends the relay life.
Analysis of contact failure mechanism
Contact failure mode
Observing a high-voltage DC high-power relay that fails during a test, it is concluded that there are many reasons for failure, such as loose damage to the coil, mechanical shaft stagnation, contact erosion, and poor contact. Figure 1 shows several types of relay contact failure. The failure rates of relays were determined, and the results show that more than 70% of the relay failures are due to contact failure; hence, the most vulnerable part of a relay is the contact, and its failure is mainly reflected in the failure of the contact.

Relay contact failure modes.
Figure 1(a) and (b) indicate that the metal material is transferred and peeled off between the contact surfaces of the dynamic and static contacts; Figure 1(c) and (d) indicate that arc ablation of the dynamic and static contacts presents a carbon black state, so that the surrounding plastic shells are covered by carbon; Figure 1(e) shows severe deformation of moving contacts; and Figure 1(f) shows different adhesive media on the surfaces of contacts.
Mathematical model of electromagnetic-thermal field coupling calculation
Figure 2 shows the basic structure of a certain type of high-voltage DC relay. When an external current signal is input to the relay coil, a magnetic field is generated around the coil and its shaft hole. The magnetically conductive parts (moving iron core and yoke plate) in the magnetized electromagnetic system will drive the push rod to push the moving reeds up together to complete the connection of the circuit.

Relay structure section diagram.
The dynamic characteristics of the electromagnetic system are mainly obtained by solving two closely related and mutually affecting problems: (a) the influence of electromagnetic parameters on the electromagnetic attraction force, and (b) the influence of the electromagnetic attraction and reaction force on the core movement parameters. These two problems can be solved, respectively, by the voltage balance equation and the D’Alembert equation of motion,

where
According to the theory of heat transfer, the heat generated by the contact resistance at the coils and contacts in the electromagnetic system after the high-voltage DC relay is closed can be transferred to the surrounding medium through conduction, convection, and radiation. However, for relay products, the effect of radiating heat to reduce temperature rise is small, and its effect can be ignored. The following assumptions are made: (a) the relay is in an infinite space, (b) the external heat dissipation of the relay is by natural convection, and (c) the ambient temperature in the boundary conditions is set to room temperature under the test conditions. According to the heat transfer principle, Wu 25 studied the main heat transfer mode inside an automobile relay and analyzed the heat field distribution inside it based on the mathematical model of the heat field,

where
Simulation analysis of magnetoelectric-thermal coupling field between contacts
The mechanism of the failure of a relay contact is illustrated by the test and analysis of its temperature change and the simulation results of the contact part. The ambient temperature of the contact directly affects the hardness index of the contact surface material. The lower the temperature, the greater the hardness of the contact surface, which is not good for contact performance, as the effective contact area is small and the contact resistance is large. When the temperature is higher than 55°C, the contact surface is liable to produce an oxide film, the contact resistance is large, an arc phenomenon occurs, and it is easy to accompany the material transfer between the contacts.
A three-dimensional model of the relay is established, non-essential geometric features processed, and a finite element model of electromagnetic-thermal field coupling analysis established. With the change of load current as the boundary condition, the integral multiple relationship of the rated current is generally selected to set the output. Figure 3 shows the changes in electric field strength of the static contacts with input current: Figure 3(a) when the input current is 300 A and the static contact maximum current strength is 2.7 V/m; Figure 3(b) when the input current is 450 A and the static contact maximum current strength is 4.05 V/m; Figure 3(c) when the input current is 800 A and the static contact maximum current strength is 5.68 V/m; Figure 3(d) when the input current is 900 A and the static contact maximum current strength is 6.39 V/m. The location of the maximum value is near the center of the static contact. Figure 4 is a vector diagram of the electric field strength at the contact load current of 300 A. Figure 4(a) shows the electric field strength vector distribution of the moving contact, and Figure 4(b) the electric field strength vector distribution of the static contact. The maximum current strength at the center of the contact is 2.7 V/m and the minimum current strength at the edge of the contact is close to 0 V/m. Figure 5 is the distribution cloud diagram of the contact temperature change with time when the load current is 300 A. Figure 5(a) shows the duration of the input 300 A current for 5 min, and the maximum temperature of the contact reaches 50.89°C. Figure 5(b) shows the duration of the input 300 A current for 10 min, and the maximum temperature of the contact reaches 70.23°C. Figure 5(c) shows the duration of the input 300 A current for 40 min, and the maximum temperature of the contact reaches 85.25°C. Figure 5(d) shows the duration of the input 300 A current for 60 min, and the maximum temperature of the contact reaches 86.69°C. With the extension of time, the contact temperature reaches a stable value.
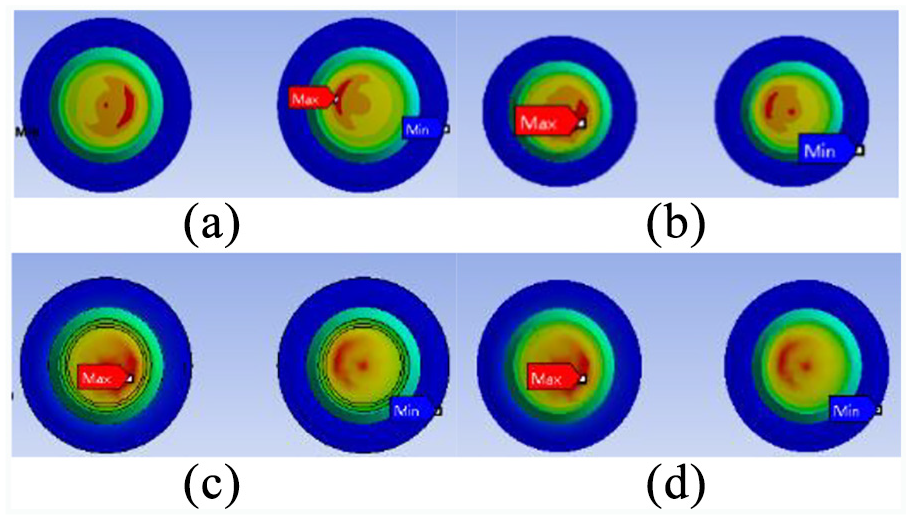
Electric field intensity of contact varying with load: (a) 300 A, (b) 450 A, (c) 800 A, and (d) 900 A.
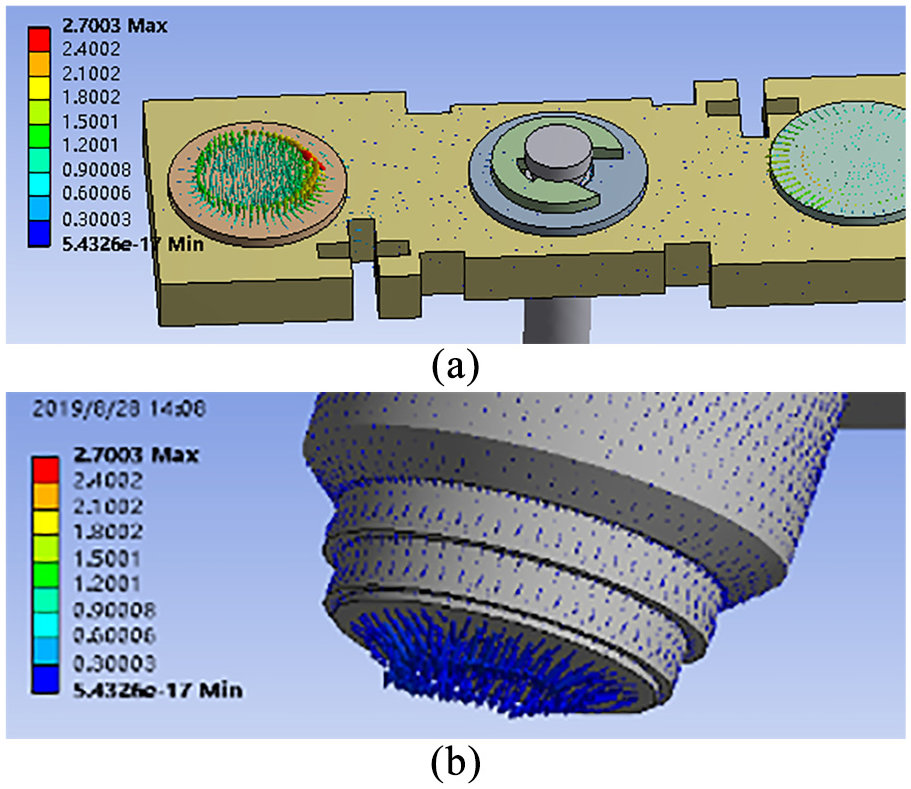
Contact electric field intensity vector at 300 A: (a) moving contact and (b) static contact.
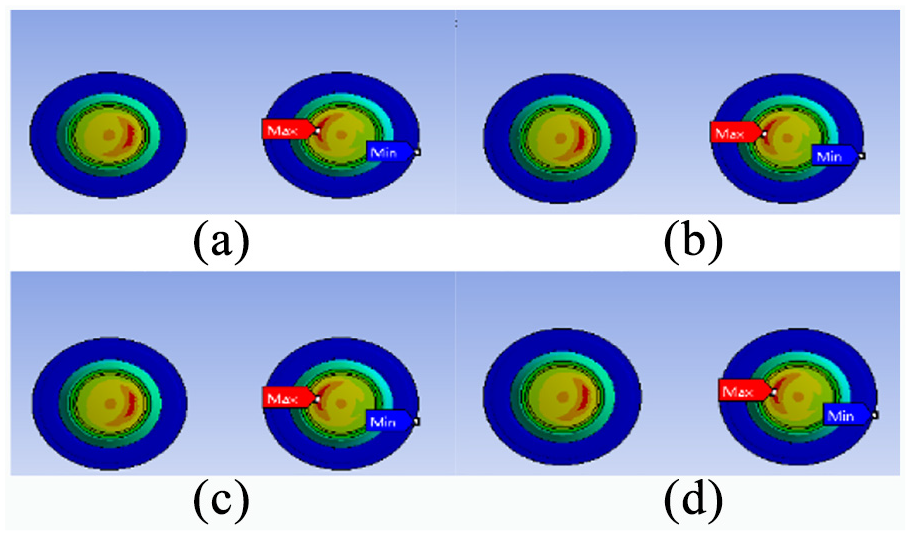
Distribution of time variation of contact temperature: (a) 5 min, (b) 10 min, (c) 40 min, and (d) 60 min.
Figure 6 shows a test curve of the contact temperature with time when the high-voltage DC relay passes a current of 300 A; the ambient temperatures are normal temperature and 50°C. To facilitate the comparison of simulation and test data, the simulation values of contact temperature changing with time in Figure 5 were extracted and plotted in Figure 6. The error of the simulation and experimental test results are within the allowable range. It can be seen from Figure 6 that both the simulation and test results show a nonlinear change trend with contact temperature. The ambient temperature affects the initial contact temperature. If the ambient temperature is 50°C, then the contact temperature begins to change from 50°C. If the ambient temperature is normal temperature, the contact temperature is under the action of 300 A current, and the time is within the first 5–10 min, the temperature of the contact increases rapidly. The temperature of the contact gradually increases over time. There is a small amount of fluctuation when the time reaches 50–60 min, the temperature tends to be stable at approximately 90°C, and the temperature limit of the relay material is 100°C, which does not exceed the limit value, which belongs to the safe range. The temperature of the contact is affected by its resistance and by the change of contact pull-in time and contact pressure. If the contact voltage reaches the breakdown voltage and a contact arc occurs, then the contact will be invalidated for a long time.

Contact temperature of 300 A current varying with time.
Contact failure mode and mechanism analysis
Complex physical, mechanical, optoelectronic, and thermal phenomena occur in high-voltage DC relay contacts. The coupled magneto electric-thermal field analysis of the above finite element model shows that as the load current increases the temperature of the contact and its vicinity rapidly increases, and may reach the softening and melting points of the material, causing deformation and relaxation of the contact area or welding and resulting in contact welding failure. The metal binding force between metal surfaces is close to that of soft metals and is less than that of hard metal. Soft metal contact materials are separated after melting and welding and are prone to material transfer, resulting in the failure of material transfer type contacts. Materials with higher hardness should be selected for contacts.
The characteristic parameters that affect contact failure are resistance, temperature, and voltage. Contact resistance includes shrinkage and film resistance. Contact resistance is difficult to quantify with a mathematical model and must be obtained through measurement. For high-voltage DC relays, when the contacts are separated and closed during operation the contact voltage will break through the air to generate an arc, and arc erosion causes the contact surface material to melt. The long-term multiple contact separation process causes the contact material to be transferred, resulting in contact failure.
A comprehensive analysis of the relay contact failure mechanism identifies a variety of factors. The increase in contact temperature, occurrence of arcing between contacts, and transfer of materials interact to jointly cause relay failure. Arcing between contacts and transfer of contact material should be the main cause of high-voltage relay contact failure. Owing to the effects of electric sparks and arcs on the contact surface, electrical wear or carbonization will occur on the contact surface. When mechanical and electrical wear occur, the material between the moving and static contacts will be missing, and a difference between the moving and static contacts will occur. This causes a large gap between the dynamic and static contacts, precluding completely good contact. The time series degradation of the initially formed magnetic attraction electromagnetic system is mainly reflected by the change of the coil enameled wire resistance, and the time series degradation of the spring system is mainly caused by the stress relaxation of the reed. The combination of these two results in the degradation of the closing time of the relay. Such a bad contact state will cause the contact resistance to increase, and the release voltage will decrease when the contact gap increases in this failure mode. Therefore, a spring system is required to increase contact pressure to ensure good contact.
Contact pressure calculations
Magnetic attraction and contact pressure
The relationship between the reduced value of the electromagnetic suction generated by the electromagnetic system at the air gap and the stroke of the push rod is called the magnetic suction characteristic. The relationship between the calculated value of the mechanical reaction force generated by the spring system at the contact gap and the stroke of the push rod is called the reaction force characteristic. The relay is closed when the magnetic suction force characteristic curve is higher than the mechanical reaction force characteristic curve, and otherwise it is released and separated. The characteristic curve of the magnetic attraction and reaction force of a typical relay is shown in Figure 7. Many factors affect the magnitude of magnetic attraction, including the coil’s current, voltage, power consumption, number of turns, and structural size. Figure 7 shows the changes in the magnetic suction characteristics of the coil suction current and the coil release current. When a stroke of the push rod reaches S1 = 1.2 mm, the magnetic suction of a suction current is over 40 N and that of a release current is over 30 N. The mechanical reaction force characteristics are composed of two segments of a broken line. The stroke of the push rod S is at the beginning, at S = 0 the moving contact begins to move upward, the 0–S1 segment refers to the stage from moving contact to static contact, and the contact gap is removed by 1.2 mm, The reaction force characteristics at this stage are mainly affected by the two return springs, and the compression deformation of the main spring is very small. The S1–S2 segment is the movement process after the moving contact touches the static contact; the stroke of push rod reaches S2 = 1.3 mm, the movement process is called the over-stroke phase. The mechanical reaction force at this stage reflects the combined effect of the main spring and return spring. At this time, the pressure state of the main spring increases and the two return springs. Under tension, the stiffness of the main spring is greater than that of the two return springs.

Magnetic suction and reaction characteristic curve of relay.
It can be seen that the mechanical reaction force formed by the spring system is calculated as the contact pressure at the contact gap. According to the design structure of the internal spring system of such high-voltage DC relays, the spring system is composed of a middle main spring and a return force spring on each side, and the installation position is shown in Figure 8. The relationship between the contact pressure, mechanical reaction force, and the two types of springs is shown in formula (3).


Installation position of main and return springs.
Table 1 shows the initial, final, and limit values of six characteristic parameters of the test samples. The characteristic parameters of the contact performance of the relay are operating voltage, release voltage, contact resistance, contact pressure, action time, and release time. According to the parameters of the test failure relay, the initial value of the contact resistance test is relatively stable, the test value of the sample is 0.18, and the test value after failure is 0.61, which is greater than the limit value of 0.6. The initial contact pressure is 14.4 N, and the test contact pressure after failure is 11.6 N, which is lower than the limit value of 12 N. In addition, measured the action time, release time, etc. have been extended. From the contact failure mechanism analyzed above, it is clear that the contact gap is increased, and because of the insufficient stiffness of the main spring the contact pressure is insufficient, the action time is prolonged, the contact resistance is increased, the contact arc is too large, and the relay eventually fails. How to obtain sufficient main spring stiffness after the interaction gap between mechanical and electrical loss increases, generate sufficient contact pressure to compensate for the performance loss due to timing degradation, optimize the design of the spring system to meet contact pressure requirements, keep the action time and contact pressure degradation delay, and prolong the relay life are analyzed below.
Characteristic parameter testing and qualification values.

Adaptive neural network algorithm
Many factors affect the contact pressure of the relay. Their interaction affects the complexity and accuracy of the calculation. With this consideration, an adaptive neural network algorithm is used to design the required main spring stiffness.
An artificial neural network simulates the thinking function of the human brain, with strong self-learning and association functions, less manual intervention, higher accuracy, and good use of expert knowledge. A fuzzy neural network (FNN) combines a fuzzy system and neural network, fully considers their complementarities, and integrates logical reasoning, language calculation, and nonlinear dynamics with learning, recognition, and adaptive and fuzzy information processing. Its input and output nodes represent the input and output signals of the fuzzy system, and hidden nodes represent membership functions and fuzzy rules. The design parameters can only be selected through experience. The neural network learning method automatically designs and adjusts the design parameters of the fuzzy system based on the input and output learning samples to achieve self-learning and adaptive functions.
The adaptive fuzzy system has the fuzzy logic system of a learning algorithm, which is constructed by a series of “IF-THEN” fuzzy logic rules. The learning algorithm relies on data to adjust the parameters of the system. The adaptive fuzzy system is considered to be a FNN system that automatically generates its fuzzy rules through learning.
Neural network system of contact pressure
Figure 9 is a structural diagram of an FNN. The FNN system formed by the combination of a fuzzy system and neural network has the advantage of expressing human knowledge easily using fuzzy logic while retaining the distributed information storage and learning ability of a neural network.
Input layer. At the fuzzy interface, the input precise quantity is transformed into the fuzzy quantity. F&d is the exact physical quantity of the input.
Fuzzy inference Layer. Storing-inference layer. This layer stores fuzzy controller rules and expert system knowledge or long-term accumulated experience of skilled manual operators, “learns” typical contact pressure-contact gap “samples,” and stores the training effect of neural networks and corresponding change rules.
Output layer. The output

Fuzzy neural network structure.
The FNN control system was established in MatLab (MathWorks, USA) according to the reasoning of Takagi and Sugeno. Suppose the rule base consists of several fuzzy “IF-THEN” rules:
Rule 1: IF F is
Rule 2: IF F is
The MatLab fuzzy logic toolbox supports neural fuzzy systems based on Sugeno-type fuzzy inference. The fuzzy inference system uses the back-propagation (BP) network algorithm of error BP and least squares to complete the modeling of input-output data pairs. The structure is shown in Figure 10.

FNN structure generated by anfisedit.
The basic idea of BP network training and learning is that, according to the input and output training samples, the network weights
(1) Calculation of output of hidden nodes:

(2) Calculation of output of output node:

(3) Calculation of error of output node:

(4) Correction of output node weight:
Group the tested contact displacement and contact force data to form 10 data samples, and use the established data samples to train the FNN. In order to quantitatively analyze the stability of the prediction, a dimensionless error index

Network training error curve.
For example, F is the contact pressure input control quantity, which is divided into eight membership function grades. The quantitative range is larger than that in the paper, which is successively [7.5 9], [9 10.5], [10.5 12], [12 13.5], [13.5 15], [15 16.5], [16.5 18], and [18 19.5]. D is the input control quantity of contact gap, which is divided into 7 membership function levels. The increased quantitative expression ranges are successively [−0.5 0], [0 0.5], [0.5 1.0], [1.0 1.5], [1.5 2.0], [2.0 2.5], and [2.5 3.0]. After the input parameters are increased, the training error curve is shown in Figure 12, which meets the training accuracy requirements. The proposed fuzzy neural network system is proved to be robust.

Network training error curve after increasing input parameters.
By training the FNN samples, the control system can adapt to similar samples. The initial main spring stiffness values

Stiffness of main spring varying with contact gap.
The combined spring has a parallel effect, which increases the stiffness of the main spring. The installation position of the combined spring system structure is shown in Figure 14. Trial production of two products for life tests is compared with the original structure samples.

Modular spring system structure design.
The contact gap increases mainly because the contact defect material is larger than the volume of additional material, the contact pressure and over-travel become smaller, the gap increases, and the contact gap cannot be effectively closed. Figure 15 shows three cases of contact gap increase, as follows: (a) The main form of contact gap increase is the lack of static contact material, (b) the main form of contact gap increase is the lack of moving contact material, and (c) the contact gap is enlarged in the absence of dynamic and static contact materials. The moving contact starts to move upward to eliminate the contact gap stroke. The inner main spring of the combined spring has a slight amount of compression. At this time, owing to the requirements of the installation design, the outer main spring is not deformed. Both the inner and outer main springs are in a compressed state, the stiffness of the main spring increases, the contact pressure increases, and the contacts are effectively closed.

Schematic of three forms of contact gap wear: (a) static contact wear and material loss, (b) moving contact wear and material loss, and (c) moving and static contact wear and material loss.
Contact life model and forecast
Analysis of accuracy grades of life prediction factors
The relay has good contact performance characteristics, that is, low and stable contact resistance and short pull-in time and release time. Many parameters affect the life of the relay and are mutually restricted and have different degrees of influence. Statistical tests were conducted to test their values and identify the main and secondary characteristic parameters as a basis for the evaluation of life (see Lin et al. 26 ). For the analysis process of relay evaluation parameter accuracy level, the reader is referred to Li et al. 27 .
Let the original sequence of feature parameters be as follows:

The corresponding prediction model simulation sequence is

Relative error calculation
Residual sequence:
Relative error sequence:

Under condition
Relevancy calculation
Mean-square error ratio calculation
The mean and variance of the characteristic parameter sequence

The mean and variance of the residuals are, respectively,

Small error probability
Table 2 summarizes the inspection index values of each characteristic parameter and the accuracy level corresponding to each characteristic parameter index. The relative error is below 0.01, the mean-square error ratio below 0.35, the correlation above 0.9, and the small error probability above 0.95. Liu 28 specified the index values of other grade levels. The calculation results show that the accuracy level of the contact resistance and action time of the contacts is one level. They can significantly reflect the characteristics and predict relay life.
Accuracy grade determination index of characteristic parameters.

Contact life prediction
Many theories can be used to predict the life of a relay and determine its reliability. The gray theory is used herein to predict the life of electrical products. The gray system includes known and unknown information. The commonly used gray prediction model is the GM(1,1) model, which is expressed as

The estimated values of the parameters in the formula are obtained via the least-squares method. The corresponding GM(1,1) model time response is

The predicted value of the characteristic parameter can be obtained from the
According to the test, five groups of observed values of contact resistance and effective action times of contact were tested [0.180 1032; 0.266 1941; 0.345 3011; 0.418 4171; 0.485 4282], thus the corresponding contact resistance value could be predicted. If more than relay contact resistance value 0.6 mΩ, relay failure takes place. The prediction formula of relay contact resistance can be obtained as follows:

According to formula (16), the resistance value between relay contacts can be predicted.
According to the experimental test of three groups of contact life values [3643 3936 4242 4526], the prediction model of relay contact life obtained by gray theory is as follows:

Formula (17) k can be sorted by sequence numerical rules to calculate relay life under corresponding parameters, and the intermediate relay life value of [k − (k+1)] can also be obtained by interpolation method.
Figure 16 is a photograph of the relay life test process for a relay. Boundary conditions such as load current can be controlled by programing. An indication display system is used, the entire test is monitored, and all data are entered into the computer for convenient data processing.

Relay life test procedure.
The change of contact resistance is tested after every 1000 contact actions, and the relationship between the contact resistance and number of contact closure times is plotted as shown in Figure 17. According to the design requirements of electrical products, the threshold value of the contact resistance is set to 0.6 mΩ.

Contact operation times and contact resistance relationship.
When the contact resistance exceeds the threshold value, the relay will fail. The test life was 5320 times, the estimated life of the gray model 5092 times, and the relative error 4.29%. The accuracy of the prediction model is reliable.
According to the stiffness of the main spring trained by the adaptive neural network system as described in Section 3.3, the main spring is designed as two springs with different stiffnesses. The inner and outer main springs have stiffnesses of 25 and 15 N/mm, respectively. Both realize parallel mode. The designed contact time threshold is 30 ms. When the relay exceeds the threshold, it reaches the limit of its life. Figure 18 shows the relationship curve between the number of contact actions of a single main spring and the pull-in time, and Figure 19 the relationship curve between the number of contact actions of a combined main spring and the pull-in time. The test life was 4180 and 5107 times and the predicted life was 3958 and 4821 times. The both relative errors were 5.31% and 5.6%, respectively. The life of the combined main spring is increased by 927 times, or 18.15%. The average error of the prediction model is 5.31%–5.6%. This shows that the life prediction model has precise accuracy and can accurately predict the life of the relay.

Contact action times and suction time relationship with for only the spring.
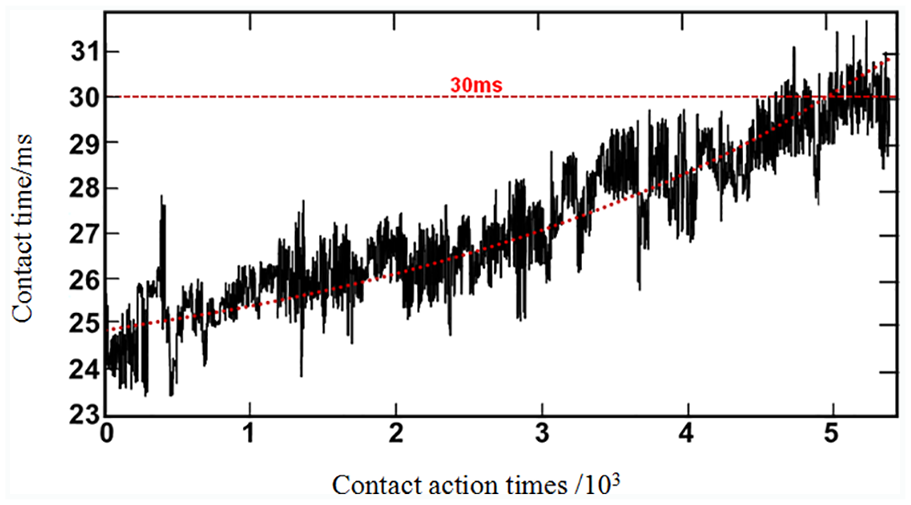
Contact action times and suction time relationship of combined main spring.
Compared with conventional relays with the same parameters, the life of high-voltage DC power relays designed and analyzed can be increased to more than two-fold. Other performance evaluation indices have reached the specified design requirements to meet the demand of new-energy vehicles.
Conclusions
Summarize multiple failure modes of relays and analyze the failure mechanism of relay contacts. The electromagnetic-thermal coupling model of the contact system is established to analyze the distribution trend of the contact heat flow field. Test the characteristic parameter value of the failed relay, observe the change trend of various indicators of contact pressure, contact resistance and action time.
An adaptive fuzzy neural network control system was established, 10 sample feature parameters taken as training samples, adaptive learning and training conducted to meet the training accuracy, and the main spring stiffness value of 35–40 N/mm output. The main spring is designed as the internal and external combined main spring parallel mode to obtain the optimal contact pressure between contacts, so as to achieve a good contact state and extend the life of the relay.
Combining with the experimental test data and using gray theory, a relay life prediction model is established. The influence of relay characteristic parameters on the accuracy of relay life was analyzed. Clearly, contact resistance and operating time are sensitive parameters for life prediction. The life prediction error is 5.31%–5.6%. The life-prediction model is credible and can be used for life prediction and evaluation of the same type of relay.
Compare the sample life test curve of the single main spring relay and the internal and external combined main spring relay. Calculate the life of the two relays, the latter can extend the life of the relay by 18.15%. The life of the relay is better than similar relays of other brands. The demand of pure electric vehicles can thus be met and the driving safety and reliability of new-energy vehicles ensured.
Footnotes
Appendix A
Fuzzy neural network system is a very complex algorithm structure, which needs to determine the network structure and input parameters in advance, including the choice of input variables and sample set, which will affect the stability of the algorithm of the neural network system. MATLAB is used to establish a fuzzy neural network control system. The fuzzy inference system error back propagation algorithm (Error Back Propagation, BP) the BP algorithm and the least-squares algorithm to complete the input - output of data modeling.
The three-layer nodes of BP network are: input layer node: Xj, hidden layer node: Yi, and output layer node: Ol. The network weight between the input layer node and the hidden layer node is wij, while the network weight between the hidden layer node and the output layer node is Tli. When the expected output of nodes in the output layer tl, the error of the P-th data pair of a sample is calculated as follows:
where tpl, Opi are the sample output data and the calculated output value of the network respectively.
The basic idea of BP network training learning is to modify the network weights (wij, Tli) and threshold (θ) according to the training samples of input and output, so that the error function (E) drops along the direction of negative gradient. The calculation formulas of BP network model are as shown in equations (4) to (7) in the paper.
The error function E is Ok multiple functions, but only one Ol has to do with Tli, each Ok independent of each other, among them
then
Output node error is set
then
The hidden nodes
where
Then
Set hidden layer node error
The
Then
Since the weight correction
where
The threshold value
To the output layer nodes
where
Then
The hidden nodes
where
Then
Therefore, there is a modified formula of threshold:
where
The error function is convergent and the adaptive neural network control system is stable.
Handling Editor: James Baldwin
Declaration of conflicting interests
The author(s) declared no potential conflicts of interest with respect to the research, authorship, and/or publication of this article.
Funding
The author(s) disclosed receipt of the following financial support for the research, authorship, and/or publication of this article: This work supported by Fujian Natural Science Foundation Project, No. 2020J01271. The Scientific Research Climbing Project of Xiamen University of Technology, No. XPDKT18016.