
Abstract
The large diameter pitch bearing was made of steel 42CrMo4 and the laser hardening process was used to improve its surface properties. In this paper, a numerical approach which can predict the temperature field and the hardened depth is provided for the laser hardening process of the 42CrMo4 steel. According to the simplification of the raceway structure of pitch bearing, the finite element model was constructed using ABAQUS software. Based on the actual process parameters, the transient thermal analysis was accomplished and the distribution of temperature field is analyzed. The hardened depth is determined according to the proposed temperature range. Laser power, laser scanning speed, and spot diameter were considered as input parameters, the experimental studies were performed based on orthogonal design in order to study the effects of process parameters. The finite element model is validated. The surface roughness and microstructure studies on treated surfaces were conducted. Also the micro-hardness testing was performed. The results show that the laser hardening increases surface hardness by about 3.8 times than that of the base material. The three parameters of laser power, laser scanning speed, and spot diameter have a coupling effect on the surface treatment. The input laser power density is more important.
Introduction
Nowadays, the development of wind power system in the world is mainly toward high power, high reliability, and long service life. Therefore the higher requirements for the performance of large-scale wind turbines are established.1–3 Pitch bearing which is bolted to the blade root on one side and the rotor hub on the one side can adjust windward direction of the blades and optimize the energy output. It is one of the key components of wind power equipment. It is affected by extreme weather conditions, complex load, and harsh service environment.
The main components of the pitch bearing are mainly made of high strength low-alloy steel 42CrMo4, which exhibits excellent harden ability properties.4,5 The most common failures of large wind turbine bearings mainly arise from raceway failure, such as pitting, wear, or peeling. Therefore, there is a great demand for high-quality surface strengthening. As an effective method to improve surface performance, laser surface quenching uses laser beam heating to produce wear-resistant surfaces through martensitic transformation without any quenching medium. It has been widely used and valued in the bearing industry.6–8
Many researchers focused on the experimental and numerical simulation of laser surface hardening process and the evaluation of fatigue life with a hardened layer.9–21 Liverani et al. 9 established the numerical model and investigated the influence of incident laser poser and scanning velocity on the hardened depth and residual stress state for medium carbon steel components. The analytical and numerical models have been provided for evaluation of the temperature distribution during laser surface hardening process. 10 Also the evaluation criteria for prediction of phase changes based on temperature thresholds have been proposed. 11 Due to the literature, the depth of the hardened layer mainly depends on the surface temperature and scanning velocity. The paper provided a numerical approach to predict the temperature profile of cylindrical specimens made with AISI 4340 steel. 12 Wang 16 used gauss heats source to simulate the temperature field of laser quenching, and predicted the depth of hardened layer. The research shows that the simulation results can provide a certain reference for the experimental results, and its accuracy needs to be further improved. Based on Gauss heat source model. The effects of laser scanning speed, laser power, and spot size on temperature distribution are analyzed. Göncz and Glodež 18 analyzed the rolling contact fatigue life considering the induction hardened raceway. The alternative high cycle fatigue parameters for the 42CrMo4 steel in compression were experimentally determined.
In addition, many researchers have studied the life prediction of slew bearing using different method considering hardened layer.22–25 Glodež et al. 22 performed the fatigue life calculation and compared according to different methods: standard ISO 281 method, a stress-life approach, and a strain-life approach. In that paper, material properties vary with the induction hardening depth. Chen and Wen 23 studied the maximum contact force and subsurface stress in the raceway obtained with the finite element method. The effect of raceway hardening depth on bearing life was taken into account. The results show that the service life of hardening raceway is 68.44 times of that of non-hardening raceway. He et al.24,25 analyzed the fatigue life of slewing bearing with the Brown-Miller strain-life method and compared with the experimental results. The results show that the hardening depth can effectively improve the load-bearing capacity and fatigue life of slewing bearing.
The two key parameters to ensure laser quenching effect are surface temperature and the depth of the hardened layer. Because the complex interaction of different process parameters including laser power, laser scanning speed, and spot diameter, it is difficult to obtain successful surface treatment with reasonable hardened depth and excellent surface properties. The determination of laser process parameters is mainly based on experimental method with time consuming. The finite element simulation is an important way to study the laser surface hardening process. However, there are still many problems to be solved. In this paper, in order to study the temperature distribution and depth of the hardened layer of 42CrMo steel after laser quenching, the finite element model made of 42CrMo4 steel was established to simulate the transient temperature field of laser surface hardening process and the distribution of temperature field was analyzed. The hardened depth is predicted. And the 42CrMo4 specimens were prepared and the experiments were carried out according to the orthogonal design for different process parameters. The surface roughness, microstructure structure, and hardness of the quenched specimens were tested.
Numerical simulation of laser surface hardening
Establishment of finite element model
In this paper, a three dimensional thermal finite element model is constructed to simulate the temperature field distribution during laser surface hardening process because of the complex changes in actual hardening process, some assumptions are considered as follows:
The initial surface temperature of steel is 20°C. (2) The finite element heat transfer analysis is performed with solid-solid without considering the chemical reaction and oxidation in the hardening zone. (3) Heat convection between the treatment specimen surface and air is only considered. While the radiation heat transfer is not considered. (4) In the laser surface hardening process, the temperature absorption and release at different raceway positions can be regarded as the same.
Due to the complex construction of raceway, the model was simplified and built which should simulate the thermal characteristics. The local model simplified as a rectangular specimen was shown in Figure 1 cut from the raceway. The transient thermal analysis was performed by using ABAQUS software. The FE model has a dimension of 60 mm × 35 mm × 20 mm. The eight-node linear heat transfer hexahedral element DC3D8 was adopted. After the validation of the grid sensitivity, the final finite element model is shown in Figure 2. In order to improve the computational efficiency, the mesh size of the non-treated area is 0.2 mm, and that of the harden zone is 0.05 mm. The FE model consisted of 58,032 elements.

Simplified specimen model of pitch bearing raceway.

Finite element model.
Material properties
The chemical composition of 42CrMo4 steel used in this paper is shown in Table 1. Thermal performance parameters mainly include: thermal conductivity, specific heat capacity as shown in Table 2. These parameters should be considered in terms of its variation according to heating temperature. The thermal properties are used to simulate the temperature field. There are two methods to deal with the effect of latent heat of phase transformation 8 : Compared with the heat of laser beam absorbed by the material, the effect of phase change latent heat is very small. Therefore, the influence of the latent heat can be ignored. The other is to indirectly consider the effect of latent heat of phase change. 9 Generally, the equivalent specific heat capacity method is used to indirectly consider the latent heat of phase change. In this paper, the latent heat of was indirectly considered. The specific heat capacity used is the total specific heat capacity taking into account the phase heat capacity, lattice heat capacity, electron heat capacity, and new phase formation heat.
Chemical composition of 42CrMo4 steel.

Specific heat capacity and thermal conductivity of 42CrMo4 steel.

Heat source model
Thermal models are employed to evaluate the component temperature following laser exposure. Because laser quenching mainly acts on the shallow surface of material, the Gaussian surface heat source model is selected to simulate the energy distribution of laser spot in the process of laser quenching. The energy distribution is shown in Figure 3. The model can simulate the distribution of heat source. 26 In this simulation, the process parameters: laser power P = 1300 W, scanning speed v = 960 mm/min, the diameter of the laser spot D = 7 mm, surface absorption coefficient 45%.

Gauss heat source model.
In the calculation, the Fortran compiler subroutine DFLUX is used to apply the moving Gaussian heat source load. That means that heat flux according to subroutine is applied for quenching surface.
Convective heat transfer coefficient
In the numerical calculation of laser quenching, heat conduction and heat convection are considered as thermal boundary. 26 The convection heat transfer coefficient which varies with temperature is shown in Table 3.
Convection heat transfer coefficient of 42CrMo4.

Simulated results and discussion
Temperature field analysis
A series of the distribution of the temperature field at different time were shown in Figure 4. The heat affected zone was mainly concentrated in the laser treatment area. And the temperature ranges between 20°C and 1308°C.

Temperature field distribution along the scanning direction at different times: (a) temperature field distribution at t = 0.5 s, (b) temperature field distribution at t = 2.5 s, (c) temperature field distribution at t = 3.5 s, and (d) temperature field distribution at t = 4.14 s.
Six points (shown in Figure 4(a)) were selected at the center of the spot along the scanning direction. The temperature change curve of each selected point was shown in Figure 5. It can be seen that the temperature change in the laser quenching process is extremely fast. The fast cooling is achieved by transferring heat energy into bulk of the material. It only takes 0.5 s for the node temperature to rise from room temperature to the highest temperature, and the scanning temperature basically drops to room temperature after 4 s. When the laser scans the surface of the test piece at a stable speed, the temperature change trend of each node along the scanning direction is the same.

Node temperature along scanning direction.
Depth of hardened zone
According to the temperature results and principle of laser surface hardening, rapid heating and fast cooling were experienced. In order to obtain the good process effects, the heat temperature should be above the austenitizing temperature without exceeding the substrate’s melting temperature. In this study, during laser surface hardening process, the heating temperature was controlled between 780°C and 1450°C. The depth of the hardened layer is predicted in terms of reaching the phase transition temperature (780°C). Figure 6(a) shows temperature distribution of cross section obtained from simulation results. The temperature of laser treated area was appeared to be raised compared to the base material. In order to evaluate the depth of hardening layer, the four points along the depth direction at the center of the spot were selected as shown in Figure 6(a). The highest temperature of different nodes was obtained. And the judgment is performed whether the node temperature on the surface is higher than the austenitizing temperature (780°C) and lower than the melting point temperature of the material (1450°C). If the above requirements are met, the depth of hardened layer is interpolated based on the mesh size. Figure 6(b) is the isothermal line with temperature above the austenitizing temperature.

Measuring points and temperature field distribution of cross section of specimens: (a) temperature field distribution and measurement point and (b) temperature field distribution.
According to the position shown in Figure 6, the maximum temperature experienced by the nodes during the scanning process is extracted (Table 4). According to the characterization method of the hardened layer in this paper, the final hardened layer depth is 0.43 mm due to the laser surface hardening process.
Maximum temperature of measuring point.

Material and methods
The specimens made of 42CrMo4 in normalized state with dimensions 60 mm × 35 mm × 20 mm for laser surface hardening were manufactured. The experimental equipment is IGJR-GQ-3000 fiber laser. The specimens (#1–9#) undergoing single-pass laser scanning and the numerical simulations were accomplished.
After laser quenching, the average surface roughness (Ra) was measured using profilometer. The sampling length was 0.8 mm, and the evaluation length was 4 mm.The microstructures were observed and analyzed using scanning electron microscopy (SEM) of SHIMADZU SSX-550.
The surface macrohardness of the sample was measured with a manual Rockwell hardness tester of HR-150A. Test conditions: The preload of 98.07 N was applied first, then the main load of 1471 N was applied, and the main load was unloaded after 5 s. The cross-sectional microhardness (HV) was measured by a digital microhardness tester. The HV values were assessed on the base of three measurements made at each depth starting from the top surface. A load of 1 kg on the Vickers indenter and dwell time of 13 s were applied.
The phase was measured by X-ray diffraction (XRD) method using a diffractometer (Bruker D8 FOCUS) in CuKα radiation with a graphite monochromator at a target voltage of 40 kV, a current of 40 mA, and a scanning speed of 6°/min to determine the phase state in the hardened layer with raging 35°–105°.
Experimental results and discussions
The depth of hardened zone
In order to study the influences of process parameters on the harden layer, the laser power, scanning speed, and spot diameter were selected as input parameters up to three levels. The experimental parameters of the orthogonal design scheme and the depth of hardened zone were shown in Table 5. It can be concluded that the hardening depth obtained by finite element analysis is in good agreement with that measured using ultrasonic method for experimental specimens. It indicated that the finite element method can be used to simulate the laser processing and the accuracy of the finite element analysis was validated.
Experiment of design and the depth of hardened layer.

Surface roughness
In this experiment, six points were measured on the original surface and the treated surface of each specimen under different process parameters. The surface roughness results are recorded in Table 6. It indicates that the surface roughness of the sample before laser treatment is between 0.661 and 1.045 μm, and the surface roughness of the sample after treatment is between 0.599 and 1.129 μm. The difference in surface roughness before and after laser quenching is the largest in the ninth group of experiments. The difference is 0.338 μm between laser-treated surface and untreated surface. It can be concluded that the surface roughness of the specimen after laser quenching is less different from the original surface.
Measurement results of surface roughness (μm).

Microstructure of hardened specimen
In this paper, microstructure of #5 and #6 specimens were selected and observed by scanning electron microscope. The metallographic structure of the specimen after Nital etching was shown in Figure 7. According to the cross section microstructure, the microstructure of the specimen can be divided into three layers after laser quenching: hardening layer, transition layer, and matrix, respectively.

Cross-section micrographs of 42CrMo4 steel showing: (a) hardening layer, (b) transition layer, and (c) base material.
Laser surface hardening zone is mostly fine martensite, in accordance with literature 12 42CrMo4 steel phase transformation temperature and structure. The reason is that during laser quenching, the temperature increases rapidly (104°C/s-106°C/s), and the nucleation rate of austenite is fast; After the laser beam irradiation, the temperature of the region decreases rapidly (104°C/s-108°C/s), so the heating process is very short, and the grains have no time to grow up, and finally the fine martensite structure is formed.
XRD diffraction analysis was carried out on the surface after laser quenching. The result is shown in Figure 8, it can be seen that strong martensite diffraction peak is strong with small diffraction peak appearance of residual austenite in the diffraction pattern. The sample after laser quenching increases the content of martensite, reduces the content of austenite, and improves the hardness of the specimen.

XRD diffraction pattern of laser quench hardened layer.
Micro hardness variation
The surface hardness which is average value of the five measurement of the samples are shown in Figure 9. It can be seen that the average hardness is 12.98 HRC before laser quenching and 42.20 HRC after laser quenching. The surface hardness of the specimen after laser quenching increases varying with different laser surface hardening parameters. Among them, the hardness of the #3 specimen is the smallest, which is 11.54 HRC before laser quenching and 15.44 HRC after quenching. The results shows that the hardness of the #3 specimen is lower after quenching due to its low laser power, fast scanning speed, and large spot diameter. In fact, the hardness results mainly affected by the input laser power density and the scanning speed. When the scanning speed is determined, the surface hardness is dependent on the heat input. As described in equation (1), the amount of heat input is based on laser power and laser scanning speed. 27 The heat input is related to the laser power and the scanning speed.


Comparison of surface hardness before and after laser quenching.
Also from the hardened depth results shown in Table 5, it can be seen that the depth of #3 specimen is smaller than other specimens. The scanning speed will change the interaction time available for austenitization and the optimized scanning speed should be selected. And the hardness of the #7 specimen is the highest, which can reach 53.46 HRC.
The Vickers hardness variation along the depth from the top surface for hardened zone was measured. Vickers indentations were carried out with a 0.2 mm spacing in the hardened, transition, and matrix zone. Three points at different positions at the same depth were selected to measure the hardness value. Several measurements were carried out and the average hardness value along the cross section is shown in Table 7.
Vickers hardness along the depth direction.
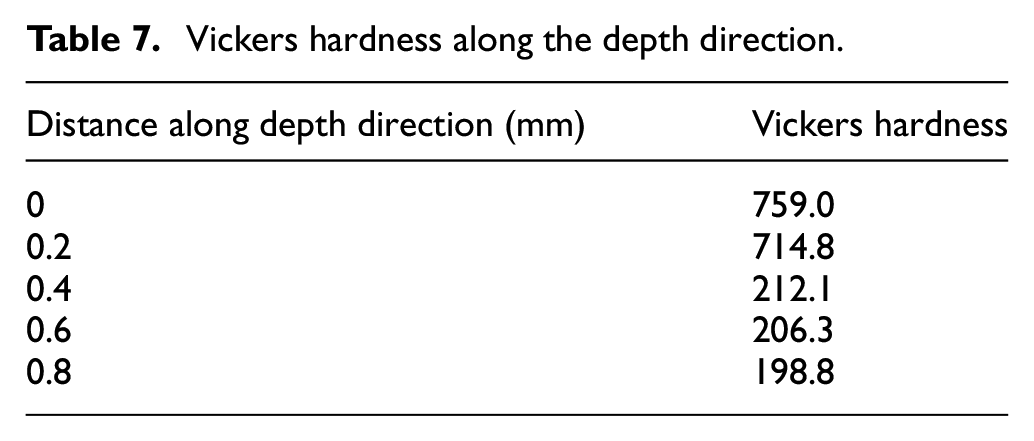
It can be seen from the hardness change curve along the depth for #8 sample in Figure 10. That the highest hardness is 759.0 HV at the surface hardening layer and the hardness gradually decreases along the depth of the hardening layer. The depth of hardened layer is about 0.41 mm. Finally the matrix hardness is 198.8 HV which is similar with the results in literature. 19 The higher microhardness is due to the rapid martensitic phase transformation at the surface as verified by XRD data. It shows that the microhardness has a decreasing trend from the quenching zone to the matrix.

Vickers hardness distribution curve along the depth direction (#8 sample).
Conclusions
This paper provides a numerical approach that can predict the temperature field and the hardened depth of the laser hardening process of the 42CrMo4 steel. Based on the simulated temperature field, the temperature range (780°C–1440°C) used to characterize the hardened layer of laser quenching for 42CrMo4 steel is proposed. The depth of hardened layer is predicted.
The orthogonal experiments of laser hardening process considering the parameters: laser power, scanning speed, and spot diameter were performed for the specimens made of 42CrMo4 steel in normalized state. The hardened layer depth obtained by experiment and that of simulation is compared. And the numerical simulation method provided is validated.
The laser quenching has little effect on the surface roughness. The material of laser quenching layer mainly consists of martensite with high hardness; there are both martensite and original structure at the transition layer. There is no phase transformation at the matrix. The surface hardness can reach 53.46 HRC after laser treatment while maintaining the surface quality of the specimen. The laser hardening increases surface hardness by about 3.8 times than that of the base material. The results indicated that the parameters have coupling interactions. And the laser power density which affects the heat input is more important. The scanning speed should be optimized accordingly.
Footnotes
Handling Editor: James Baldwin
Declaration of conflicting interests
The author(s) declared no potential conflicts of interest with respect to the research, authorship, and/or publication of this article.
Funding
The author(s) disclosed receipt of the following financial support for the research, authorship, and/or publication of this article: The research was supported by Jingye Key Laboratory of New Energy Technology and Equipment Research and Innovation Center of Beijing Institute of Petrochemical Technology. This work was also supported by the Construction Project of High-end Disciplines in Beijing Universities (Beijing Institute of Petrochemical Technology).