
Abstract
In this numerical study particle behavior inside a sinusoidal pipe geometry is analyzed. The 3D geometry consists of three identical modules, with a periodic boundary condition applied to the flow in the stream wise direction. The incompressible, turbulent gas flow is modeled using a Large Eddy Simulation (LES) approach. Furthermore, the particle dynamics are simulated using a Lagrangian point force approach incorporating the Stokes drag and slip correction factor. Four different sizes of particles, corresponding to a Stokes number less than unity, are considered along with two different inflow conditions: continuous and pulsatile. The pulsatile inflow has an associated flow frequency of 80 Hz. The fluid flow through the sinusoidal pipe is characterized by weak flow separation in the expansion zones of the sinusoidal pipe geometry, where induced shear layers and weak recirculation zones are identified. Particle behavior under the two inflow conditions is quantified using particle dispersion, particle residence time, and average radial position of the particle. No discernible difference in the particle behavior is observed between the two inflow conditions. As the observed recirculation zones are weak, the particles are not retained within the cavities for a long duration of time, thereby reducing their likelihood of agglomerating.
Keywords
Introduction
Corrugated geometries have been studied extensively with regards to their effect on fluid mixing,1–3 mass transfer,4,5 and heat transfer.6–10 By corrugated geometries we are referring to geometries with successive expansions and contractions. These geometric configurations have sometimes been referred in the literature as wavy-walled, furrowed, and sinusoidal channels as well. More broadly, it has been reported that both the mass and heat transfer characteristics of such geometrical configurations were better than their straight channel counterparts based on the Sherwood and Nusselt number calculated for different Reynolds number. This has been credited to the intrinsic flow structures found within such corrugated geometries which contribute toward better fluid mixing. However, a larger pressure drop has also been observed for corrugated geometries as compared to straight channel geometries. 7
Studies primarily focusing on understanding the flow behavior in corrugated geometries can be found in the past literature as well. Guzmàn and Amon11,12 have reported that as the Reynolds number was increased, the laminar flow underwent successive bifurcations to transition and eventually arrive at a chaotic regime. Various studies based on linear stability analysis have been conducted to identify modes leading to flow instability inside corrugated geometries. The presence of a centrifugal instability has been identified both experimentally13,14 and numerically. 15 Furthermore, a Kelvin-Helmholtz like traveling wave instability has also been found within corrugated pipes, which develops at the margin of the recirculation zones and the induced shear layer.16–18
Studies focusing on the distribution of solid particles in such corrugated pipe like geometries have been reported in the literature as well. A particular case would be the so called wavy-walled geometry, consisting of wavy bottom wall and a flat top wall. The flow over wavy-walled geometries has been studied both experimentally19,20 and numerically.21–23 Studying particle distribution with such a geometric configuration can be used to approximate sediment transport. In the Direct Numerical Simulation (DNS) study by Boersma,
24
particles with relaxation time on the order of
Marchioli et al. 26 further analyzed particle behavior inside a wavy wall configuration. Their setup (while similar in terms of methodology) differed from with Chang and Scotti 25 in the type of fluid, the total number of particles in the domain, the size of the particles, and the ratio of the particle to fluid density utilized. The study by Marchioli et al. 26 highlighted that there were two distinct flow regions affecting the particle behavior. The first region extended from the point of flow separation until the reattachment of the flow. Similarly, the second region consisted of the region downstream of the point of flow reattachment until the subsequent point of flow separation. It was reported that in the first region the particles were entrained by the recirculation zone and eventually deposited. In the second region the dominant coherent flow structures expelled the deposited particles toward the outer flow. Furthermore, it was observed that particles with more inertia tended to cluster around regions of high strain and low vorticity near the wall. A DNS study was performed by Lee et al. 27 further analyzing particle behavior within various types of wavy wall configurations and a flat wall configuration. Particles with larger inertia had the tendency to cluster around the up-slope region of the wavy wall. This was again due to the dominant flow structures found in the up-slope region. The particle clustering close to the wall shifted from a strip pattern to a mixture of a strip and streak pattern as the ratio between the corrugation amplitude and the wall wavelength was successively reduced. A LES study performed by Chang and Park 28 looked into the behavior of sediments in a sinusoidally shaped geometry under unsteady flow conditions. It was reported that particle dispersion was influenced by the presence of the coherent flow structures. In particular, during the deceleration phase of the flow, vortices were generated downstream of the crest of the wavy geometry that contributed to the convection of the sediments. Fonias and Grigoriadis 29 have also considered a particle laden flow over a dune-like geometry using a LES approach for the flow and a four-way coupled Lagrangian approach for the particles. The main conclusions were that the presence of particles attenuated the mean flow velocity and the turbulent kinetic energy. Particles also tended to cluster around the upslope region of the dune as opposed to where the recirculation zones were found.
Scope of this work
Most of the previous work based on corrugated geometries have focused primarily on heat and mass transfer. The behavior of particles within such geometries has mostly been considered in geometries consisting of a lower wavy wall and a flat upper wall. Past studies30,31 have explored the possibility of particle agglomeration using such corrugated geometries. These geometries consist of successive expansions and contractions meant to manipulate the flow field. If the particles being carried by the flow do not have significant inertia then a suitable flow manipulation may lead to enhanced interaction between the particles. Particle agglomeration may potentially aid with improving the efficiency of exhaust after treatment systems, specifically particulate filters, in heavy duty vehicles.
The current study considers a

Illustration of the wavy pipe geometry with annotations highlighting the important geometrical dimensions. Periodic flow boundary conditions are applied in the streamwise direction.
Geometry and methodology
Geometry and mesh
In Figure 1 the wavy pipe geometry considered for this numerical study is presented. The minimum and maximum diameter of this geometry is

where

where
Summary of the different grid resolutions considered.

Numerical methods
The numerical simulations are performed using the finite volume based solver STAR-CCM+. 35 The 3D incompressible continuity and Navier–Stokes equation are solved using a Large Eddy Simulation (LES) approach given by the following equations:


where the gas density
For the second case a pulsatile mass flow rate based on a sinusoidal pulse form is applied at the inlet plane. The pulse form is characterized by a mean velocity
The Reynolds number for both flow cases based on the minimum diameter and the bulk velocity at the inlet is approximately
Data reduction of the flow field data is achieved using time averaging and phase locked averaging. For a given flow variable

where the time

where

Normalized sinusoidal pulse form imposed for the pulsatile inflow scenario.
In the forthcoming results section the phase locked averaged data is presented for the phases indicated in Figure 2. The collection of statistics started after 11 flow through time, where the flow through time is given by
A Lagrangian point particle treatment is used to track the solid particles as described in Crowe.
40
Four different sizes of the particles are considered:

where
Results
Solver validation
In order to validate the solver the backward facing step case presented in the experimental study by Fessler and Eaton
47
is considered. It should be noted that this particular validation case does not consider particles of the same size as our present setup. As the Stokes number in our setup is small the particles will follow the flow streamlines. Thus, a benchmark case which exhibits similar flow characteristics, such as flow separation, to our geometry is selected for the purpose of validation. The step height of the geometry in the aforementioned experimental study
47
is
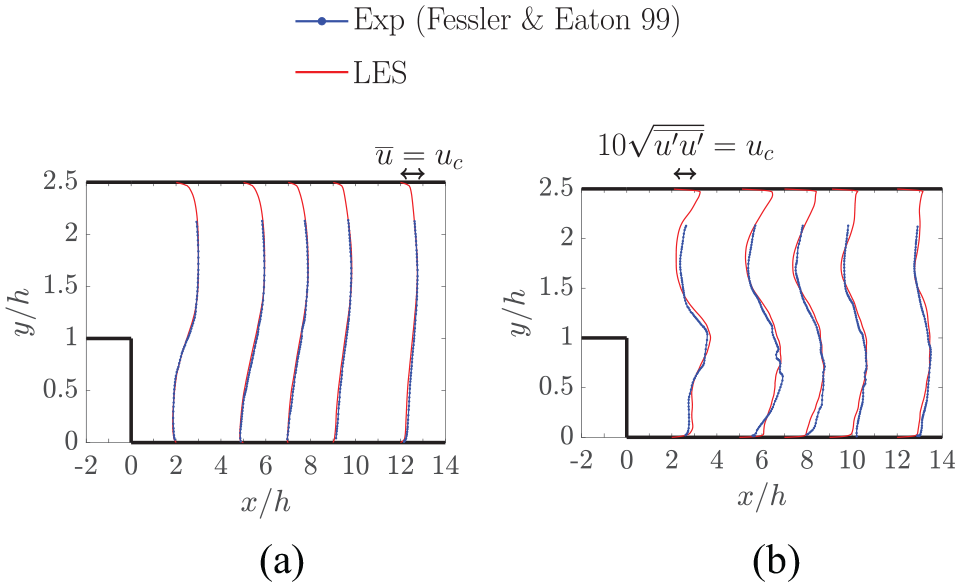
Normalized flow profile comparisons (Experiments 47 vs LES) at different stream-wise flow locations: (a) time averaged streamwise component of the velocity field and (b) root mean square of the streamwise component of the velocity field.

Normalized averaged stream wise particle velocity comparisons between experimental 47 and numerical (LES based) results at different downstream locations from the step.
Grid resolution study
In order to determine the optimal grid the absolute normal deviation
Summary of the absolute normal deviation for the results obtained using different grids.


Comparison of the energy spectra taken for the three grids under consideration.
The flow profiles
Firstly, the flow field data of the continuous inlet mass flow case is considered. In Figure 6(a) and (b) the contour plots of the time averaged streamwise component of the velocity field and the turbulent kinetic energy are displayed. The planes being displayed are the mid longitudinal plane and selected circumferential planes. In particular, the precise position of the displayed circumferential planes are indicated by the outlines shown in Figure 1 and the planes are placed above or below the expanded or contracted section they correspond to, respectively. The velocity contours in Figure 6(a) highlight that the flow successively decelerates and accelerates moving from the expanded to contracted section. Furthermore, as the flow decelerates the boundary layer separates and thus giving rise to shear layers. Weak recirculation zones are also observed in the expansion region of the geometry. As highlighted in the TKE contour plots (see Figure 6(b)) the largest TKE content is found within the induced shear layers. We consider a single line profile for the flow quantities of interest since the flow field does not appear to vary significantly moving from one segment to the next. The precise position of the line segment is indicated by the dash dotted line in the contour plots within Figure 6(a) and (b). In Figure 6(c) the left plot presents the normalized time averaged streamwise component of the velocity field. An extremely small negative velocity is obtained in the line profile extracted at an orthogonal line located in the middle of the second module. The right plot in Figure 6(c) presents the normalized TKE profile, where the two peaks in the profile correspond to the shear layer formed downstream of the contracted section of the module due to flow separation.

(a) Contour plots of time averaged streamwise component of the velocity field, (b) contour plots of turbulent kinetic energy, and (c) flow profiles of the time averaged streamwise component of the velocity field (left) and turbulent kinetic energy (right) taken across the maximum cross sectional plane in the second segment. The bulk velocity
In the pulsatile inlet mass flow scenario phase locked line profile data are considered at various phases. These phases are highlighted in Figure 2. The precise position of the line segment under consideration is the same as the one considered previously for the continuous inlet mass flow scenario. In Figure 7 the normalized phase locked averaged streamwise velocity and turbulent kinetic energy line profiles are presented in the top and bottom panel, respectively. In each plot the results for two different phases has been grouped together. Phase

Line profiles of the phase locked streamwise component of the velocity field (top panel) and pulsatile turbulent kinetic energy (bottom panel). The mean pulsation velocity
Particle behavior
The first thing considered in the particle behavior within the sinusoidal geometry is the particle dispersion in the

Particle dispersion in the

Histogram plots of particle residence time for each module under continuous inflow conditions for particle size: (a)

Histogram plots of particle residence time for each module under pulsatile inflow conditions for particle size: (a)
By considering the particle radial positions across each individual module the tendency of the particles to be trapped in the boundary layer becomes more evident. In Figures 11 and 12 the histogram plots associated with the average radial position of a particle within an individual module are presented for continuous and pulsatile inflow conditions, respectively. The

Histogram plots of the average radial position of a particle within each module under continuous inflow conditions for particle size: (a)
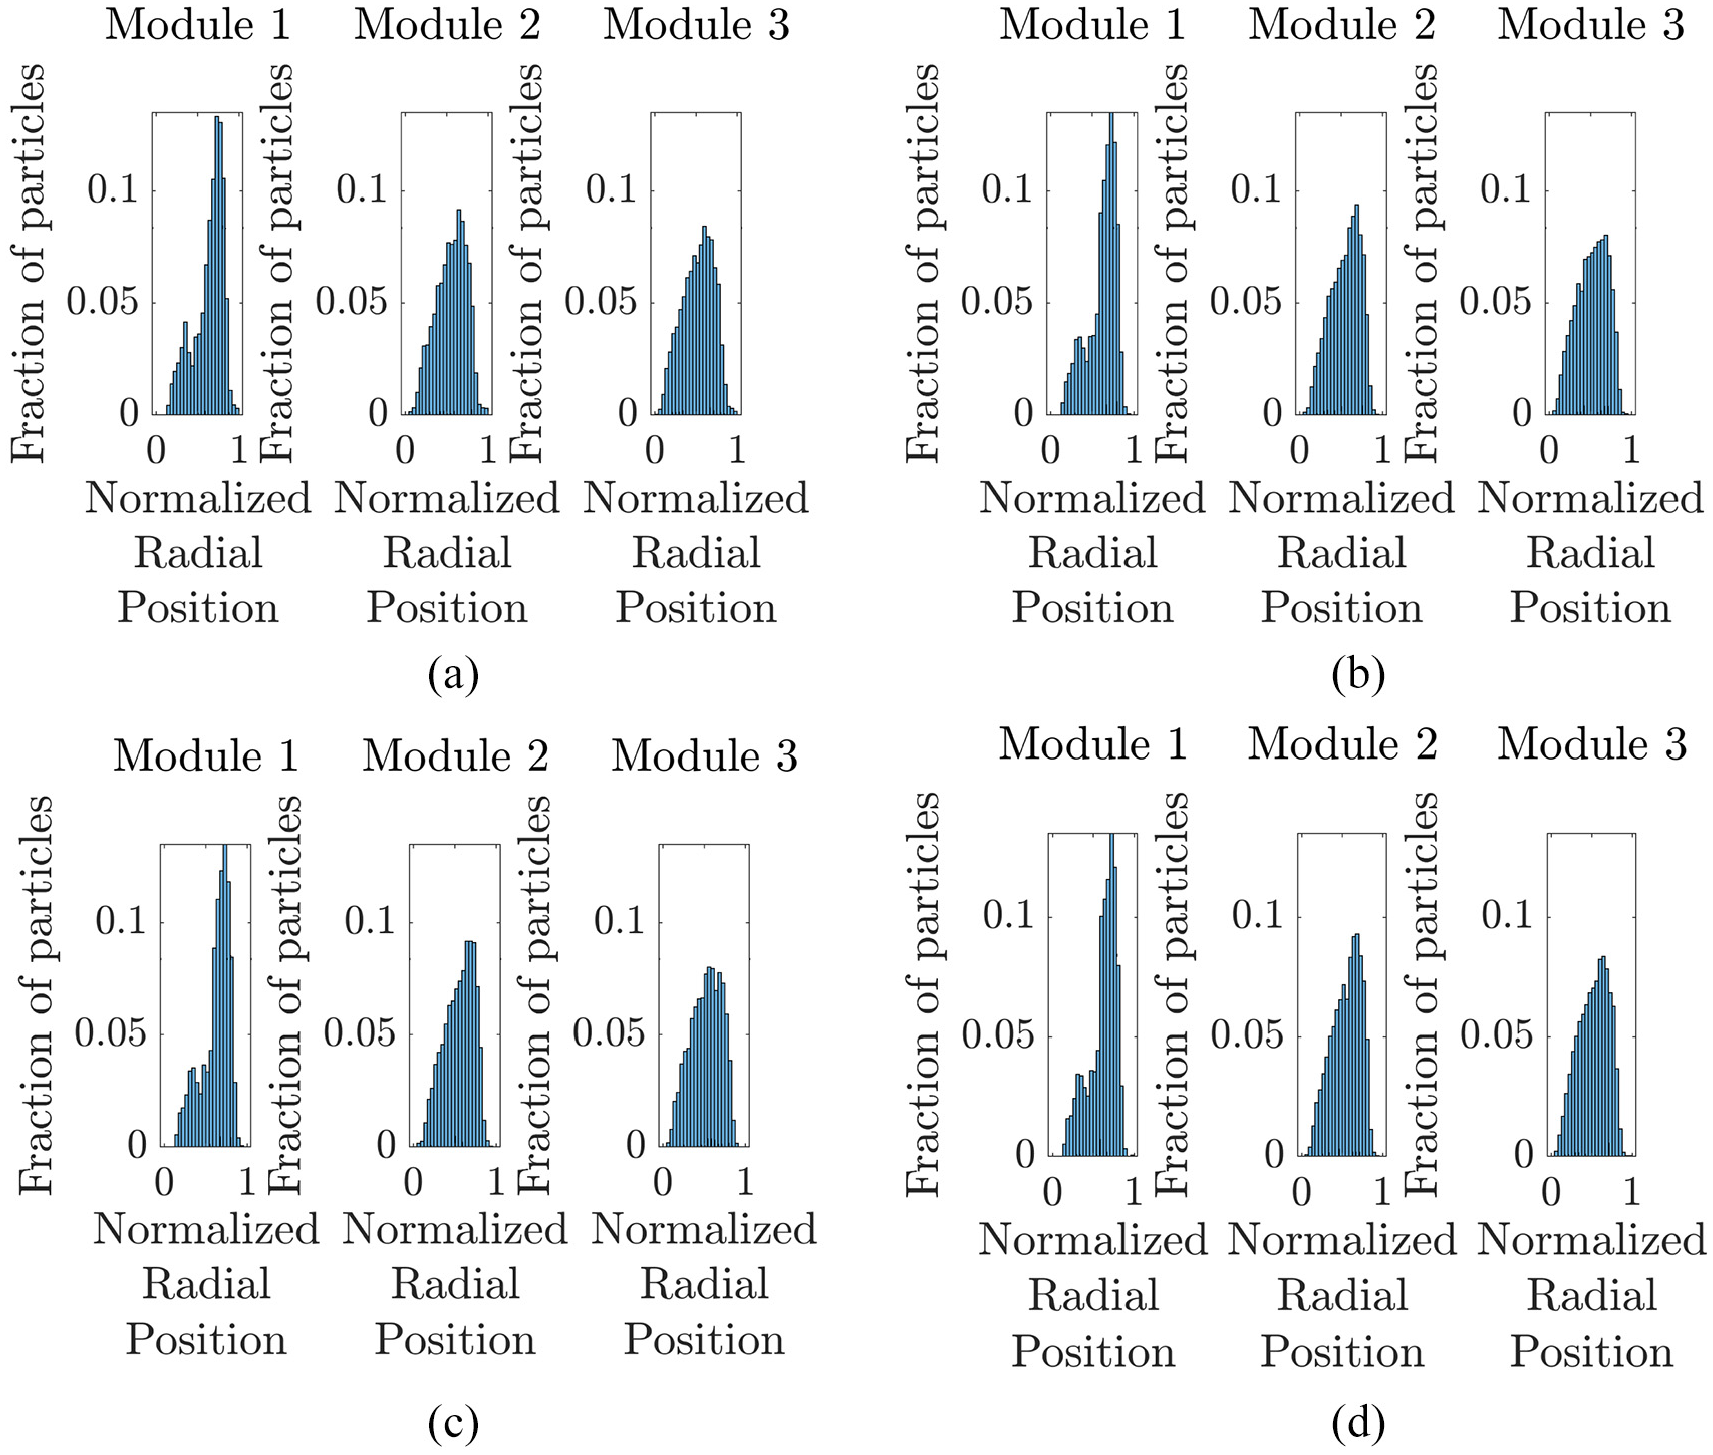
Histogram plots of the average radial position of a particle within each module under pulsatile inflow conditions for particle size: (a)
Discussion and conclusions
The present numerical study considers mono-disperse simulations of low Stokes number particles under continuous and pulsating inflow conditions inside a sinusoidal geometry. Periodic boundary conditions are imposed in the streamwise direction. The flow field under different inflow conditions is firstly characterized. Particles are then introduced inside the computational domain. A Lagrangian point force approach in a one way coupling manner is utilized. Only the Stokes drag force is incorporated in the numerical setup. In order to get an insight into the particle behavior within the sinusoidal pipe geometry the particle dispersion, residence time within each module and the average radial position of a particle within a module are considered. In all dispersion plots an initial increase in the dispersion value is observed up to approximately one non-dimensional unit of time. At later times fluctuations are observed in the dispersion plots. Due to the weak recirculation regions the vast majority of the particles leave the computational domain within the first five non dimensional units of time. The fluctuations observed at later non-dimensional units of time in the plots are based on the remaining particles. Histogram plots associated with the particle residence time highlight that the vast majority of the particles are not retained in the domain for a long duration of time. This can be linked to the weak recirculation zones within the expansion region of the cavities. As most of the particles do not reside within any individual module for a long duration of time, the likelihood of particles interacting with other particles is small. However, in the pulsatile flow scenario the flow decelerates first and as a result of the reduced convective velocity particles stayed in the first module for a slightly longer duration as compared to the continuous flow case. Since the Stokes number associated with all the particles considered in this study is less than unity, once the particles move out of the first module they follow the flow and move out of the computational domain. This is further highlighted in the histogram plots associated with the average radial position of the particles, where the average radial position of the particles in the last two modules is nearly identical. There are some particles that get trapped in the boundary layer of the first module upon their release from the inlet plane of the computational domain. This behavior is exhibited in the slightly skewed distribution of radial position of particles in the histogram plots corresponding to the first module of the geometry.
There are two main limitations associated with the present analysis. The grid resolution utilized for this study is only appropriate for a wall modeled LES turbulence modeling approach. Secondly, the current setup has a mean free path of approximately
Footnotes
Acknowledgements
This research was performed within the Competence Center for Gas Exchange (CCGEx) at KTH. The Swedish Energy Agency, Volvo GTT, Volvo Cars, Scania, BorgWarner Turbo Systems and Wärtsilä Engineering are highly acknowledged for their support and contributions to the completion of this study. The authors would also like to acknowledge KTH PDC under the Swedish Computing Infrastructure (SNIC) for providing the computational resources required to run the simulations.
Handling Editor: James Baldwin
Declaration of conflicting interests
The author(s) declared no potential conflicts of interest with respect to the research, authorship, and/or publication of this article.
Funding
The author(s) disclosed receipt of the following financial support for the research, authorship, and/or publication of this article: This study was financed through the Competence Center for Gas Exchange (CCGEx) at KTH. CCGEx is supported by the Swedish Energy Agency, Volvo GTT, Volvo Cars, Scania, BorgWarner Turbo Systems and Wärtsilä Engineering.