
Abstract
Lagrangian particle tracking and Large-Eddy simulation were used to assess the effect of different fuels on spray characteristics. In such a two-way coupled modeling scenario, spray momentum accelerates the gaseous phase into an intense, multiphase jet near the nozzle. To assess fuel property effects on liquid spray formation, the non-reacting Engine Combustion Network Spray A baseline condition was chosen as the reference case. The validated Spray A case was modified by replacing n-dodecane with diesel, methanol, dimethyl ether, or propane assuming 150 MPa injection pressure. The model features and performance for various fuels in the under-resolved near-nozzle region are discussed. The main findings of the paper are as follows. (1) We show that, in addition to the well-known liquid penetration
Keywords
Introduction
Engine Combustion Network (ECN) is an international collaborative effort to focus research and to facilitate experimental and computational data access within the engine combustion context.1,2 A focal topic within ECN is spray combustion which is approached by detailed measurements and simulations on n-dodecane, n-heptane, and gasoline. One of the best documented diesel combustion target conditions is the ECN Spray A case in which liquid n-dodecane is injected through a nozzle hole
Examples of ECN-related modeling studies using two-way or four-way coupling within the Lagrangian spray modeling context.
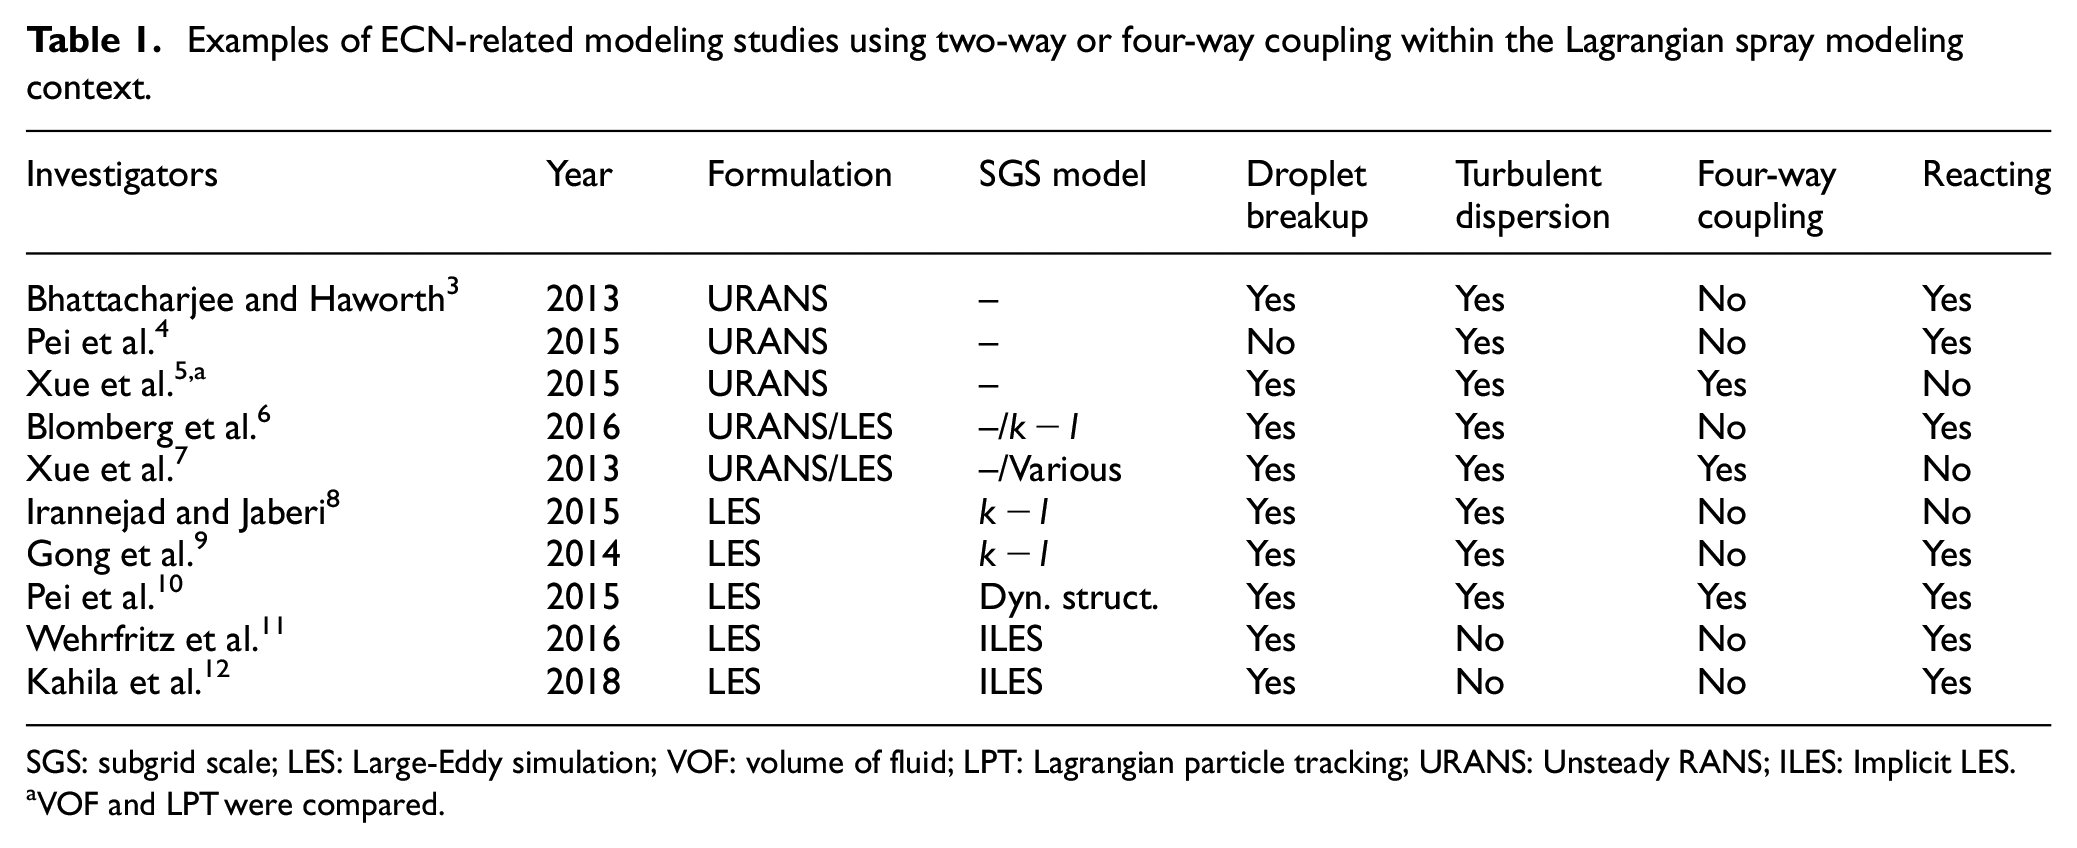
SGS: subgrid scale; LES: Large-Eddy simulation; VOF: volume of fluid; LPT: Lagrangian particle tracking; URANS: Unsteady RANS; ILES: Implicit LES.
VOF and LPT were compared.
In modern diesel engines, fuel is injected directly into the cylinder using a common-rail injection system. After the start of injection, the liquid phase reaches a maximum penetration length, commonly termed the liquid length
With relevance to the present study, some key fuel properties are (1) liquid fuel density
There are several computational studies on single fuel LES/LPT (see Table 1). However, we are aware of only a few papers addressing the fuel property effects on spray characteristics. For example, several studies are available concerning detailed single fuel inner-nozzle simulations.23–25 Som et al. 26 used RANS modeling for both the inner-nozzle and the ambient part of the injector comparing biodiesel and standard diesel fuels. They concluded that biodiesel has both higher liquid length and vapor penetration than standard diesel. The observation was explained by the high boiling point temperature and heat of vaporization of biodiesel. While the discussed studies were carried out in non-reacting conditions, there are a number of detailed numerical investigations carried out in reacting conditions as well.4,8,9 One of the few studies which included fuel property comparison in reacting conditions was carried out by Som and Longman. 27 The study was an extension to the earlier non-reacting study. 26 They compared biodiesel to petrodiesel and pointed out the need to develop better surrogates for the considered fuels.
According to the previous literature7,9,28,29 the schematic picture in Figure 1 summarizes typical LES/LPT spray centerline average velocity and temperature profiles at distances z/D < 200 from the nozzle exit. We emphasize that this graph is solely based on simulations while respective experimental data are presently not available. Next, we discuss some of the features in the figure. The domain in Figure 1 consists of three parts. (1) Droplets lose their momentum accelerating the gaseous phase, denoted as
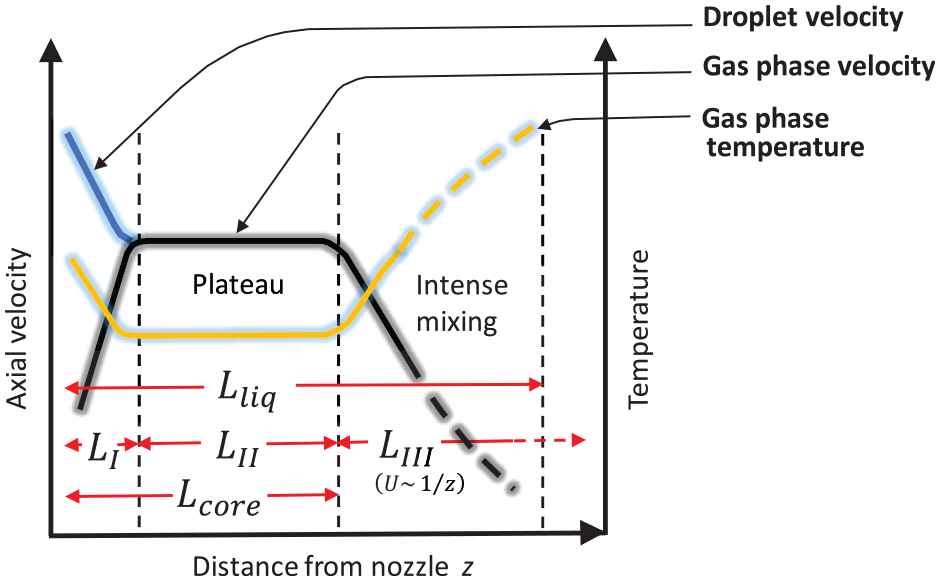
Thereby, the following hypothesis are formulated for the present numerical work: (1) liquid length between the studied fuels is proportional to
As discussed above and summarized in Table 1, there are not many detailed numerical studies assessing fuel property effects on spray characteristics. With relevance to engine R&D process, understanding LES/LPT model performance for various fuels is important. Therefore, our aim is to bridge the observed research gap by computational LES/LPT modeling of the mixing and evaporation characteristics of various fuels. In order to answer the above stated research hypotheses, the below objectives have been formulated for the present numerical study:
Validate the LES model in the non-reacting ECN Spray A case for n-dodecane;
Compare diesel, dimethyl ether (DME), methanol, and propane to n-dodecane in the Spray A conditions;
Asses injection-to-injection variation between the fuels;
Understand the effect of liquid density on liquid length;
Analyze the local equivalence ratio differences between the fuels.
In larger context, the model features and performance for various fuels in the under-resolved near-nozzle region are discussed. In order to answer the objectives, the study is limited to non-reacting sprays. However, we note that the near-field metrics of non-reacting and reacting Spray A are essentially the same. 12
Governing equations
Fluid motion
The governing equations for the gaseous phase describe the conservation of mass, momentum, energy, and species mass fractions, and they are written as follows
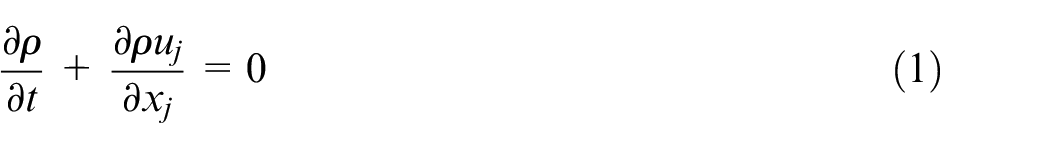
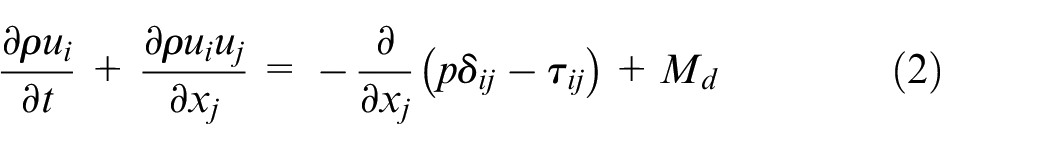
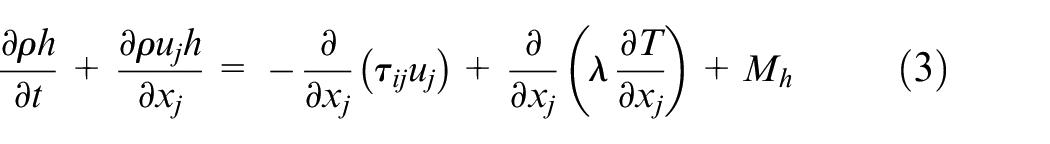
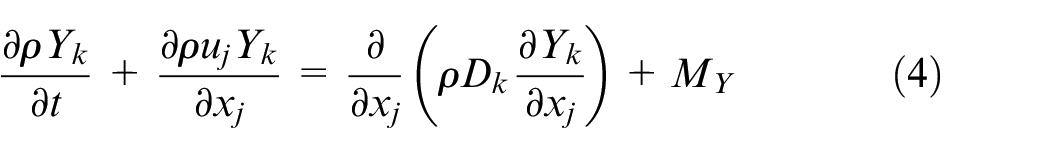
where
In LES, equations (1)–(4) are spatially filtered resulting in additional subgrid-scale (sgs) terms from the non-linear part of the equations and they can be written in the form
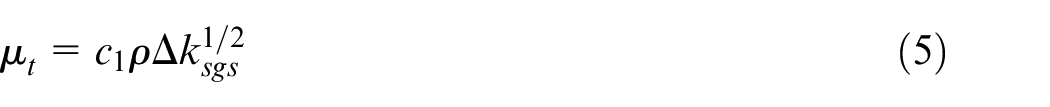
In equation (5),
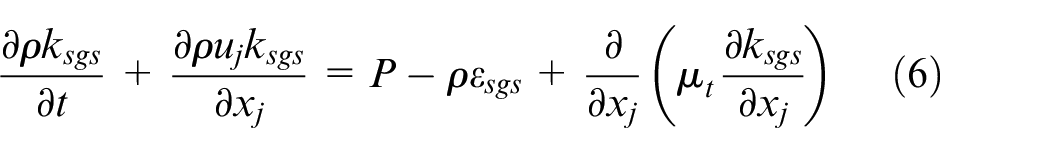
where
and
The coefficients
Droplet motion
In LPT, the motion of individual droplets is tracked through the computational domain. The number of droplets in a diesel spray can be significant and, hence, it is a common practice to reduce the computational cost and group droplets with similar properties into a “parcel.” In this study, parcels have equal mass indicating that the number of the droplets within a parcel is varying depending on the droplet size. The parcel position is updated from
It is assumed that the force acting on a droplet is due to the aerodynamic drag, leading to the following formulation under assumption of spherical droplets 19
The expression for the drag coefficient
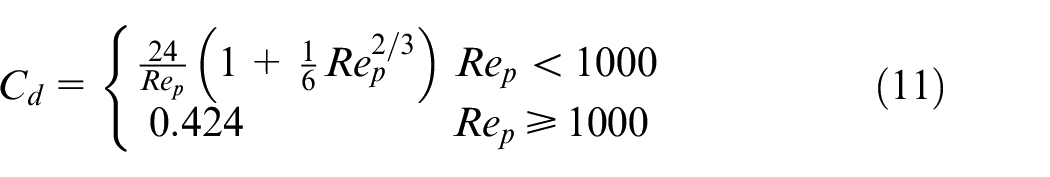
where
The parcels are advanced in time using a semi-implicit time integration method by taking five subiterations within each time step. The momentum source term
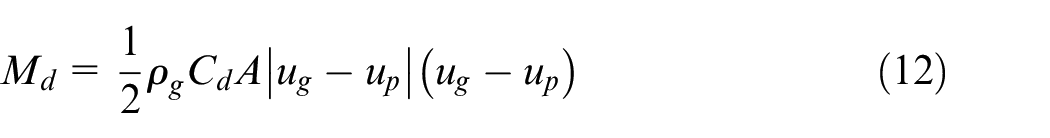
where
Concerning droplet breakup modeling, Wehrfritz et al.
28
observed in Spray A conditions (see Table 2) that droplet breakup takes place only upto ∼20D (nozzle hole diameter D) from the nozzle exit after which the droplet Weber number becomes too small for droplet breakup to take place. In addition, it has been numerically observed that droplet Sauter mean diameter (SMD) reduces very quickly (within ∼1–2 mm) below 1 µm level.28,35 Experimental evidence in non-evaporating Spray A conditions also indicates very quick droplet SMD reduction to 1 µm level.
36
On the contrary, detailed experimental information on evaporating droplet sizes in Spray A conditions using n-dodecane is still missing, let alone droplet sizes for other fuels (such as those studied here).1,2 Considering the above limitations, we apply a constant droplet size (Weber number
Operating conditions for Spray A.
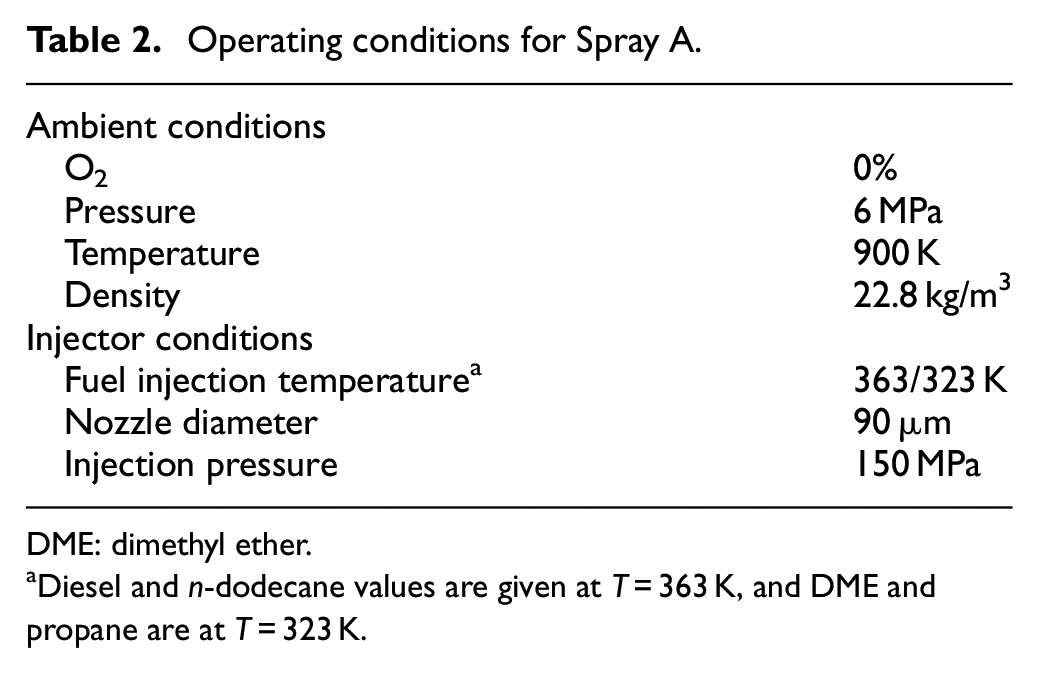
DME: dimethyl ether.
Diesel and n-dodecane values are given at T = 363 K, and DME and propane are at T = 323 K.
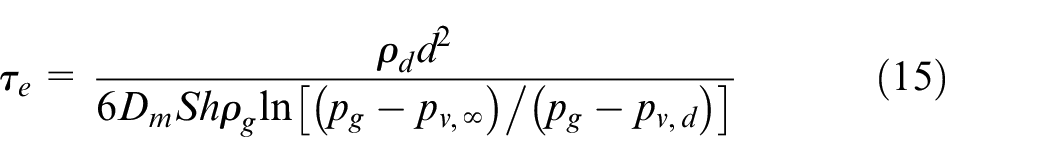
Droplet evaporation
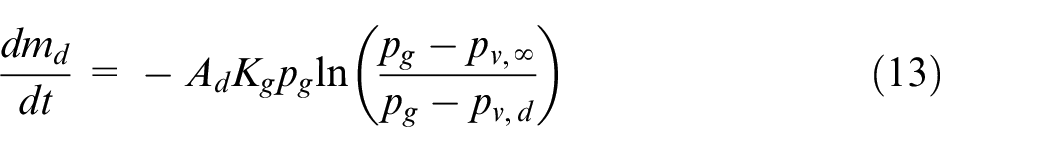
The mass transfer from the droplets due to evaporation is modeled according to Bird et al. 38 The rate of change of the droplet mass is given as follows
where
where
Computational setup
The present study uses the ECN Spray A case as the baseline case. The Spray A experiments have been conducted with n-dodecane
The most relevant fuel properties are provided in Table 3. The properties of liquid diesel have been taken from the literature40,41 and those of DME from Teng et al. 42 The properties of n-dodecane, methanol, and propane are taken from the NIST database. 43 The stoichiometric mixture fraction values have been calculated by assuming an oxidizer mixture with 21% of O2. It is seen that there is a large variation in the liquid density between the fuels ranging between 784 and 449.8 kg/m3 at the injection temperature. Figure 2(a) shows the temperature sensitivity of the liquid density for all the five fuels. Vapor pressure affects significantly the evaporation process as seen from equation (13). Figure 2(b) shows the vapor pressures of the fuels as a function of temperature. Large differences are observed also in this quantity. According to hypothesis 2, the liquid length will also be affected by vapor pressure. Due to the very low boiling point temperature of DME and propane, their injection temperature was set to T = 323 K. This is in line with liquid propane experiments comparing light fuel oil (LFO) and propane sprays in a room temperature spray bomb. 44 In those experiments, it was necessary to decrease the injection temperature of propane due to fast vaporization inside the nozzle.
Fuel properties.
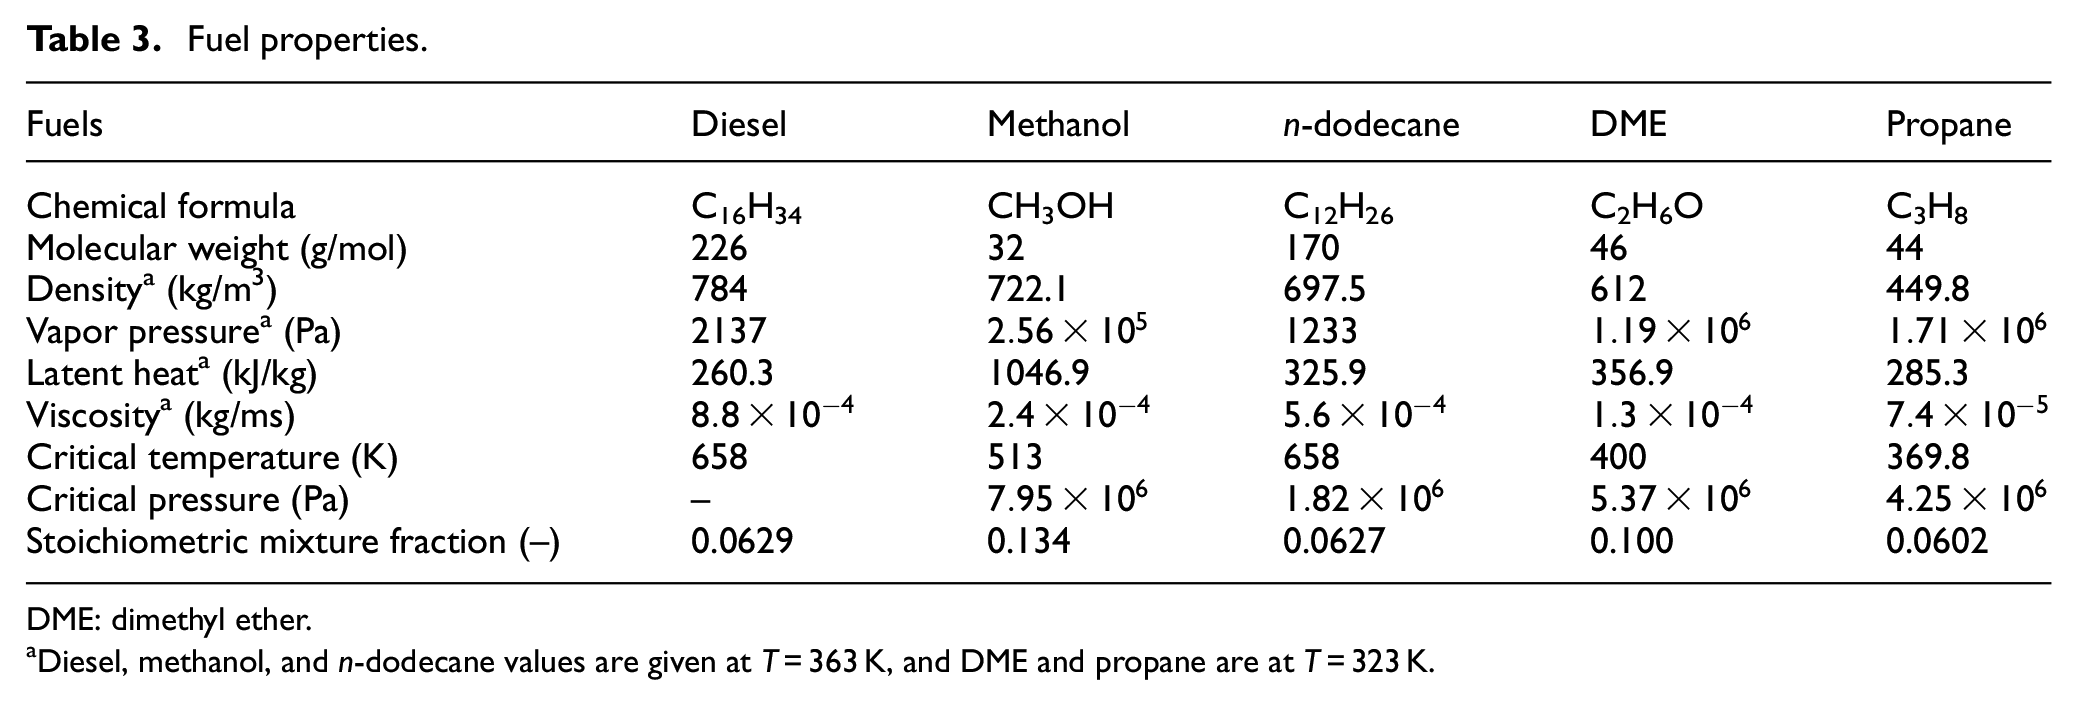
DME: dimethyl ether.
Diesel, methanol, and n-dodecane values are given at T = 363 K, and DME and propane are at T = 323 K.
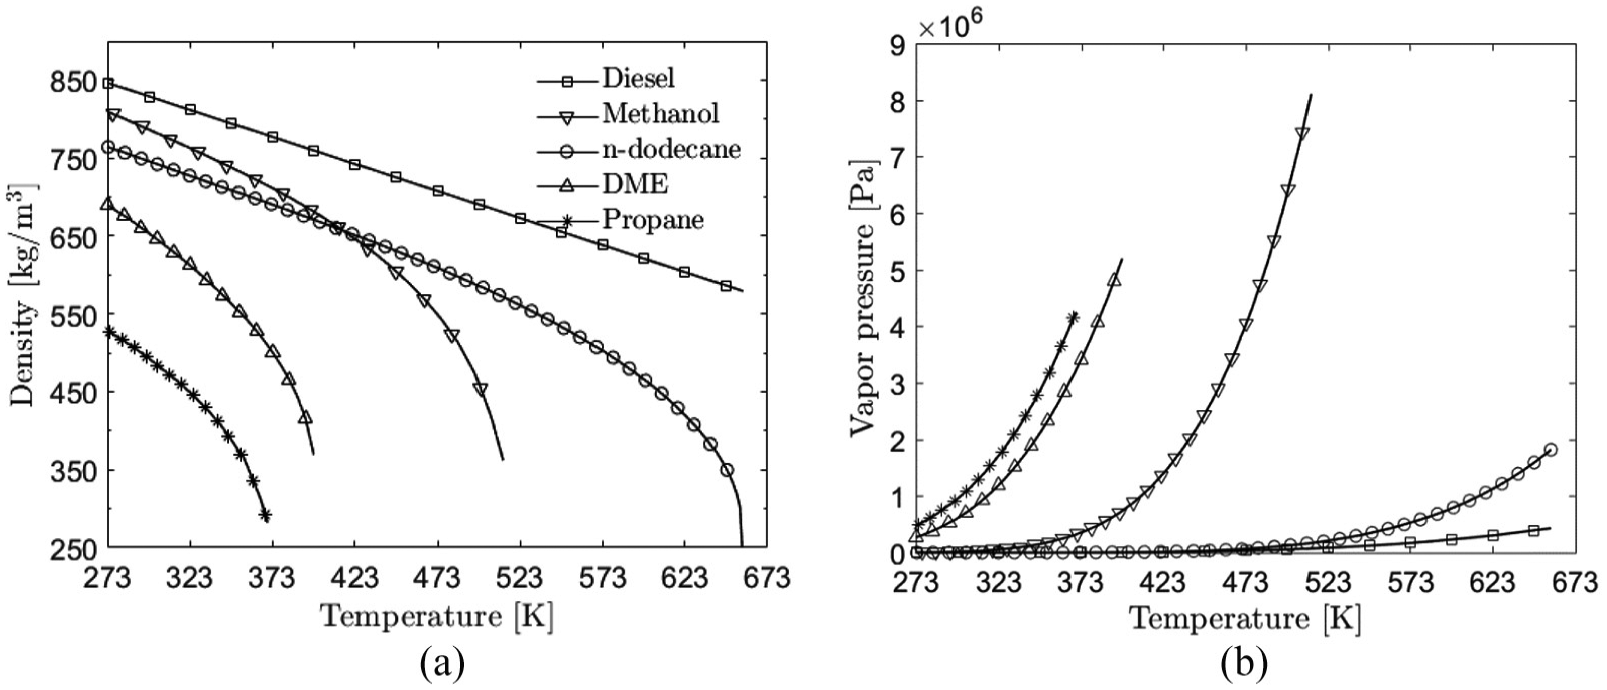
(a) Liquid densities and (b) vapor pressures used in the present study.
The injection velocity versus time profile of n-dodecane is obtained from experimental massflow profile (from CMT-Motores Térmicos (CMT) virtual profile generator)
1
. Figure 3 shows the injection velocity profiles for the studied five fuels. In the present study, the same injection pressure is used for all fuels (see Table 2). Therefore, the injection velocity for each fuel depends on its density according to
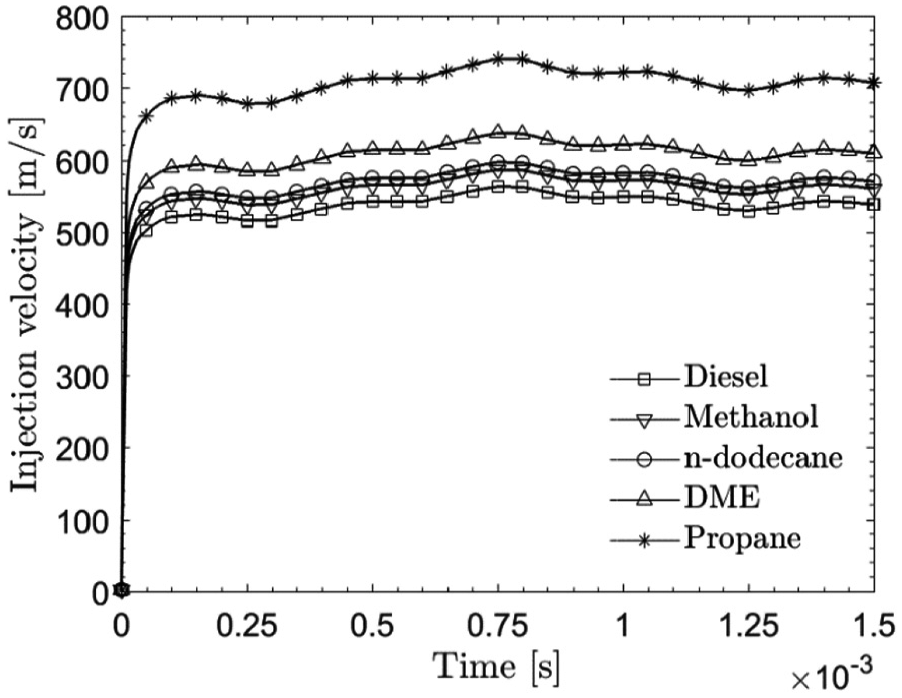
Injection velocity profiles for the different fuels.
Total injected fuel mass at t = 1.5 ms.
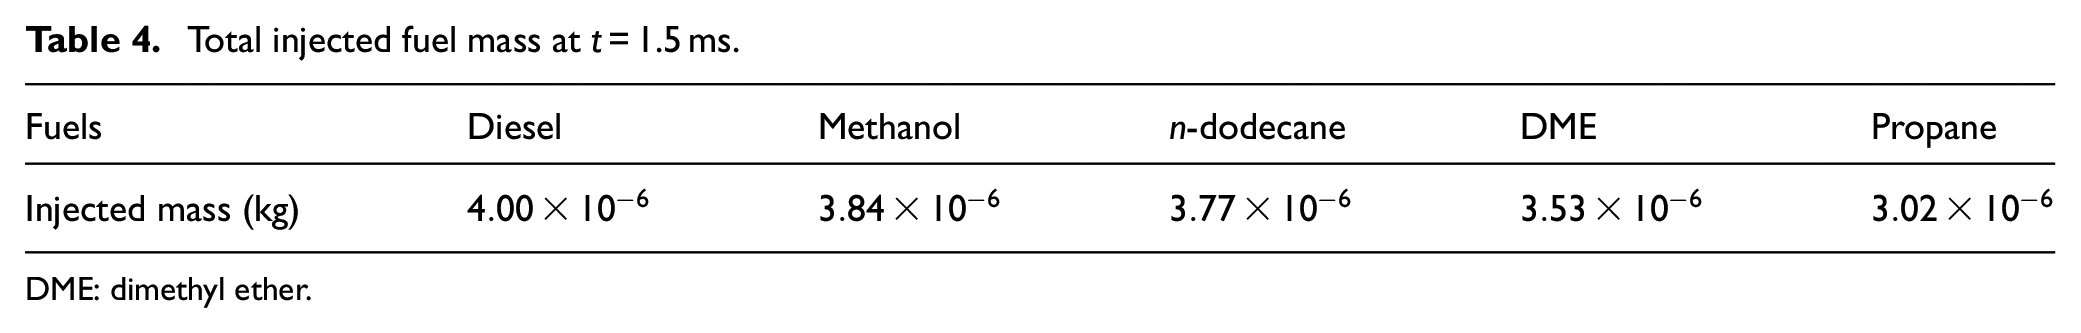
DME: dimethyl ether.
Recent DNS of Spray A
35
combining inner-nozzle simulation and the subsequent spray modeling using the volume of fluid (VOF) method suggests that at 1 mm distance from the nozzle exit the droplet sizes are very small, SMD = 0.5 µm being most probable. As explained previously in section “Droplet motion,” the present study utilizes a constant droplet size (i.e.
The geometry of the computational domain resembles the combustion vessel at Sandia National Laboratories (the geometry of the computational domain is not exactly similar to the experimental geometry but the total volume matches that in the experiments), for which the experimental validation data are obtained. The computational domain is shown in Figure 4. Close to the nozzle exit, 31 µm cells are used in the radial directions, while in the axial direction cells are 62.5 µm long (1:2 aspect ratio). Further away from the nozzle between 10 and 30 mm (110–335D), cubical 62.5 µm cells are used. Starting from 30 mm, 125 µm cells have been utilized. Such a refinement strategy yields, altogether, 13M cells. The chosen mesh resolution is based on validation studies with different mesh resolutions in the ECN Spray A configuration.9,11,28 These studies suggest that close to the nozzle, 62.5 µm cell size is sufficient for capturing the high gradients and mixing of vapor and surrounding air. Here, we use 31 µm cells near the nozzle in order to have better description for the shear layer dynamics and, consequently, for the fuel vapor mixing. The near-nozzle resolution is highly relevant for the observed
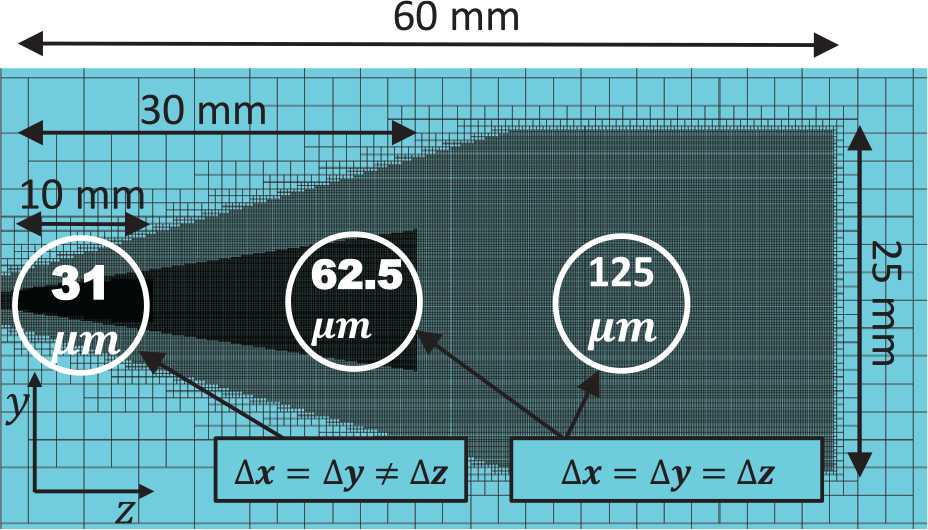
Computational mesh indicating local refinement areas.
Results
Spray A validation
First, the LES model is validated in the Spray A conditions using n-dodecane as the liquid fuel. Figure 5 shows the liquid and vapor penetrations along with the experimental data by considering five LES realizations. The present numerical results on average liquid penetration are somewhat overestimated compared to the experimental data. 45 The average liquid length between 0.2 and 1.5 ms is 11.7 mm compared to the average experimental penetration of 10.0 mm. Here, liquid penetration is defined according to the ECN guidelines by using 0.1% liquid volume fraction for the tip penetration. The average vapor penetration is noted to match well with the experimental data. 45 Here, vapor jet tip is obtained as the axial location of 0.1% fuel vapor concentration value according to the ECN guidelines.
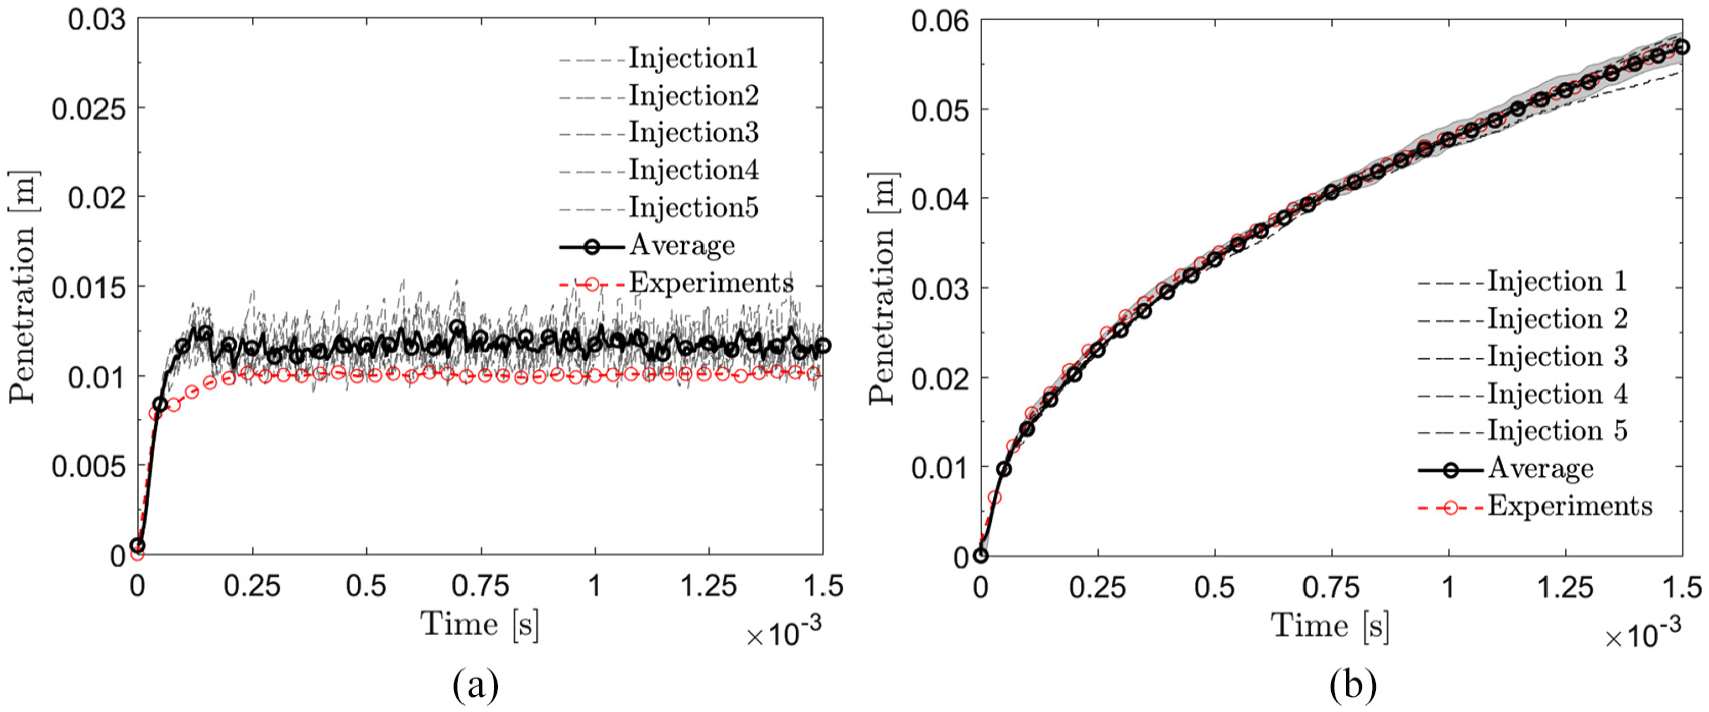
(a) Experimental and computational (LES) liquid length in Spray A conditions with n-dodecane. (b) Experimental and computational vapor penetration. The gray area indicates the experimental standard deviation.
Figure 6 shows a comparison of the predicted radial mixture fraction profiles and experimental data. 45 The mean values are well predicted for all downstream distances. The LES result has been first circumferentially averaged and then time averaged between 1.0 and 1.5 ms for the 17.8- to 28.8-mm axial distances and between 1.3 and 1.9 ms for the 40-mm distance. Finally, ensemble average is taken between the different injections. Root mean square (RMS) values are also compared to the experimental data in Figure 6. Relatively good comparison is seen except close to the spray axis. The deviation in the RMS values is partially related to the lower statistical accuracy in spatial averaging as the number of cells decreases when approaching the spray axis.
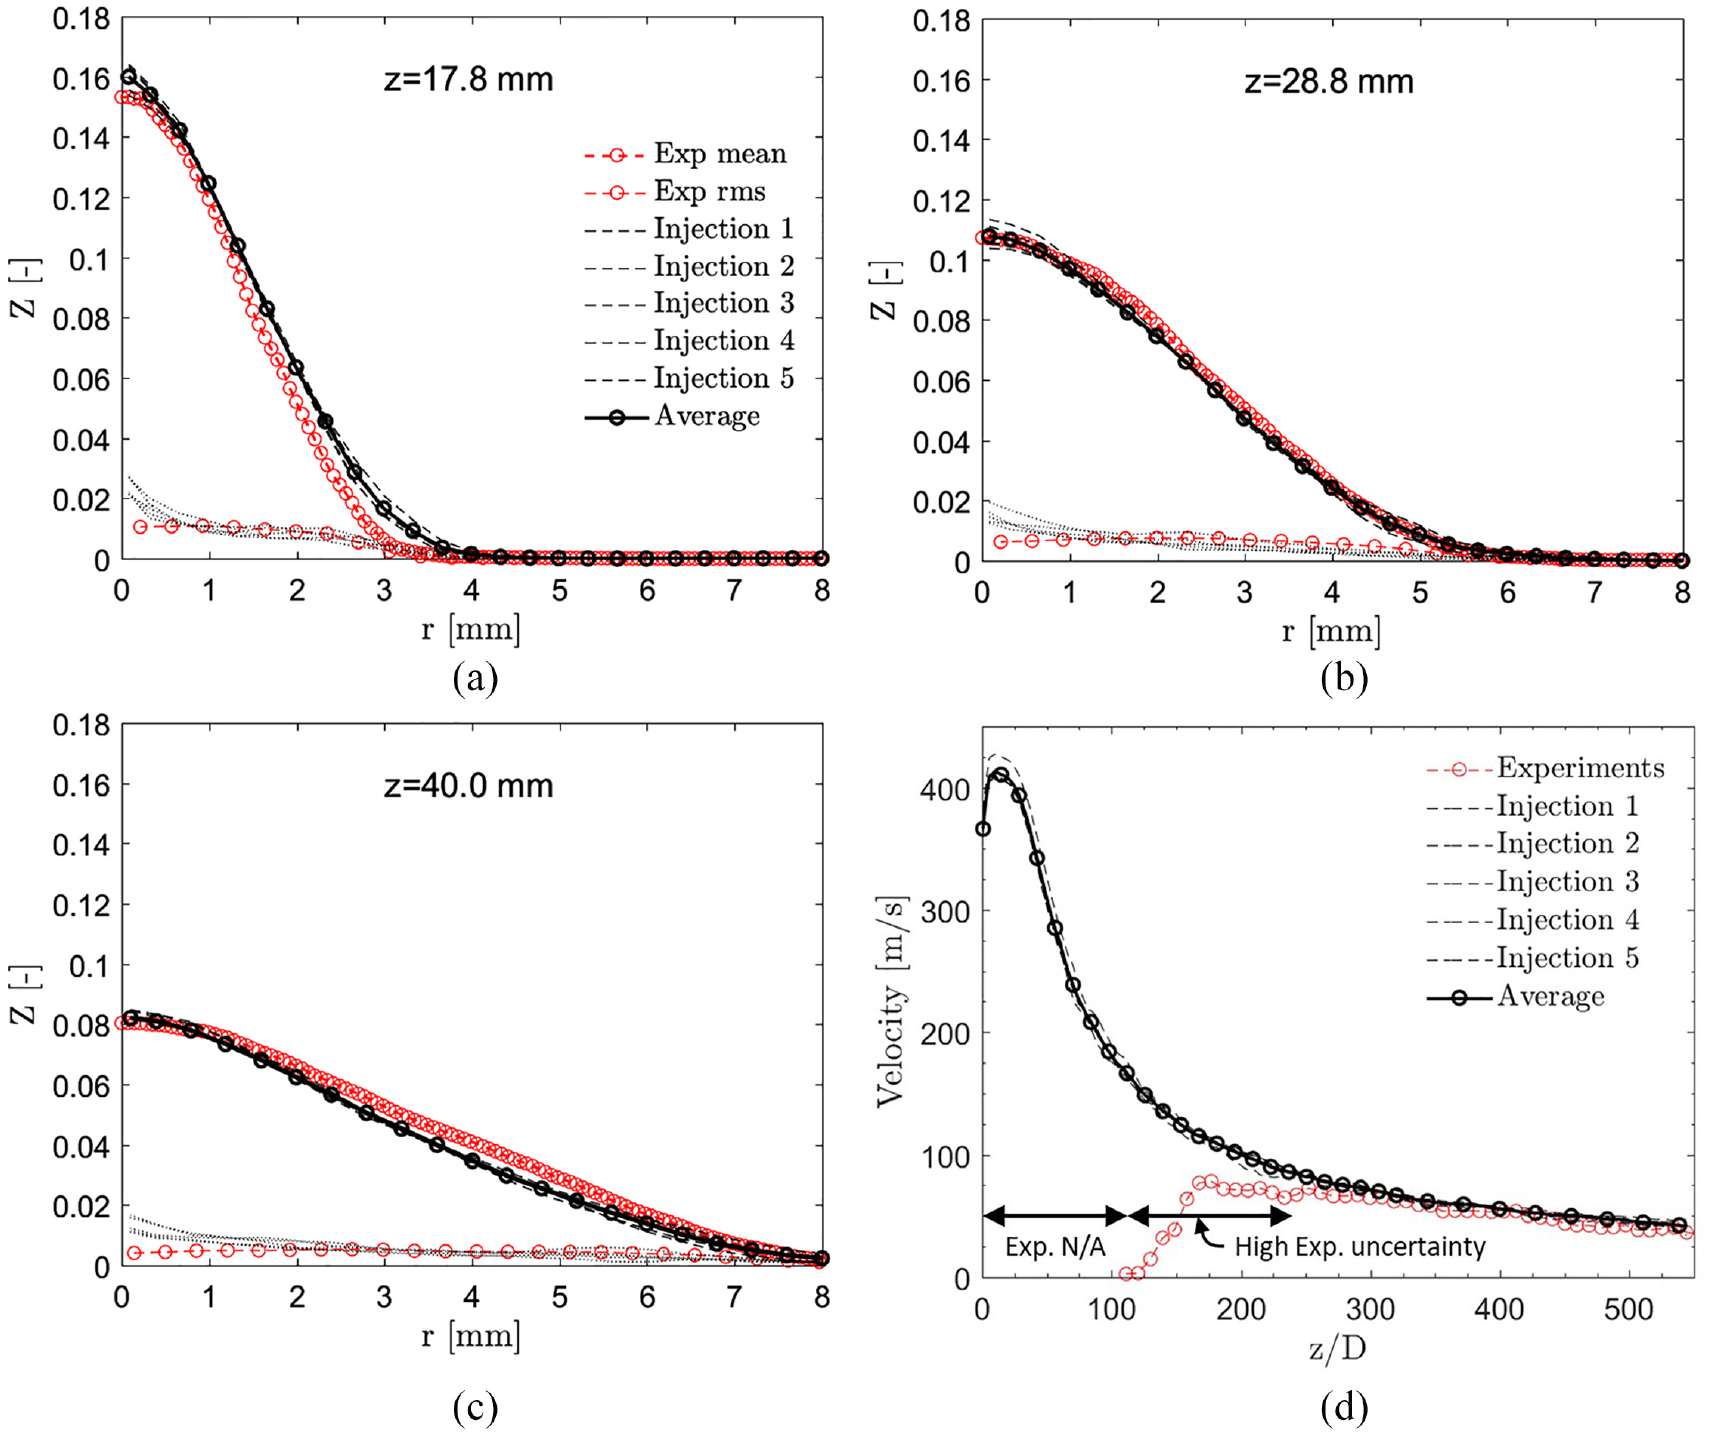
(a–c) Averaged radial mixture fraction
Figure 6(d) shows the mean gas phase velocity at the spray centerline. First, the velocity increases until z ≈ 6D from the nozzle followed by a short spray core region
Fuel property comparison
Next, the selected five fuels (diesel, methanol, n-dodecane, DME, and propane) are compared with one another. For n-dodecane, five realizations have been computed, whereas for the other fuels, three realizations are performed. First, liquid length is analyzed between the fuels after which the evaporation, vapor penetration, and mixing characteristics are shown. Finally, the equivalence ratio fields are studied for the selected fuels.
Liquid length
Figure 7 indicates visually how an LES/LPT model performs relatively close to the nozzle. Figure 8 depicts the average spray centerline velocity for the various fuels. Several aspects related to Figures 7 and 8 can be pointed out. (1) Within the spray core length
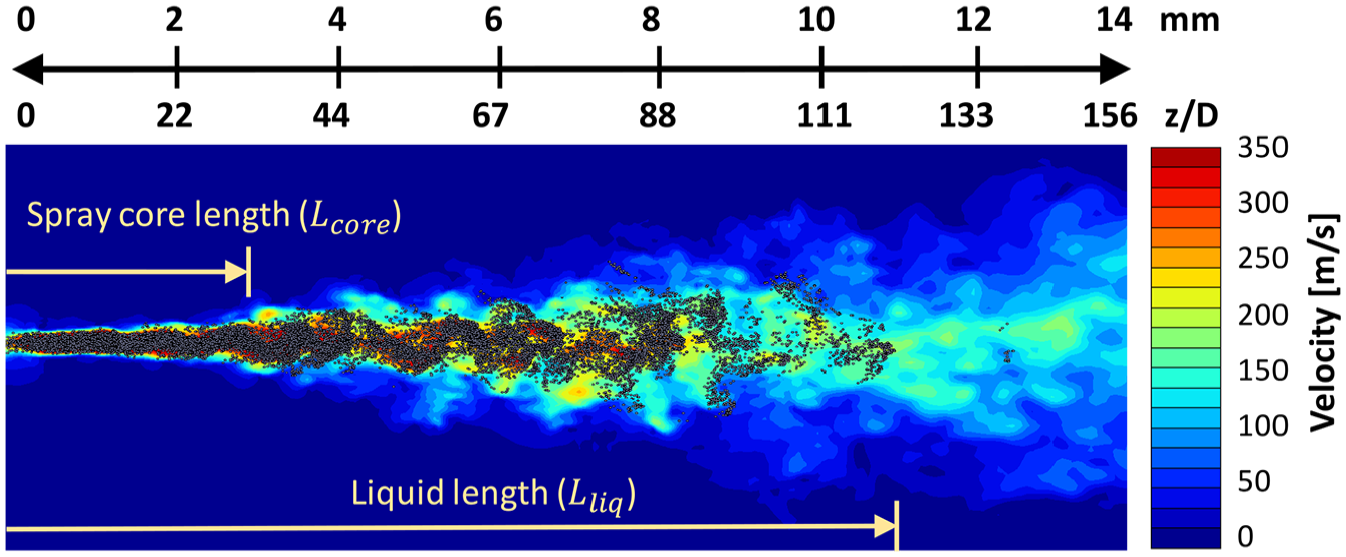
Near-nozzle region velocity field with droplets at t > 1 ms. The spray core and liquid lengths are shown.
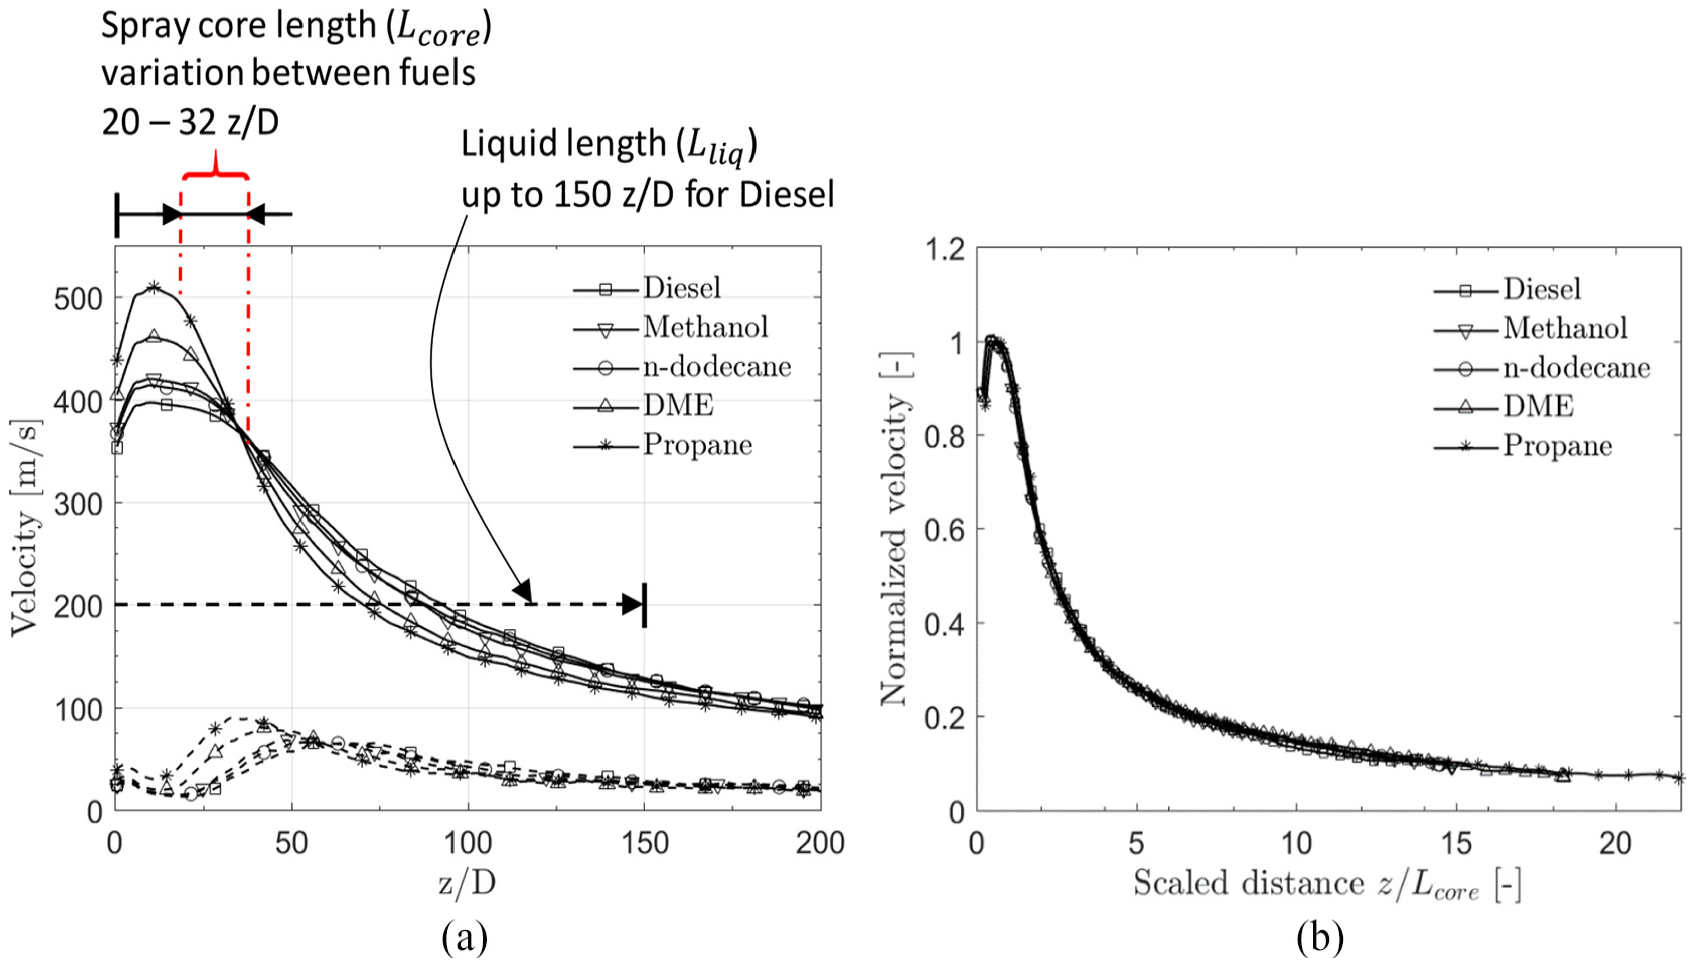
(a) Mean spray centerline velocity. RMS values are given with dashed lines. (b) Normalized velocity profiles indicating data collapse by normalization with peak axial velocity and Lcore.
The spray core lengths
Figure 9 shows the fuel concentration fields together with droplets at t = 0.5 ms. Large differences are observed in the liquid part of the sprays between the “long liquid length” fuels (diesel, n-dodecane, and methanol) and the “short liquid length” fuels (DME and propane). The relatively long liquid penetration of methanol is somewhat unexpected based on its vapor pressure curve (Figure 2(b)). However, this is related to the high latent heat of methanol that lowers the gas phase temperature during evaporation (see Figure 15).
13
It is worth noting that the stoichiometric isoline may deviate considerably within the spray envelope depending on the fuel. While the
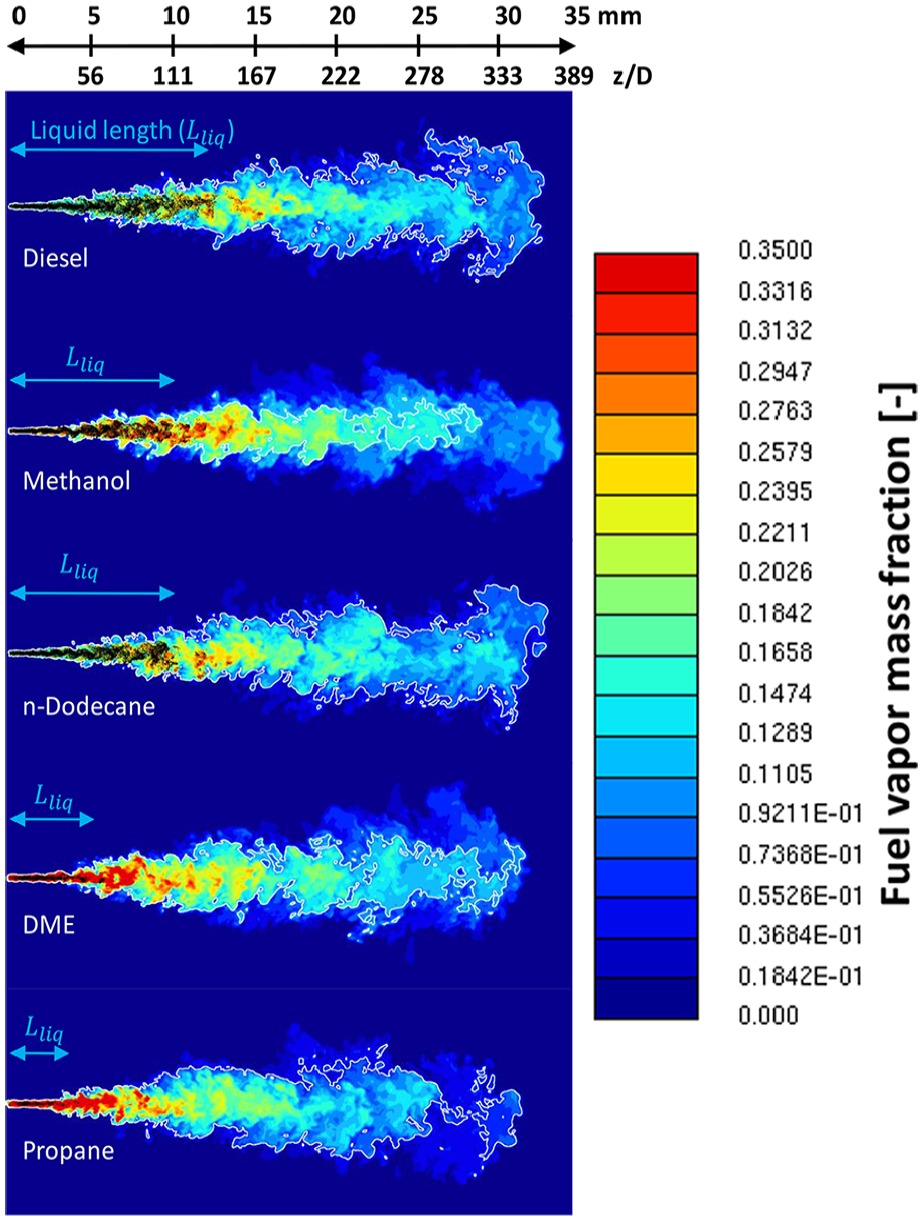
Fuel vapor mass fraction together with liquid droplets at t = 0.5 ms using 31 µm mesh density. The white line marks the
Figure 10(a) illustrates the obtained liquid lengths for the various fuels. The variation in the average liquid length (0.2–1.5 ms) between different LES realizations was less than 2% for all fuels. With relevance to the obtained spray core lengths for the fuels (Figure 8), Figure 10(b) correlates
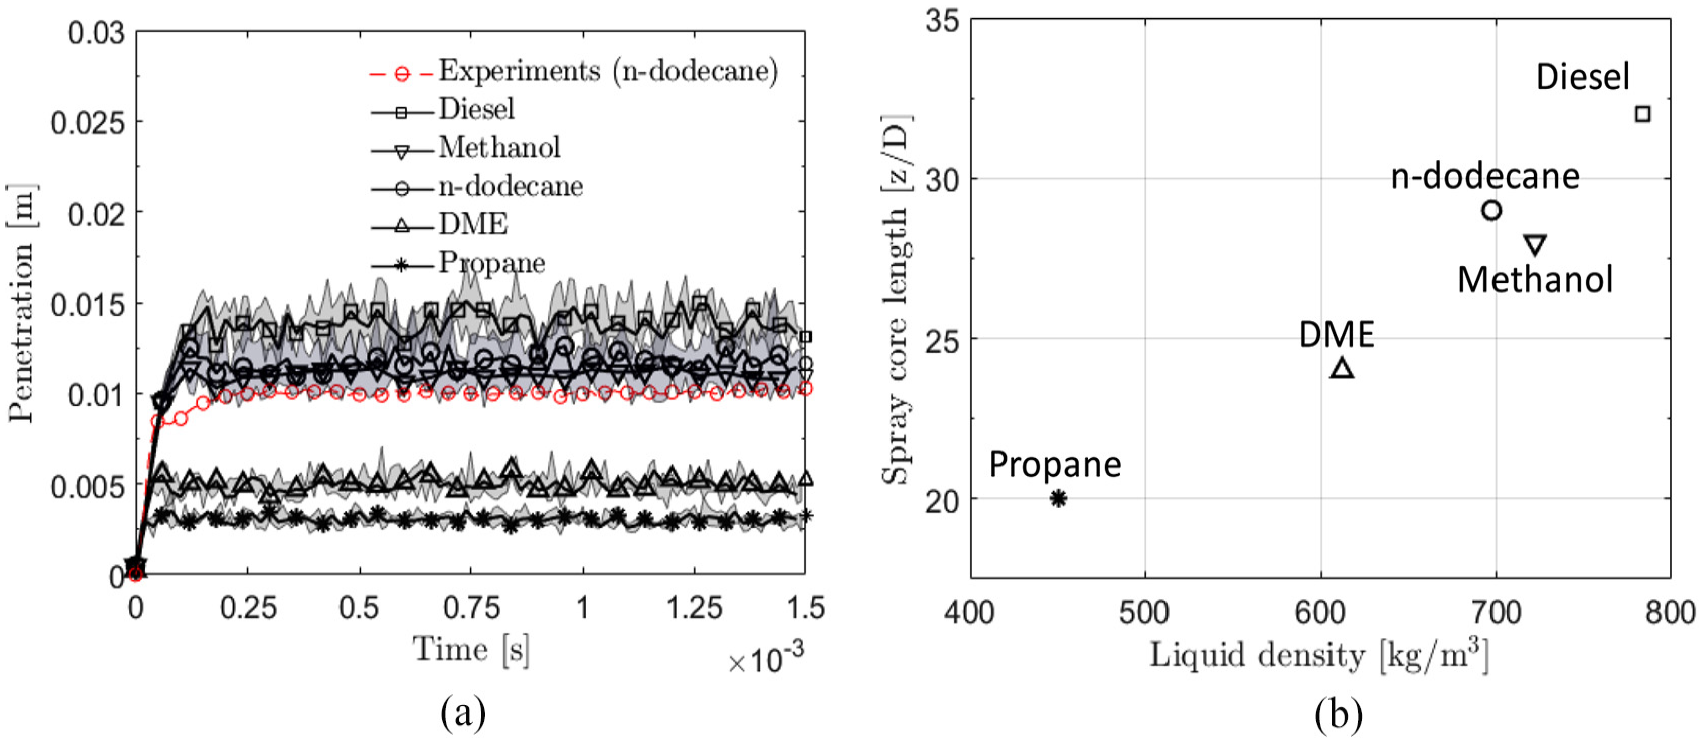
(a) Average liquid penetration. The shaded areas represent minimum/maximum values from different LES realizations. (b) The effect of liquid density on the spray core length
Figure 11(a) indicates a positive correlation between the fuel density and the average liquid length. The observation is qualitatively in line with the experimental results by Kook and Pickett
22
and Naber and Siebers.
46
Based on the classical understanding, the entrained ambient mass
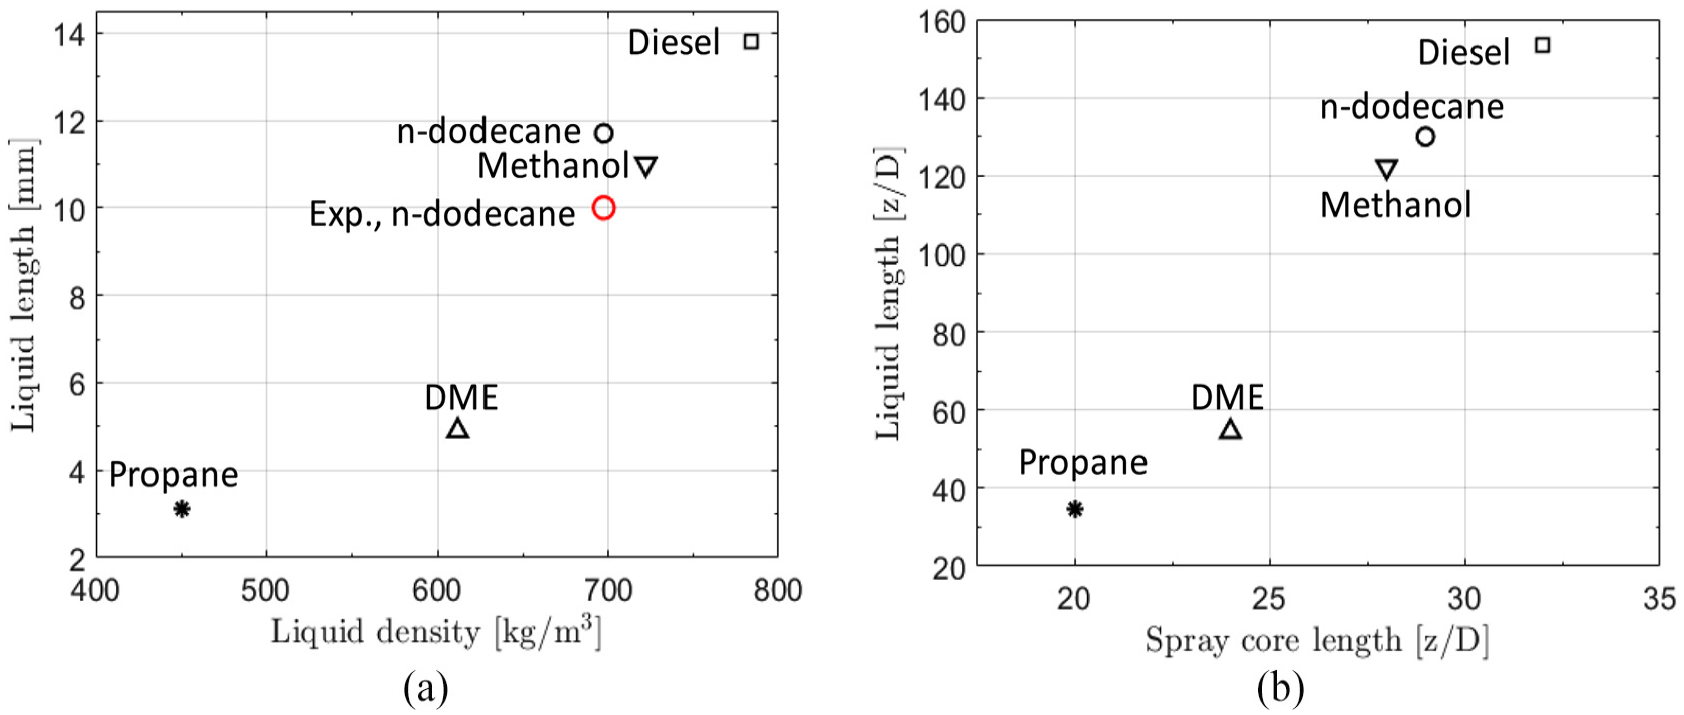
(a) Effect of fuel density on liquid length
With relevance to hypothesis 1, Figure 11(b) shows the correlation between
A numerical test on virtual fuels
According to Kook and Pickett, 22 the effect of liquid density on liquid length is not fully understood. In general, assessing this in experiments is challenging as the density and other properties of fuels are typically interlinked. On the other hand, in numerical simulations it is possible to assess variation in only a specific quantity. The idea here is to emulate a virtual diesel and DME in order to quantify the sole effect of density on the liquid length.
Next, such a virtual fuel test is used to assess the liquid density effect on liquid length. Two test cases are carried out. In the first case, diesel liquid density was scaled down to that of DME (“low density diesel”). All other properties were as in the original diesel fuel. In the second case, liquid density of DME was scaled up to that of diesel (“high density DME”). Again, all other properties were as in the original DME fuel. Obviously, consistent with the endeavor to maintain a constant injection pressure, the density changes affected the resulting injection velocity according to
Figure 12(a) shows the resulting liquid length as a function of time, while Figure 12(b) indicates the effect of liquid density on the average liquid length. A positive correlation is observed between
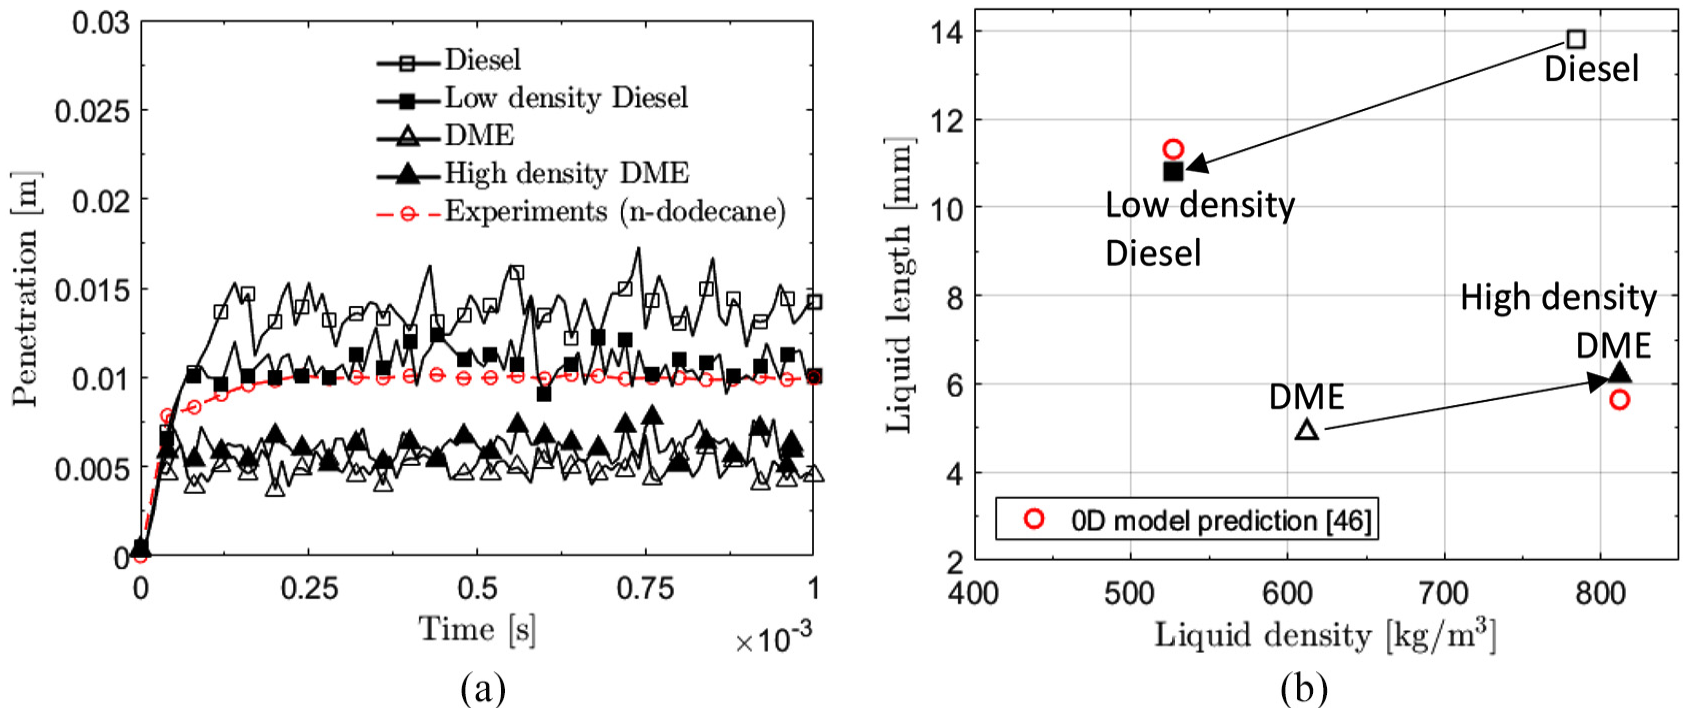
(a) Liquid penetration with modified liquid density. (b) Effect of changing liquid density on diesel and DME liquid length. Red symbols indicate a model prediction by Naber and Siebers. 46
Evaporation and mixing
Next, we analyze the differences in evaporation and mixing between the fuels. The analysis is started by considering vapor jet penetrations with focus on proper normalization. It is of particular interest to find a similarity relationship between the different fuels. Figure 13(a) illustrates the average penetrations for the fuels. It is noted that the higher the
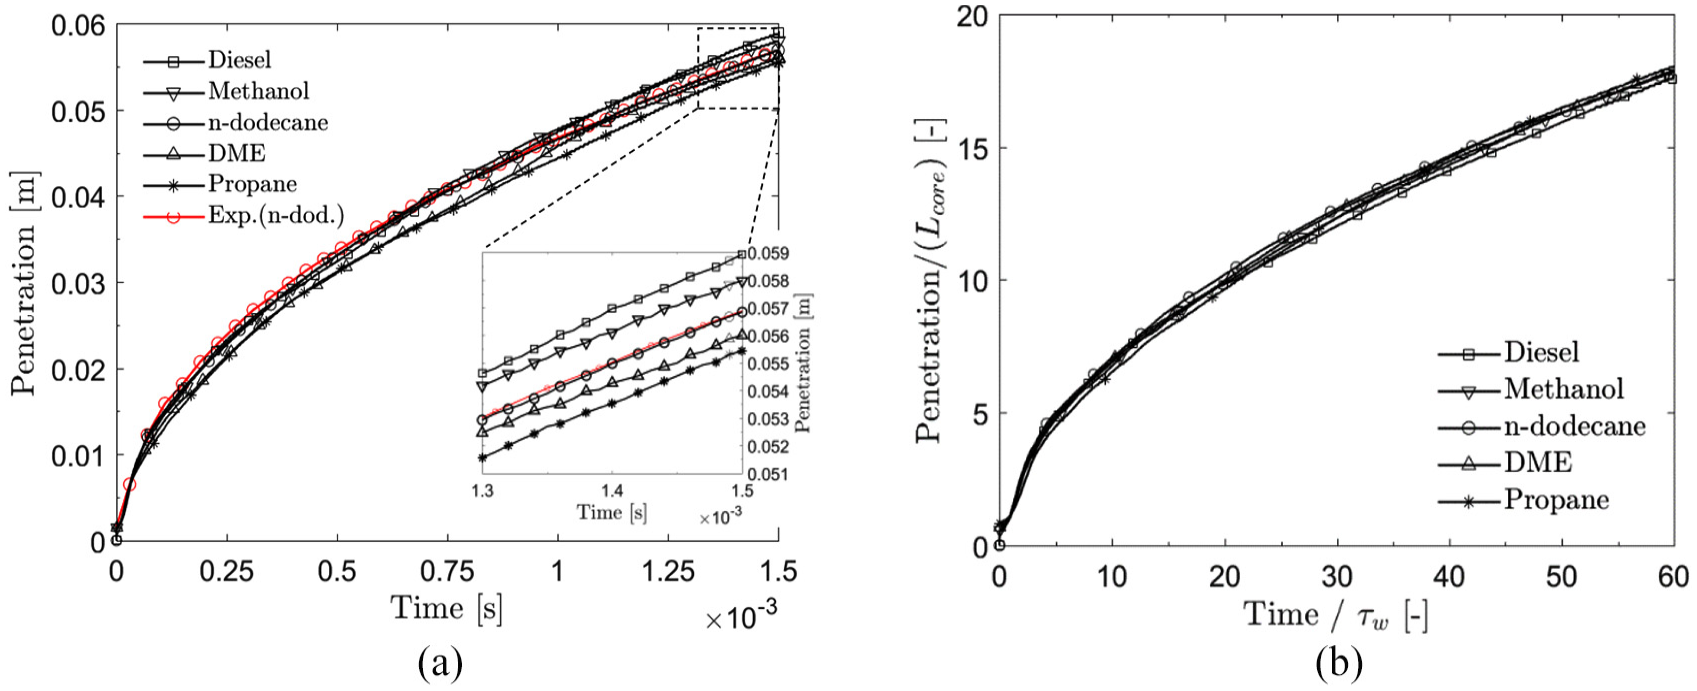
(a) Ensemble-averaged vapor penetration for the different fuels. It is observed that the vapor penetrations increase with higher
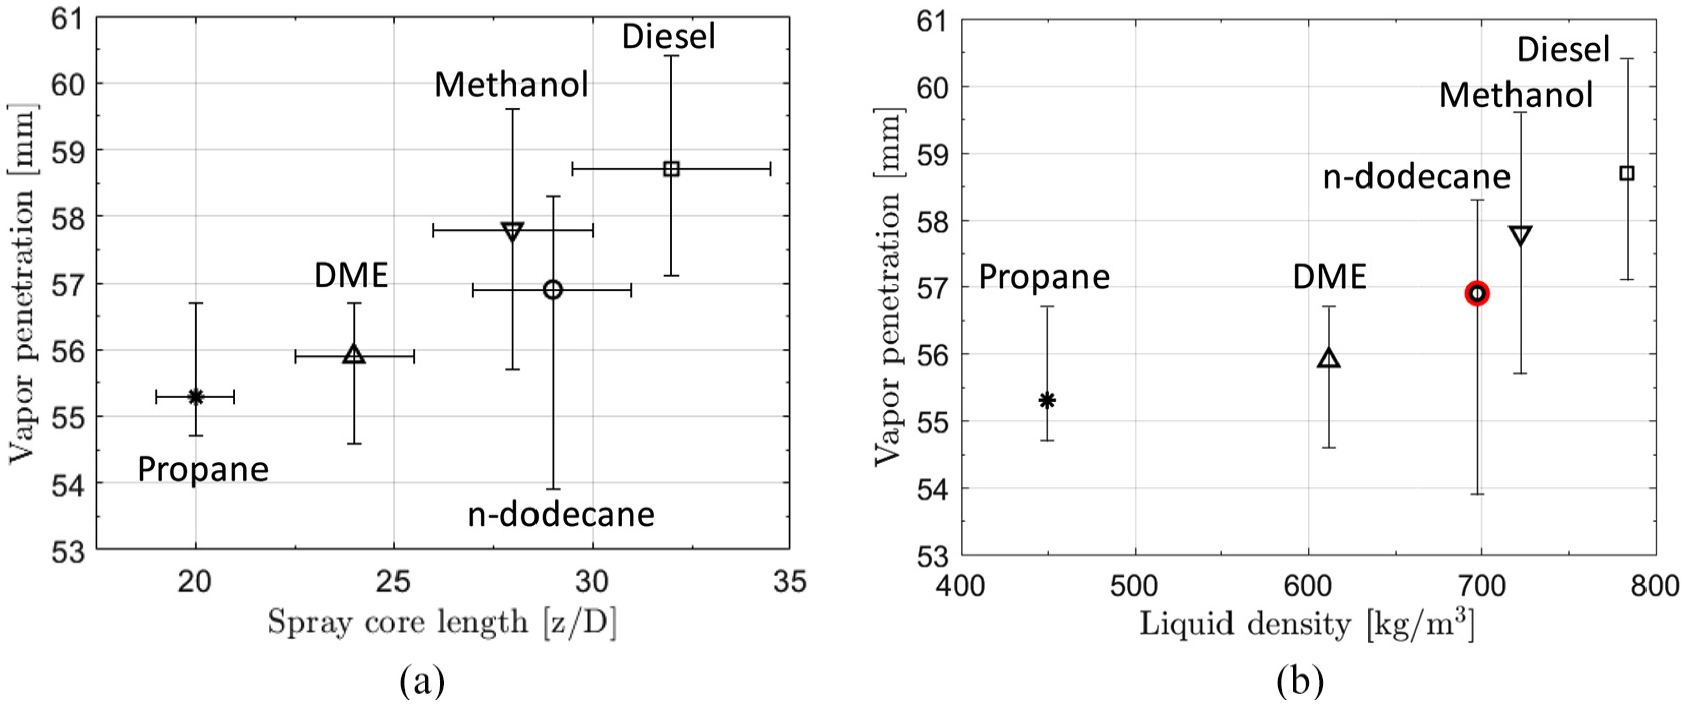
(a) Effect of spray core length
Earlier, it has been proposed that vapor penetration would not be related to liquid density.
22
The argument is that the fuel spray momentum flux
Figure 15 illustrates the mean spray centerline temperature of the gaseous phase. The low local temperatures close to the nozzle are noted to be approximately 450–550 K lower than the average gas phase temperature of 900 K. The lowest near-nozzle temperatures are observed with DME and propane. This is due to their very fast evaporation rate leading to a rich and cool mixture which is consistent with Figure 9 as well. Apart from the near-nozzle region, the very high latent heat of methanol is clearly seen as lower centerline temperature compared to the other fuels. Right after the liquid length (z > 125D), methanol has 70–130 K lower gas phase temperature compared to the other fuels. n-dodecane has the second highest latent heat which is reflected in equivalent centerline temperature. The low heat of evaporation of propane and low fuel concentration after the near-nozzle region is noted to result as the highest gas phase temperature.
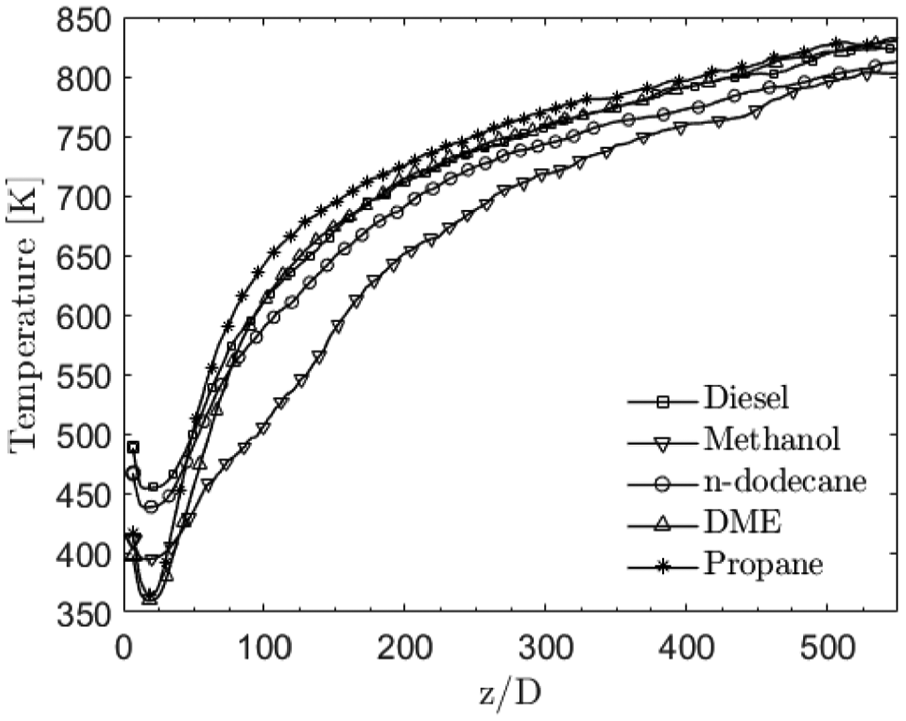
Mean gas phase temperature at the spray centerline. Rapid temperature increase is noted after
Equivalence ratio
Next, we examine the equivalence ratio
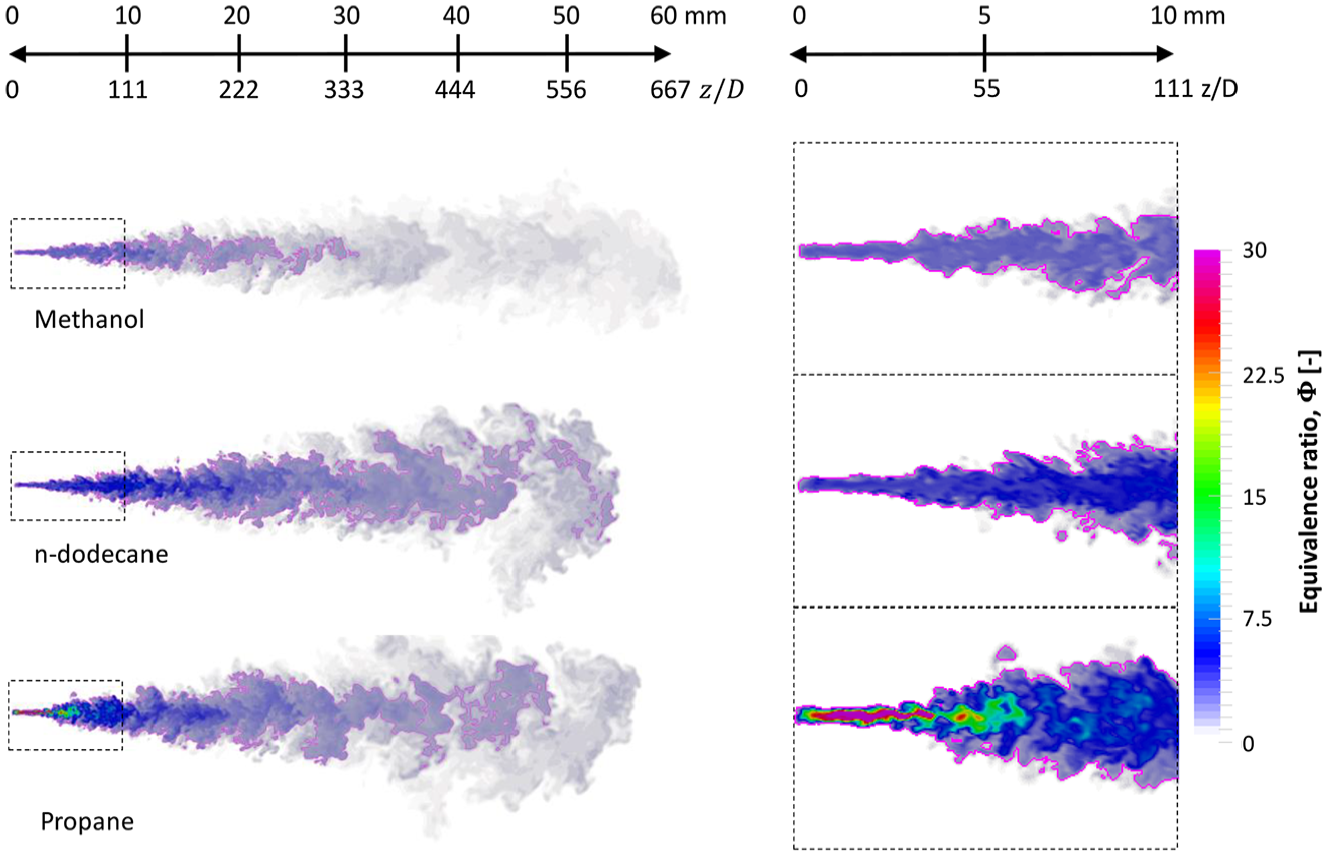
Equivalence ratio
Figure 17(a) shows the mean spray centerline mixture fraction, while Figure 17(b) presents the mean spray centerline equivalence ratio. Very high
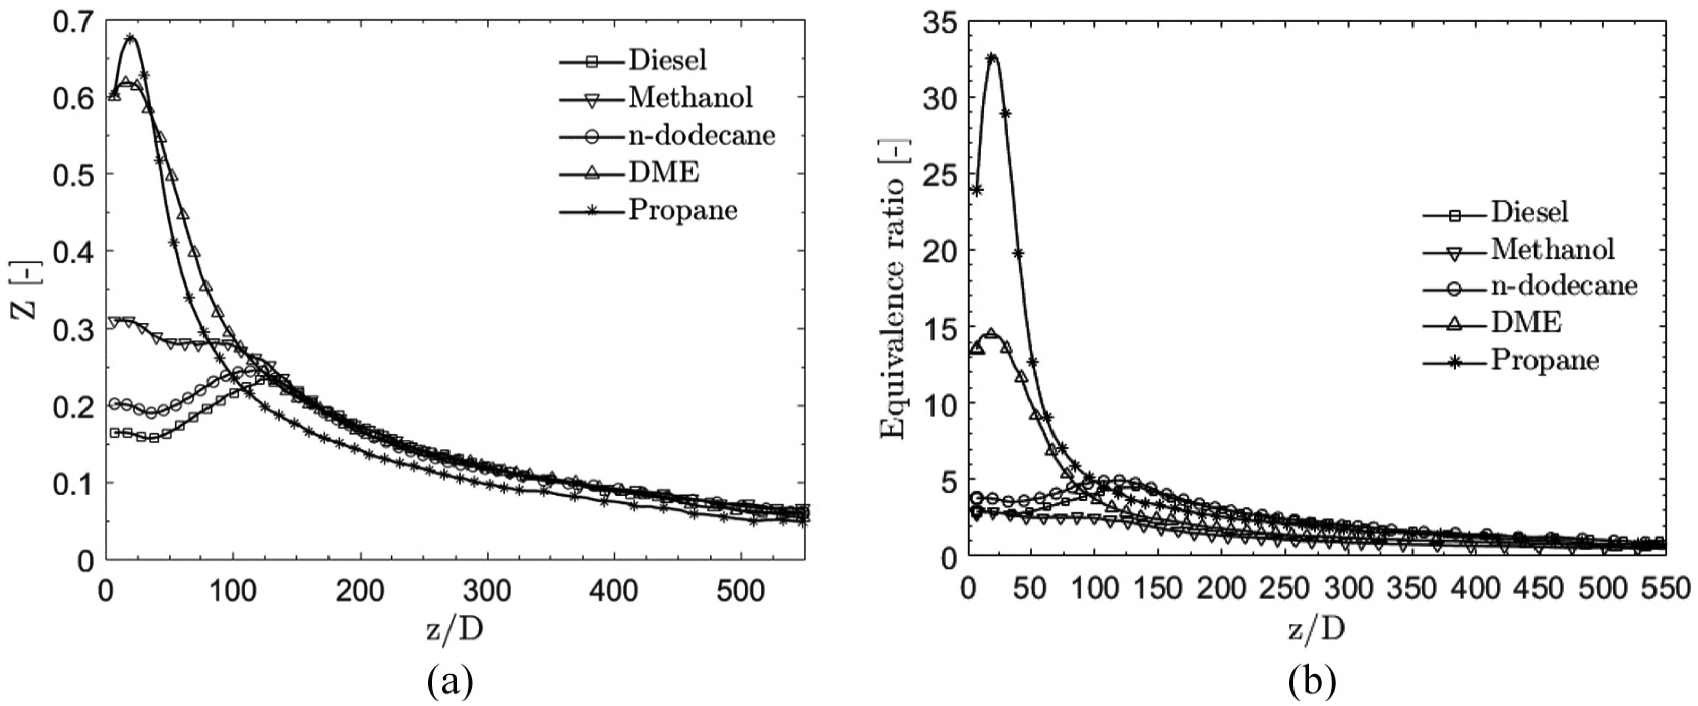
(a) Mean spray centerline mixture fraction for the fuels. Near-nozzle differences are noted to be high, while, further away from the nozzle, the profiles collapse with propane as an exception. (b) Mean spray centerline equivalence ratio
Conclusion
Here, diesel, methanol, n-dodecane, DME, and propane sprays were numerically compared using LES/LPT. The numerical setup was based on the ECN Spray A target conditions and the fuel was changed by keeping the injection pressure constant. As an obvious consequence, the injection velocity and fuel mass flow rates were affected. The modeling work presented here targets (1) to yield insight for modelers encountering complex spray cases with various fuels in their daily practices and (2) to provide a basis for potential experimental work on such fuel comparison. First, the LES/LPT model was validated in the ECN Spray A target condition with n-dodecane. Second, fuel comparison was carried out focusing mostly on the liquid lengths as well as on the vapor penetrations between the different fuels. The fuel–air mixing and the resulting equivalence ratio fields were also studied due to their paramount importance to, for example, emission formation under reacting conditions. Finally, also the injection-to-injection effects were analyzed. The main conclusions of the present study can be summarized as follows:
With relevance to hypothesis 1, a strong link between liquid length
A separate sensitivity test on virtual diesel and DME revealed that the virtual diesel with DME density did not yield the DME
Vapor jet penetration
The evaporative cooling effect of various fuels at the spray centerline is shown here for the first time. The local gas phase temperature for methanol was noted to be 70–130 K lower compared to the other fuels.
The study revealed significant differences in the local equivalence ratio fields for the fuels. Diesel, n-dodecane, and propane exhibited relatively similar equivalence ratio fields after the near-nozzle region. In contrast, DME and methanol showed much lower average equivalence ratios within the mixture.
Injection-to-injection variations were observed, and the variations were lower for liquid length (<2%) compared to vapor penetration (<4%). Fuels with longer vapor penetration/liquid length (diesel, n-dodecane, and propane) had also higher variation in vapor penetration /liquid length.
It should be noted that the present results are of numerical character. The discussed length scales are clearly linked to one another, but the relationship is inherently dependent on (1) near-nozzle modeling assumptions and (2) grid resolution. We note that presently very little is known on near-nozzle gas and liquid velocities. Here, an attempt was made to shed light on certain features of LES/LPT spray models. The present numerical model explains consistently the trends in fuel property variation for all the fuels. Based on the study, we note that experimental evidence of axial velocity profiles for z/D < 250 would be highly valuable for various fuels.
Footnotes
Appendix 1
Declaration of conflicting interests
The author(s) declared no potential conflicts of interest with respect to the research, authorship, and/or publication of this article.
Funding
The author(s) disclosed receipt of the following financial support for the research, authorship, and/or publication of this article: This work was supported by the European Union HERCULES-2 project within Horizon 2020 research and innovation program under grant agreement no. 634135. The present study has also been financially supported by the Academy of Finland (grant nos 289592 and 318024) and by the King Abdullah University of Science and Technology, Office of Sponsored Research (OSR) under Award OSR-2017-3319. The simulations presented above were performed using computer resources within the Aalto University School of Science “Science-IT” project.