
Abstract
Large-caliber water meter shells are prone to shrinkage porosity, wrinkles, air entrapment, slag inclusion, and other defects during the lost foam casting process. Taking the vertical spiral wing WS-100 water meter as the research object, through the analysis of the structure of the water meter shell, the flow field and temperature field of the design of outer bottom injection-vertical pouring, outer bottom injection-horizontal pouring and inner bottom injection-horizontal pouring involved in the filling and solidification process are numerically simulated and solve analysis, respectively. The results showed that: when the inner bottom injection-horizontal pouring process was adopted, the filling process of the casting was stable, the isolated liquid phase area of the solidification process was relatively small, and the possibility of forming defects was less. The casting performance is excellent, and the numerical analysis is verified to be effective.
Introduction
Large-caliber water meter, as an important water measurement instrument, is widely used in many important fields, such as water supply companies, residential communities, and other large enterprises. Among which, 60%–80% of the water supply of water companies is measured by large-caliber water meter. Therefore, the design and production of large-caliber water meter is of great significance to the economic benefits of water companies.1,2
Large-caliber water meter shell has the characteristics of complicated structure, uneven wall thickness, and the inner diameter of the cavity is larger than the port diameter, which will easily causes the difficulty in core pulling of the mold core. The inner cavity of the water meter shell needs to be processed to install the water meter movement, which requires small deformation of the casting. 3 The water meter shell needs to be connected by flanges due to the structure and working environment. Therefore, the two ends of the case have thick-walled flanges, which results in a large difference in shell wall thickness and complex structure. Traditional sand casting technology is difficult to meet these high casting accuracy requirements. Therefore, the solid casting (lost foam casting) technology is generally adopted for the casting process of large-caliber water meter.4–6 Compared with the traditional gravity casting process, the lost foam casting technology has a series of advantages, such as high precision, flexible design, high productivity, energy saving and environmental protection, and almost no machining allowance for castings, which is called “green engineering” in casting.7–9
Through the finite element simulation of the casting process, the morphological changes of molten metal filling can be intuitively observed, the flow field and temperature field involved in the filling process can be deeply analyzed, and the stress field and temperature field involved in the solidification process can be comprehensively solved. 10 In addition, the microstructure during the solidification process of the casting can be observed by numerical analysis. The growth process and stress distribution of the microscopic unit cell of some key parts of the casting are studied, which can effectively help developers analyze the casting theory and the defect mechanism. Therefore, the numerical analysis of lost foam casting is a relatively important research hotspot for practical production and an important way for the development of lost foam casting. Research on it has high practical value and theoretical significance. 11
The FDM numerical analysis technique was adopted by Jong and Hwang
12
to simulate the lost foam casting of aluminum alloy castings, the heat change and flow trajectory of the molten metal during the filling process were analyzed. FEM numerical analysis technology was used by Gurdogan et al.
13
to solve the flow field in the process of lost foam casting. Through experiments, the filling speed of the front metal liquid was obtained, the empirical formula of the filling speed was obtained by regression analysis. The 2D computational fluid dynamics simulations have been performed by Prabhakar et al.
14
to simulate the melt flow and solidification stages of the lead sandcasting process. The flow field model of traditional sand casting was modified by Chen et al.
15
The relationship between the flow rate of molten metal in the cavity and the flow velocity of molten metal at the filling front was added, and a calculation model for the flow field of the filling process of lost foam casting was established. By studying the relationship between the air gap pressure and the metal liquid pressure during the filling process, the SOLA-VOF algorithm was redefined by Mirbagheri et al.,
16
and the flow field in the filling process was solved. A numerical simulation approach based on the finite element casting software ProCAST has been developed by Sun et al.
17
The combination of machine learning and three dimensional numerical simulations for multi-objective optimization of low pressure die casting was studied by Shahane et al.
18
The solidification process of lost foam casting is basically similar to that of traditional sand casting. Therefore, its numerical analysis has been studied earlier, and fruitful research results have been obtained. The solidus method, critical solid fraction method, temperature gradient method, and the expression
In this study, the casting process numerical simulation software ProCAST is used to simulate the filling and solidification process of large-diameter ductile iron water meter casing castings. Based on the
Establishment of casting model of water meter shell
The basic principle of 0casting numerical simulation is to carry out the geometric finite dispersion of the casting forming system. The changes of flow field, temperature field in the casting process are analyzed through numerical calculation, and the distribution of casting defects is predicted.
Taking the vertical spiral wing WS-100 large-caliber water meter as the research object, the lost foam casting process is designed and analyzed based on the casting process requirements and structural characteristics. According to casting theory, three scientific pouring systems are drawn up and the three-dimensional models are established. In order to reduce the trial cost and design cycle caused by the traditional empirical method and trial-and-error method, casting simulation software ProCAST is used to establish the finite element simulation model of water meter shell casting.
The vertical spiral wing WS-100 large-caliber water meter is a common water measuring appliance, and it has the characteristics of small flow and superior performance. Even the small flow of water in a single family can also be accurately measured. The outer diameter of the internal screw-wing impeller is larger than the nominal diameter, can withstand greater flow, and has a larger range, making it be widely used. The basic structural size parameters of the vertical spiral wing WS-100 large-caliber water meter shell are shown in Figure 1.

Main size parameters of the vertical spiral wing WS-100 large-caliber water meter shell.
As shown in Figure 1, the basic outline size of the water meter shell is 370 mm × 200 mm × 200 mm. The structure is complex, the inner cavity diameter is larger than the port inner diameter, the cavity wall thickness is different, the minimum wall thickness is 6.5 mm, and the maximum wall thickness (M) is 40 mm. In addition, it also has special structures such as flanges, cross bars, and reinforcing ribs. The material of the water meter shell is QT450-10, the chemical composition and basic performance of the WS-100 water meter shell are shown in Table 1.
Main chemical composition of WS-100 water meter shell (wt%).

According to the structural characteristics and process requirements of the WS-100 water meter shell, vertical pouring bottom injection and horizontal pouring bottom injection are proposed to be adopted. In order to facilitate the later cleaning and removal of the pouring system to ensure the surface quality of the castings, a closed pouring system is adopted, and three pouring processes are designed: outer bottom injection-vertical pouring, outer bottom injection-horizontal pouring, and inner bottom injection-horizontal pouring. The three-dimensional diagrams of the proposed three pouring system designs are shown in Figure 2.

Schematic diagram of pouring system: (a) outer bottom injection-vertical, (b) outer bottom injection-horizontal, and (c) inner bottom injection- horizontal.
The three pouring methods all adopt the structural design of one sprue cup and two castings. The overall structure of the pouring system is symmetrical. Therefore, the symmetry plane function in the ProCAST software can be used in the simulation and only half of the pouring system is meshed to reduce the amount of simulation calculations and to improve the simulation efficiency. The three pouring systems divided by triangle mesh is shown in Figure 3. The grid sizes are set according to the variable mesh division method, as shown in Table 2.

Grid division diagram of pouring system: (a) outer bottom injection-vertical pouring, (b) outer bottom injection-horizontal pouring, and (c) inner bottom injection-horizontal pouring.
Meshing situation.

By checking the thermal properties of the material, set the material of the sprue cup to QT450-10, the initial filling is 0, and the initial temperature is 1500°C. The material of the casting and runner is defined as Foam, the initial filling is set to 100%, and the initial temperature is 25°C. The material of the virtual sand box is defined as Sand Permeable Foam, the initial filling is set to 100%, and the initial temperature is 25°C.
The boundary conditions of pouring system can be set in the Process Condition Manager of the ProCAST. The symmetry plane is selected as the symmetric boundary condition to simplify the simulation calculation. Set the thermal boundary temperature condition of the outer surface of the virtual flask and the outer surface of the sprue cup to the Air cooling, and the heat transfer coefficient value is h = 10 W/m2·k. Adding pressure interface conditions to areas outside the surface of the sprue cup P = 0.05 MPa. Since the upper surface of the flask defaults to atmospheric pressure, it is equivalent to adding a negative pressure of 0.05 MPa to the area outside the surface of the sprue cup.
In ProCAST, the mass source of molten metal can be added through Inlet, that is, the mass of molten metal that needs to be poured per second is calculated through the pouring time and the volume and density of the casting. The specific calculation shown in equation (1).
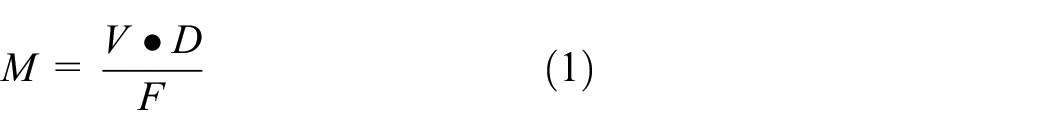
where, M is the mass of molten metal filled per unit time (kg/s), V is the total volume of castings and runners (m3), D is the density of molten metal (kg/m3), F is the casting time (s).
Since ladle pouring is generally used in the actual production process, the flow of molten metal is controlled according to the actual pouring situation, but rarely based on the filling time, so the mass source of pouring is controlled by setting the initial liquid velocity of the sprue cup. The initial velocity of the liquid is calculated according to equation (2).

where, V is the initial velocity of molten metal (m/s), g is the acceleration of gravity, its value is 9.8 m/s2, h is the height of the ladle from the sprue cup (m).
In actual pouring, in order to prevent the cooling, oxidation, and splashing of the molten metal, the distance between the ladle and the sprue cup is generally set to 0.05–0.15 m. Taking h = 0.1 m into equation (2), the initial velocity can be calculated as V = 1.4 m/s.
Structural optimization and simulation Analysis
Analysis of outer bottom injection-vertical pouring
Figure 4 shows the temperature field changes during the filling process of the casting under outer bottom injection-vertical pouring. Colors are used to indicate the changes in the temperature of the molten metal at different stages. In general, as the filling process progresses, the temperature of the molten metal front drops sharply. During the filling process, the foam pattern is pyrolyzed layer by layer, and the air gap layer moves upward with the filling, ensuring the layer-by-layer filling of the molten metal. The entire filling process is relatively stable and the filling speed is fast.

Temperature field during filling process of outer bottom injection-vertical pouring: (a) t = 3.2454 s, filling = 10.9%, (b) t = 4.5354 s, filling = 44.3%, (c) t = 6.6854 s, filling = 66.2%, and (d) t = 9.9855 s, filling = 98%.
It can be found from Figure 4 that in the initial stage of 3.2 s, the molten metal only filled 10.9% (Figure 4a), the subsequent 3.4 s filled 55.3% (Figure 4(a)–(c)), and the final stage of 3.3 s also only filled 31.8% (Figure 4(c) and (d)), so the filling speed in the whole filling process shows a change from slow to fast and then slow. In the initial stage, the molten metal has a high temperature, and a large amount of decomposition gas is generated at the moment when the pattern is decomposed. These gases cannot completely escape due to the influence of the coating and the permeability of the sand mold. At the same time, the molten metal is filling the sprue, the direction of part escaping decomposition gas is opposite to the filling direction of the molten metal, resulting in an increase in the air gap pressure at the front of the molten metal filling and slowing down the speed of the molten metal filling. At this stage, due to the complex pyrolysis reaction of the foam, the temperature gradient of the molten metal front is relatively large, as shown in Figure 4(a), which is directly changed from red to purple. Then, as the filling process progresses, the molten metal begins to fill the cavity gradually, the contact area with the foam gradually increases, and the temperature of the molten metal gradually decreases. The gas escape direction is basically the same as the filling direction of the molten metal, the filling capacity is improved, and the filling speed is accelerated. The filling speed reaches the maximum value in Figure 4(b). At this time, the contact area between the front metal liquid and the foam is almost the largest, and the front air gap is also the most obvious in the entire filling process. After that, because the filling front is far away from the heat source, the temperature of the molten metal is further reduced and the foam in the cavity is basically pyrolyzed, the back pressure is large, the filling capacity is reduced, and the filling speed is gradually slowed down. At this time, the overall temperature level of the molten metal is gradually increased, as shown in Figure 4(c). When t = 9.9855 s, the filling is 98%. Due to the influence of the sprue and sprue cup, the filling is generally completed by default when the filling reaches 98% in the simulation. Due to the uneven wall thickness of the casting and the different distance from the heat source, the temperature on the casting presents a gradient cross distribution, that is, part of the high temperature area is surrounded by a low temperature area, such as the M point in Figure 4(d). If the subsequent liquid metal cannot be supplemented during solidification, isolated liquid phase regions are prone to form defects such as shrinkage porosity and shrinkage cavities.
Figure 5 shows the change of temperature field and solid phase ratio during solidification process under outer bottom injection-vertical pouring. Colors are used to indicate the solid phase ratio at different positions during the solidification of the casting. It can be seen from Figure 5(a) that at the beginning of solidification, the temperature away from the pouring cup and the corners of the casting starts to be lower than the liquidus temperature of the casting, and the temperature field at the thicker wall of the casting is distributed as a ring. The molten metal inside the runner still has a high temperature and a certain degree of fluidity, which can play a certain feeding effect during the solidification process. As time goes by, it solidifies gradually. Due to the uneven wall thickness of the casting cavity, the solidification speed at the thicker wall is slower than that of the thinner wall, so it is easy to form an isolated liquid phase area at the thicker wall, as shown in Figure 5(b). When the entire solidification process reaches 83.3%, it can be seen from Figure 5(c) that most of the casting section has been solidified, only the upper and lower flanges and the reinforcing ribs have a low solid phase ratio of the liquid, and the lower flange is connected to the runner. Therefore, in the process of solidification and cold shrinkage, the lower flange can be supplemented by the runner molten metal, and the point N is the final solidification point of the casting. The entire casting solidification process is completed in about 549 s, as showed in Figure 5(d), the height of the molten metal in the runner decreased significantly due to cold shrinkage.

Solid phase ratio during solidification process of outer bottom injection-vertical pouring: (a) temperature field at 0% solidification, (b) solid phase ratio at 51.3% solidification, (c) solid phase ratio at 83.3% solidification, and (d) solid phase ratio at 100% solidification.
Figure 6 shows the distribution of shrinkage cavity and porosity inside the casting under the outer bottom injection-vertical pouring. It can be seen from Figure 6 that the isolated liquid phase region during the solidification process is easy to form shrinkage cavities, which affects the quality of the casting. Among them, due to the thicker wall of the upper flange, the internally predicted shrinkage porosity defect area is larger. While, the lower flange has a feeding effect when the runner is solidified, so the defect area is significantly reduced. In addition, the reserved through hole at the port of the water meter shell is also an area where shrinkage cavity defects are easily formed due to the thicker wall.

Distribution of shrinkage porosity in the outer bottom injection-vertical pouring.
In summary, the molten metal rises steadily during the casting process under the outer bottom injection-vertical pouring system, and there is no phenomenon such as back spray during the filling process. The predicted defects such as shrinkage porosity are mostly located at the flange and the water meter port, and it is mostly concentrated in the case of 5% shrinkage porosity, which is a theoretically good casting method. However, due to the special structure of the WS-100 water meter shell casting, the outer bottom injection casting system may cause the molten metal to break through the coating layer and contact the sand mold, forming a sticky sand defect.
Analysis of outer bottom injection-horizontal pouring
Figure 7 is a schematic diagram of the change of temperature field during the filling process under the outer bottom injection-horizontal pouring system. The entire filling process is relatively fast, and due to the large amount of foam in the runner, a large amount of heat is taken away during pyrolysis, making the casting complete with a lower temperature.
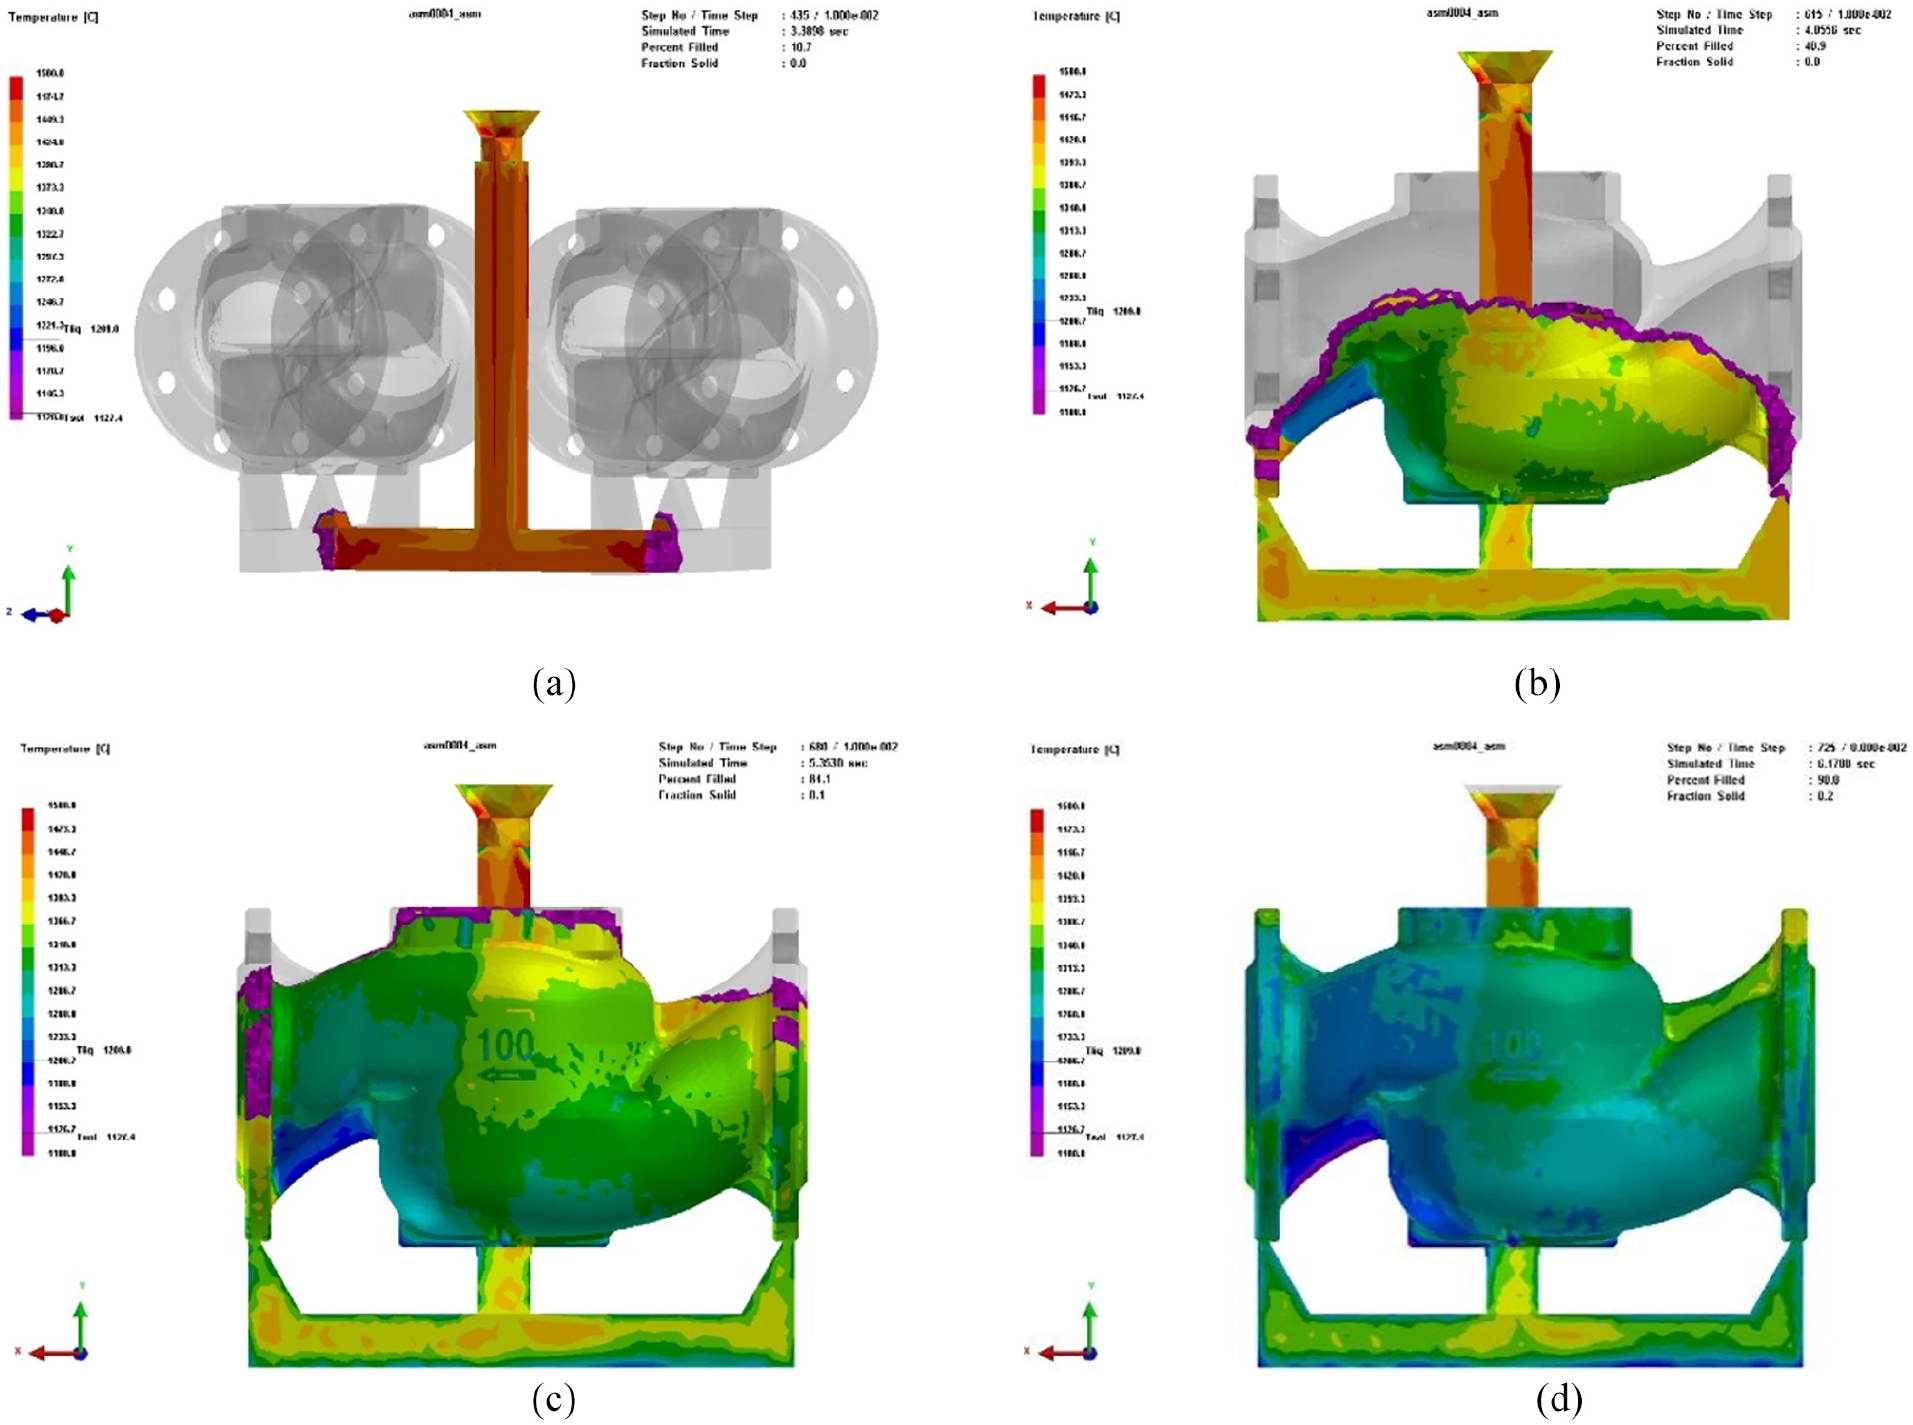
Temperature field during filling process of outer bottom injection-horizontal pouring: (a) t = 3.3898 s, filling = 10.7%, (b) t = 4.8856 s, filling = 48.9%, (c) t = 5.3530 s, filling = 84.1%, and (d) t = 6.1708 s, filling = 98%.
As shown in Figure 7(a), in the initial stage, the molten metal temperature is relatively high, the pyrolysis gas volume is large, and back pressure of the air gap is high, resulting in a slow filling speed. The filling process only completes 10.7% in 3.3898 s. At the initial stage of filling in lost foam casting, the entire cavity is not empty but filled with white molds, which causes the molten metal to sequentially pyrolyze and replace the white molds during the filling, and the entire runner cannot be filled instantly. When t = 4.8856 s, the molten metal completes the filling of the entire runner, and the filling process completes 48.9%, which is close to half, as shown in Figure 7(b). Due to the large amount of heat taken away when the molten metal fills the runner, when t = 5.3530 s, the filling process completes 84.1%, and the casting has begun to solidify, as shown in Figure 7(c). At the reinforcing ribs of the casting, because it is far away from the heat source, the temperature is close to the liquidus temperature and solidification occurs. Due to the slightly lower temperature of the molten metal, the instantaneous pyrolysis ability of the foam is weakened, the filling capacity is improved and there are three gates for filling, the molten metal has a faster filling speed, and 98% of the filling process has been completed at t = 6.1708 s.
Since the molten metal enters the casting cavity from three different internal gates, the time and temperature are different, resulting in the instability of the filling process, the unconspicuous of the temperature gradient, vortex, splashing, and entrapment are prone to occur at the front of molten metal. As shown in Figure 7(d), various color blocks cross each other without obvious division. There are more island-type color blocks, which reflects the mutual blending of metal liquids at different temperatures during the filling process, rather than showing a gradient layer by layer filling.
Figure 8 shows the solid phase ratio during the filling process of the outer bottom injection-horizontal pouring system. When t = 6.1708 s, the casting is completely filled and begins to solidify. In the initial stage, the temperature of some edge positions is already below the liquidus temperature, and the overall solidification rate is 0.2%, as shown in Figure 8(a). When t = 73.7908 s, the solidification rate is 51.3%, as shown in Figure 8(b). Due to the low temperature of the molten metal and poor fluidity, the front-end molten metal is not easily to be replenished by the subsequent molten metal during solidification. Shrinkage cavities and porosity appear in areas where the solidification is faster, and some even have insufficient pouring. Figure 8(c) shows several final solidification areas, most of which are thick-walled flanges, which conform to the solidification law of lost foam. It can be seen from Figure 8(d) that there are many insufficient pouring at the top of the casting, of which the thin wall of the cavity is the most serious, and there are also varying degrees of insufficient pouring at the top flange and thread.

Solid phase ratio during solidification process of outer bottom injection-horizontal pouring: (a) solid phase ratio at 0.2% solidification, (b) solid phase ratio at 51.3% solidification, (c) solid phase ratio at 89.7% solidification, and (d) top solid phase ratio at 100% solidification.
The entire filling process of lost foam casting is carried out under negative pressure. Due to the negative pressure, the inner filling of the molten metal is prone to the wall effect, that is, the molten metal will preferentially spread along the cavity wall under the negative pressure, rather than the horizontal liquid level rising. This will easily lead to the cavity wall to be filled when the filling is completed, but the interior may still be a cavity, or even an insufficiently poured area.
It can be seen from Figure 9 that the flange plate has only a small under-pouring defect from the outside, but the under-pouring defect of its internal section is much larger than that observed from the outside. This is caused by the phenomenon of molten metal adhering to the wall under negative pressure. Therefore, the casting of lost foam cannot be judged by its appearance alone, and it needs to be sliced and analyzed according to the casting situation.

Insufficient pouring of casting flange.
In summary, in the casting process under the outer bottom injection-horizontal pouring system, the molten metal filling process is not stable, the temperature gradient of the molten metal crosses each other in the cavity, and it cannot be filled from bottom to top layer by layer. In addition, when the casting is solidified, there is a defect of insufficient pouring, which leads to leaks in the casting cavity and scrap. It is an undesirable pouring method.
Analysis of inner bottom injection-horizontal pouring
Figure 10 is a schematic diagram of the change of temperature field during the filling process under the inner bottom injection-horizontal pouring system. Because there is only one inner gate, so the design of bottom injection type is adopted, and the overall filling process is similar to the outer bottom injection-vertical pouring system. During the whole filling process, the molten metal rises steadily, the molten metal is filled layer by layer, and the temperature is lowered from bottom to top of the casting, and the boundary of the temperature field is clear. The filling speed of the molten metal conforms to the law of slow to fast and then slow.
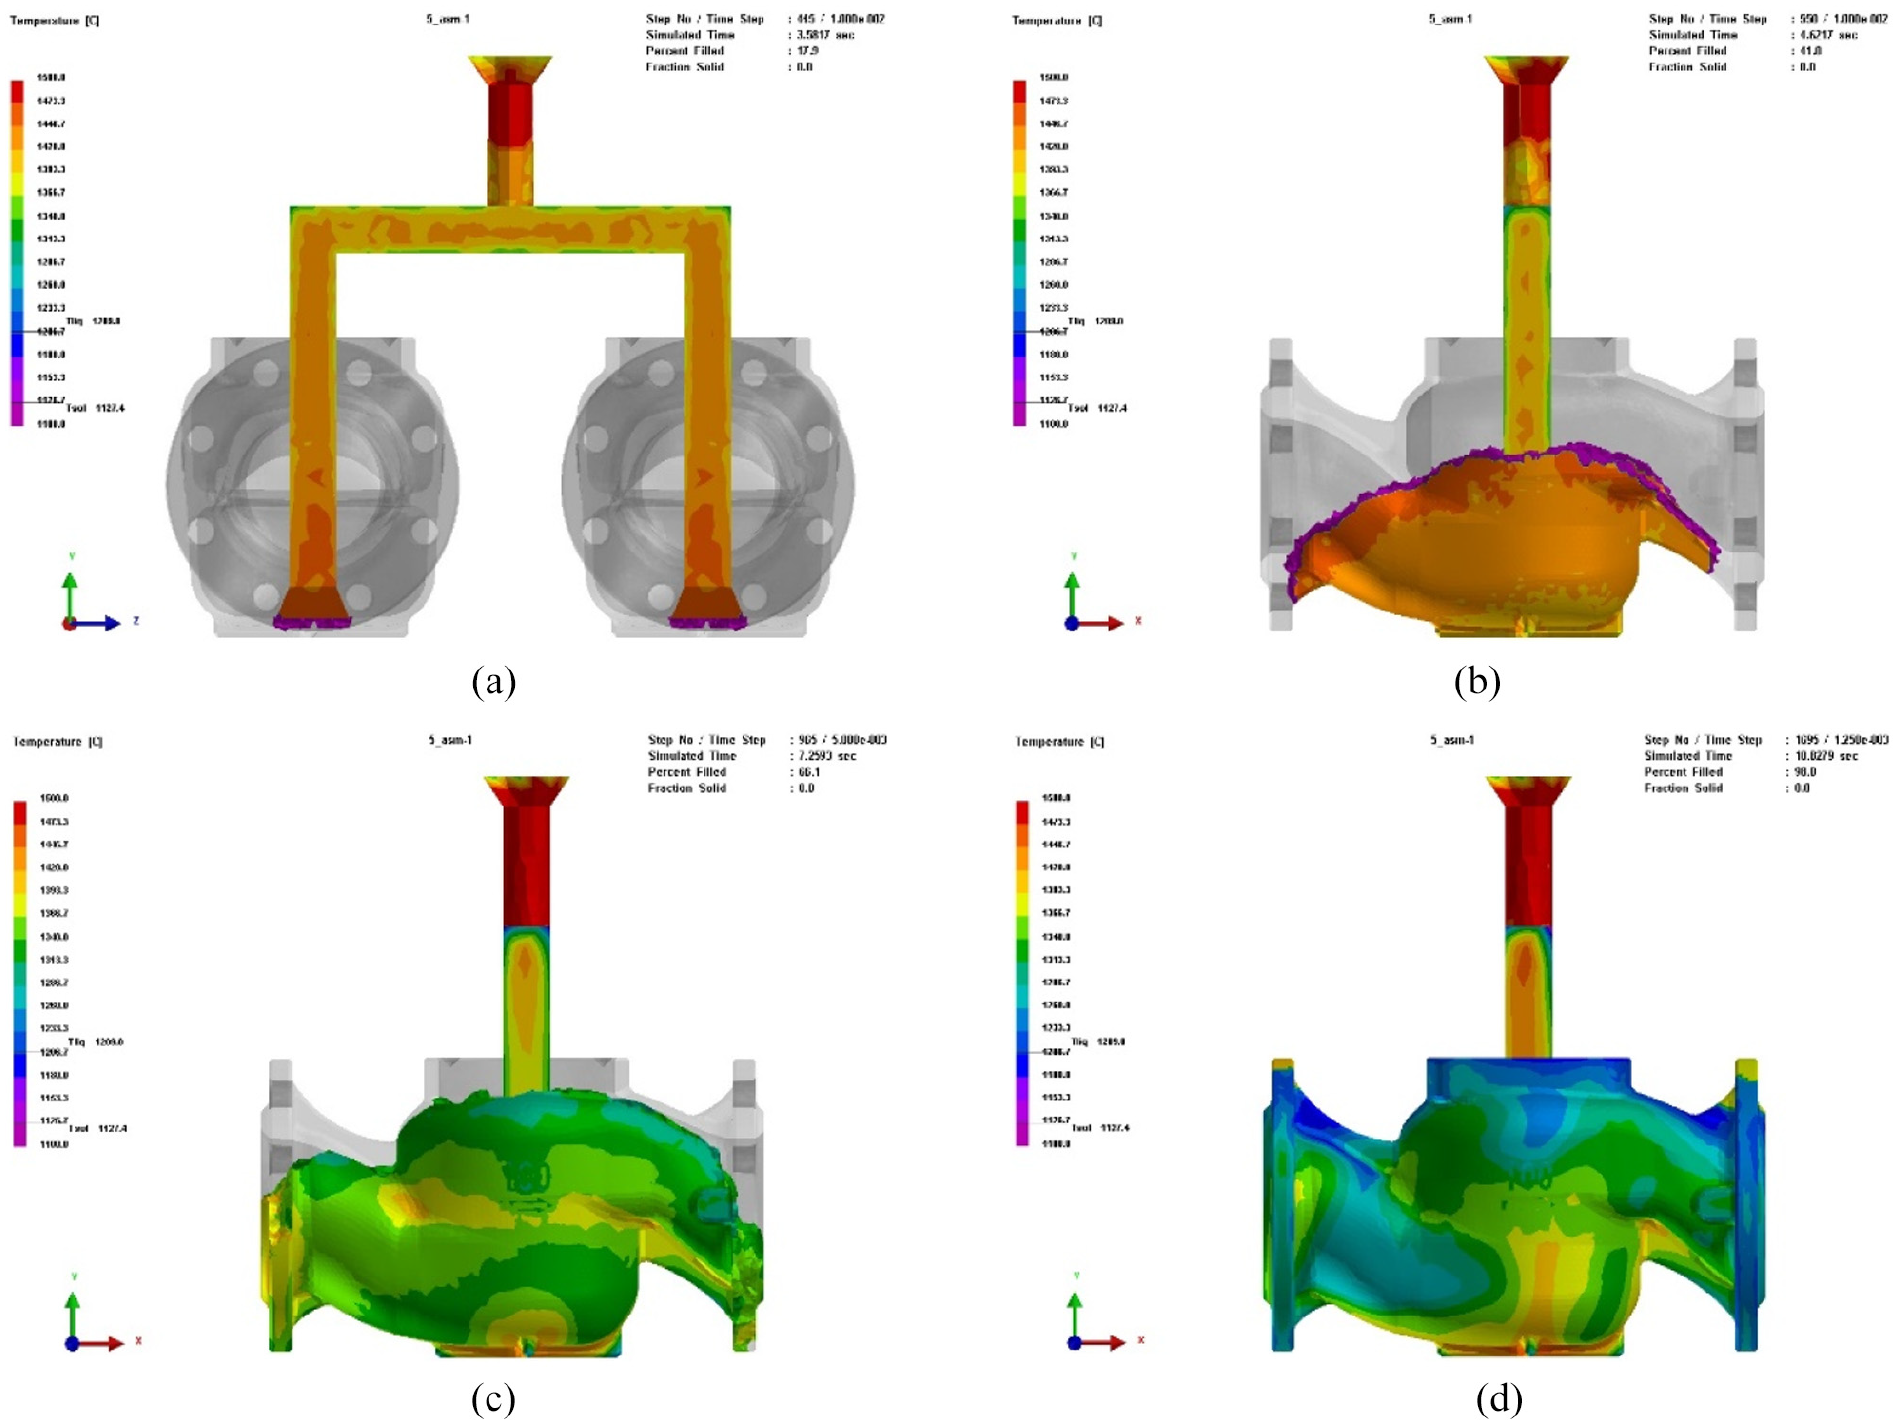
Temperature field during filling process of inner bottom injection-horizontal pouring: (a) t = 3.5817 s, filling = 17.9%, (b) t = 4.6217 s, filling = 41%, (c) t = 7.2593 s, filling = 66.1%, and (d) t = 10.8279 s, filling = 98%.
Because the inner gate is located at the center of the bottom of the casting, the molten metal will spread as a ring from bottom to top, as shown in Figure 10(b). The bottom color boundary shows a clear ring centered on the bottom, and the temperature field boundary is clear, reflecting the characteristics of layer-by-layer filling of molten metal in the filling process. When t = 10.8279 s, 98% of the filling process is completed, as shown in Figure 10(d). The lowest temperature inside the casting is also above the liquidus temperature, and there is no pre-solidification at the edge of the thin wall.
Figure 11 shows the solid phase ratio during the solidification process under the inner bottom injection-horizontal pouring system. When t = 10.8279 s, the filling is completed and the casting begins to solidify. It can be seen from Figure 11 that the main heat source is concentrated at the bottom of the casting, and the temperature gradually decreases toward the surroundings in a diffused shape. The temperature of the lower part of the casting gradually changes smoothly, there is a small temperature island area on the upper part, and the temperature inside the runner is extremely high. When t = 154.2854 s, it solidifies to 72.8%. At this time, most of the casting has been completely solidified, as shown in Figure 11(b). There are a small part of the incomplete solidification area on the upper part of the flanges on both sides, the lower part of the farad plate on both sides, and the connection between the bottom and the runner still have a higher temperature. The molten metal inside the runner has a feeding effect, but the flange has formed an isolated liquid phase zone, and there is a possibility of shrinkage porosity defects. When t = 694.2854 s, the whole solidification process is completed, as shown in Figure 11(b). The schematic diagram of solidification time in each area is shown in Figure 11(d). The color indicates the solidification time of different areas. It can be seen from Figure 11(d) that the first solidification area is mainly concentrated on the thin wall of the casting and the place far from the heat source. The casting solidifies from top to bottom, from thin to thick, which basically conforms to the law of sequential solidification, but the solidification of the thick wall is from outside to inside, and there is still the possibility of shrinkage porosity defects.

Solid phase ratio during solidification process of inner bottom injection-horizontal pouring: (a) solid phase ratio at 0% solidification, (b) solid phase ratio at 72.8% solidification, (c) solid phase ratio at 100% solidification, and (d) schematic diagram of solidification time in each area.
Figure 12 shows the distribution of shrinkage porosity under the inner bottom injection-horizontal pouring system. The shrinkage porosity defect is mainly concentrated on the flanges on both sides and the upper port of the water meter shell, and a few defects on the corner of the reinforcing ribs. The shrinkage porosity is concentrated at about 5%, and the main shrinkage porosity defects are similar to the outer bottom injection-vertical pouring system.

Distribution of shrinkage porosity in the inner bottom injection-horizontal pouring.
In summary, during the casting process under the inner bottom injection-horizontal pouring system, the molten metal filling is stable, and the filling time is slightly longer than that of the outer bottom injection-vertical pouring system. The molten metal is filled layer by layer during the filling process, which is different from the outer bottom injection-horizontal pouring system, and the temperature transition is stable. The solidification basically conforms to the principle of sequential solidification, and the shrinkage porosity defects of castings perform well, which is a relatively good pouring method.
In this paper, three pouring systems with different structures are simulated under the same process parameters. According to the simulation results, when the outer bottom injection-horizontal pouring system is adopted, the castings have defects such as insufficient casting, which directly cause the product to be unusable, indicating that it is an unacceptable casting method. During the outer bottom injection-vertical pouring process, the leading metal liquid rises steadily, and there is no short-term backflow during the filling process. The solidification basically conforms to the sequential solidification, and the defect area of the casting shrinkage porosity is mainly concentrated near the flange. The main cavity of the water meter has good performance, and the defect shrinkage rate is low. During the inner bottom injection-horizontal pouring process, the front metal liquid fluctuates slightly, and the heat source diffuses from the bottom in a ring shape during the filling process. The final solidification position is mainly concentrated in the thick wall of the flange and the upper port, and the shrinkage porosity defects are slightly increased compared to the outer bottom injection-vertical pouring system.
Experimental
Based on the results of structural optimization and casting process parameter optimization, the actual pouring experiment was carried out. The QT450-10 is adopted as the test material, the pouring temperature is 1580°C, and the pouring time is 15 min, the vacuum degree is set to 0.4–0.5 standard atmosphere, and finally the pressure is maintained at 0.3 MPa for 3–5 min. Through a series of treatments such as foaming plastic white film, combined pouring system, coating, drying, sand filling, tapping, pumping, pouring, solidification, turning box, etc. The quality of castings before and after optimization is compared, the simulation results can be verified and the factors affecting the quality of castings can be analyzed.
Figure 13 shows the quality of the water meter shell castings before the optimization. Due to the complex structure of the water meter shell, casting defects often occur on the shell wall, bottom, ports, flanges, and other parts.

Casting quality before optimization: (a) insufficient pouring and (b) cold insulation.
The optimized casting is shown in Figure 14. The overall surface quality of the casting is excellent, the casting characters are clear, the cavity has no defects such as cold barrier, wrinkle, insufficient pouring, and no cracks in the thick wall of the casting port and flange.

Casting quality after optimization.
The metallography of the casting structure is observed with a metallurgical microscope is shown in Figure 15. The matrix structure has a high spheroidization rate, with a good degree of ball grinding, and excellent performance. The finished product of WS-100 large-caliber water meter shell after spray painting is shown in Figure 16. The casting performance is excellent, and the numerical analysis is verified to be effective.

Metallographic diagram of the microstructure of the casting.

Finished product of WS-100 large-caliber water meter shell.
Conclusions
The vertical spiral wing WS-100 large-caliber water meter was selected as the research object in this study. Three pouring systems with different structures were numerically simulated and optimized for eliminating defects such as shrinkage and misrun. From numerical simulations, experimental comparison, and an analysis of the casting process, the following conclusions were drawn:
Through the analysis of the structure of the water meter shell, three different pouring systems were preliminarily designed, the outer bottom injection-vertical pouring, outer bottom injection-horizontal pouring, and inner bottom injection-horizontal pouring were adopted, and the three-dimensional model and the finite element model are established.
The flow field and temperature field involved in the pouring process are numerically simulated and analyzed, and the influence of pouring systems with different structures on the filling and solidification process of castings is discussed.
The shell structure of the water meter is analyzed by a combination of experiment and simulation, it is concluded that the filling process under the inner bottom injection-horizontal pouring system is stable, the isolated liquid phase area of the solidification process is relatively small, and the possibility of forming defects is less. The casting performance is excellent, and the numerical analysis is verified to be effective.
Footnotes
Handling Editor: James Baldwin
Declaration of conflicting interests
The author(s) declared no potential conflicts of interest with respect to the research, authorship, and/or publication of this article.
Funding
The author(s) disclosed receipt of the following financial support for the research, authorship, and/or publication of this article: The authors acknowledged with thanks the assistance supported by the National Natural Science Foundation of China (Grant No. 51975123), Fuzhou Science and Technology Plan Project (Grant No. 2019-G-42)The Planning Subject for the 13th Five Year Plan of Fujian Education Sciences (Grant No. FJJKCG20-431), Research Project of Education and Teaching Reform in Fujian Undergraduate Universities(Grant No. FBJG20200185).
Data availability
Some or all data, models, or code that support the findings of this study are available from the corresponding author upon reasonable request.