
Abstract
Titanium alloy Ti1023 is a typical difficult-to-cut material. Tool wear is easy to occur in machining Ti1023, which has a significant negative effect on surface integrity. Turning is one of the common methods to machine Ti1023 parts and machined surface integrity has a direct influence on the fatigue life of parts. To control surface integrity and improve anti-fatigue behavior of Ti1023 parts, it has an important significance to study the influence of tool wear on the surface integrity and fatigue life of Ti1023 in turning. Therefore, the effect of tool wear on the surface roughness, microhardness, residual stress, and plastic deformation layer of Ti1023 workpieces by turning and low-cycle fatigue tests were studied. Meanwhile, the influence mechanism of surface integrity on anti-fatigue behavior also was analyzed. The experimental results show that the change of surface roughness caused by worn tools has the most influence on anti-fatigue behavior when the tool wear VB is from 0.05 to 0.25 mm. On the other hand, the plastic deformation layer on the machined surface could properly improve the anti-fatigue behavior of specimens that were proved in the experiments. However, the higher surface roughness and significant surface defects on surface machined utilizing the worn tool with VB = 0.30 mm, which leads the anti-fatigue behavior of specimens to decrease sharply. Therefore, to ensure the anti-fatigue behavior of parts, the value of turning tool wear VB must be rigorously controlled under 0.30 mm during finishing machining of titanium alloy Ti1023.
Introduction
Titanium alloy Ti1023 has been widely used in the aviation and aerospace manufacturing field due to it has the indicators of high strength, low density, and corrosion resistance. Ti1023 is a typical difficult-to-cut material, the tool wear is an unavoidable phenomenon occurring in the machining process, which has a significant influence on machined surface integrity of parts.1,2 And surface integrity has a direct influence on the anti-fatigue behavior of parts.3–5 Turning is one of the main manufacturing methods in machining key parts in the aviation manufacturing field. To control the surface integrity and improve anti-fatigue behavior of Ti1023 parts in turning, it has a great engineering application value on researching the effect of tool wear on machined surface integrity and anti-fatigue behavior of parts.
To explore the effect of tool wear on surface integrity, many scholars have carried out relevant research and got several corresponding research achievements. Houchuan et al. 6 and Sun and Guo 7 found the surface roughness increased with the increase of tool wear in milling Ti1023 and Ti-6Al-4V, respectively. The material properties of Ti-6Al-4V are basically same as Ti1023. Liang et al.8–10 concluded that surface roughness increased with the increase of tool flank wear with VB from 0 to 0.2 mm in milling Ti-6Al-4V, but surface roughness decreased due to rubbing and ironing at VB = 0.3 mm. Che-Haron et al. 11 investigated surface roughness and thickness of plastic deformation layer both increased with the increase of tool flank wear. When machining with worn tools, the thermal softening phenomenon on the machined surface caused by the high cutting temperature influenced surface microhardness. Thus, the microhardness changed with different worn tools. Ducobu et al. 12 analyzed cutting temperature on different tool wear with finite element analysis and found the high tool wear leads to a high cutting temperature which affected the microhardness of workpieces surface. Liang and Liu 8 investigated the increase of tool wear caused the thickness of plastic deformation increased in turning Ti-6Al-4V. Rao et al. 13 studied the influence of tool wear on surface integrity in Ti-6Al-4V milling process through experiments and numerical simulation. The achievements showed there was the residual compressive stress that happened on the machined surface, and the value of the compression residual stress decreased with the increase of tool wear. From the above researches, tool wear has a significant influence on surface integrity in machining titanium alloys.
On the other hand, except for the effect of material properties on fatigue life, surface integrity has a great influence on anti-fatigue behavior, which also is the research focus in the aviation manufacturing field at present. Yao et al. 14 showed the fatigue life of specimens decreased rapidly when the equivalent stress concentration factor of the machined surface increased in machining Ti1023. During turning γ titanium alloys, the fatigue life of specimen at surface roughness Ra 0.15 μm was three times higher than the specimens at surface roughness Ra 0.43 μm. 15 Liang et al. 8 investigated there was residual compressive stress on the machined surface in turning Ti1023. The initiation and propagation of fatigue cracks could be restrained by the grains in the compression state due to residual compressive stress on the machined surface, which can improve the anti-fatigue behavior of parts. Chen et al. 16 found a special phenomenon that residual compressive stress not only reduced with the increase of tool wear but also gradually transformed into residual tensile stress. The residual tensile stress harm to anti-fatigue behavior of specimens, which should be avoided in manufacturing. Li et al. 17 demonstrated the main reasons that affected the anti-fatigue behavior were plastic deformation layer and surface work-hardening both caused by the change of cutting speed in finishing milling Ti1023. Besides, the surface defects caused by worn tools have a significant influence on fatigue life, such as pits, tearing surface, and surface burning. 8 The influence of wear tools on fatigue is essentially the influence of surface integrity on fatigue life. Different wear tools have different surface integrity, which causes the different fatigue life.
According to the previous research achievements, tool wear has a direct influence on surface integrity. Meanwhile, the influence law on the fatigue life of parts is not clear. Therefore, it has a significance in researching the effect of tool wear on fatigue life of parts. However, several previous kinds of research focused on the effects of tool wear on surface integrity in milling titanium alloys, and there were only a few studies of tool wear influenced on surface integrity and fatigue life in turning titanium alloys. As follows, the experiments of turning Ti1023 utilizing different wear tools were presented. Researching the effect and mechanism of tool wear on surface integrity and anti-fatigue behavior of specimens in turning Ti1023, which can provide experimental references and theoretical basis for the engineering application of turning Ti1023.
Experimental conditions
Materials and experimental conditions
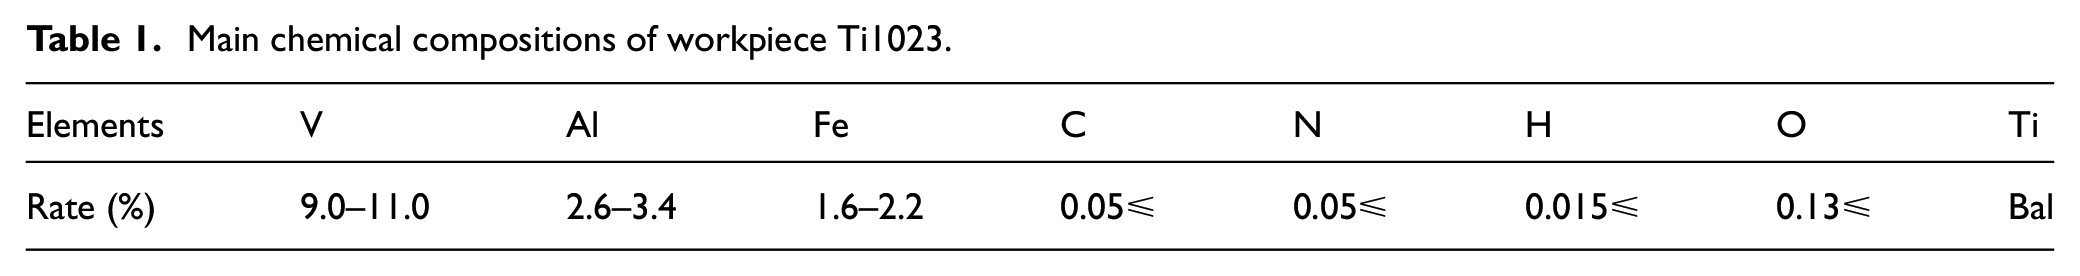
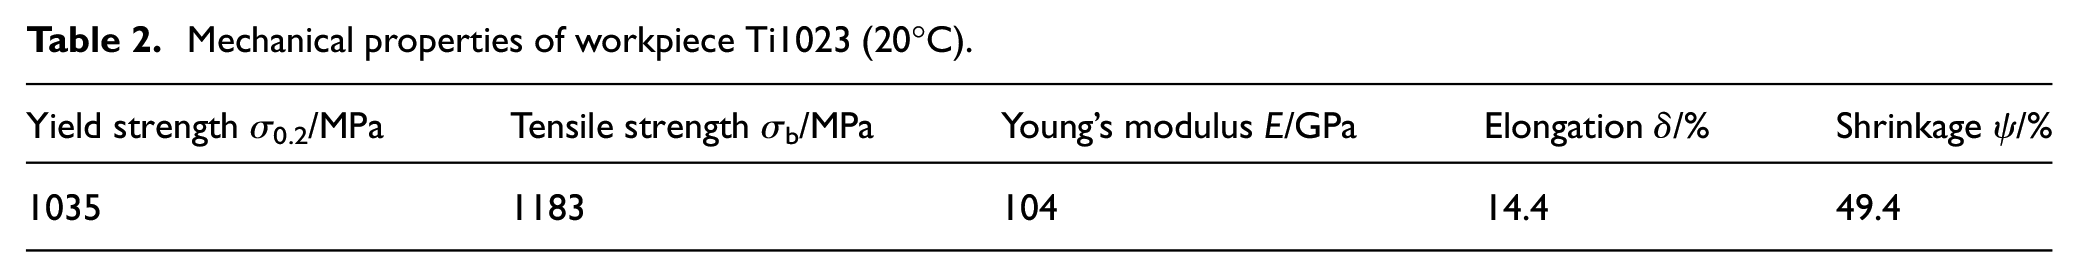
The workpieces material used in all experiments was β titanium alloy Ti1023 (Ti-10V-2Fe-3Al). Solution treatment of experimental material was carried out (750°C, 2 h, water quenching). The main chemical compositions and mechanical properties of Ti1023 are listed in Tables 1 and 2, respectively.
Main chemical compositions of workpiece Ti1023.
Mechanical properties of workpiece Ti1023 (20°C).
All the experiments were carried out using a numerical control lathe. The experimental turning tool was CCMT09T308 VP15TF (MITSUBISHI, Japan) with tool coating materials AlTiN. The tool geometries and turning parameters are shown in Table 3. During the machining processes, a water-based coolant was applied for cooling.
Cutting parameters.

Tool wear
During cutting, the change of shape of the tool from its original shape, resulting from the gradual loss of tool material is termed as tool wear. Cutting tools are subjected to an extremely severe rubbing process, and tools in metal-to-metal contact between the chip and workpiece. Tool wear occurs during the cutting action, and it will ultimately fail the cutting tool. 18 Due to the tool wear increases with the increase of cutting time. According to different cutting time, the different experimental worn tools were obtained with the cutting parameters in Table 3 by machining under different cutting time. The tool wear which focuses on this research is Flank wear VB, as shown in Figure 1.

The type wear of turning tool.
In the turning machining process, the tool wear which mainly caused by rubbing abrasives between the cutting edge and workpiece. Tool wear not only destroys the structure and strength of cutting tools but also directly influences surface integrity in machining processes. The different levels of worn tools were created by turning Ti1023 for preparing. Using the digital microscope AM7915MZT (Dino-Lite, China) to measure the tool wear of experimental worn turning tools, and the measurements are showed in Figure 2. Tool wear can be measured using the maximum wear land size VB of cutting tools in Figure 2. In the experiments, the value of tool wear VB included 0.05, 0.15, 0.25, and 0.3 mm.

Cutting tools with different wear width.
Fatigue test specimens
According to tool wear and machining conditions, both influenced the fatigue life of specimens, the dimensions of the fatigue test specimen and the machining method were designed, as shown in Figure 3. First, utilizing the other cutting tools for turning the specimens in rough machining, and the allowance stayed. Then, the specimen allowance was machined utilizing the different experimental worn tools in finishing machining and the fatigue test specimens were obtained finally. The cutting parameters of finishing machining are shown in Table 3. The length of the gauge section on the fatigue test specimen is 6 mm, and the diameter is 5 mm. Meanwhile, the water-based coolant also was used for cooling, and the manufacturing of fatigue specimens was shown in Figure 4.

Manufacturing method of fatigue specimen.

Manufacturing of fatigue specimen.
Measurements and discussions of surface integrity
Surface integrity measurement
The contact-type surface roughness measuring instrument TIME-3220 (Time Group Inc., China) was used to measure the surface roughness of workpieces. The cut-off value was set to 0.8 mm, and the evaluation length was 4 mm. According to previous research achievements, the machined surface roughness parallel to the load direction has more significant influences on fatigue behavior than that perpendicular to the load direction. 14 Therefore, the machined surface roughness was measured in the experiments, which parallel to the load direction. Load direction also perpendicular to the cutting speed direction. Surface microhardness was measured by Vickers hardness instruments HV-1000. The load was set to 200g for 10 s. The Surface microhardness rate N was calculated by the formula as follows.

Where H is the measured micro-hardness, and H0 is the hardness of base material. H0 of Ti1023 in experiments is about 334 HV.
Machined surface residual stress which parallels the load direction was measured by an X-ray diffractometer AutoMATE II (Rigaku, Japan). Parameters in Table 4.
Important parameters of the residual stress measurements.

In surface integrity measurement, each surface integrity factor of workpieces was measured five times and averaged the original statistics for measurement results.
Additionally, the machined surface topography of turning workpieces was observed using an optical microscope. Parallel to the cutting direction to made the metallographic samples of Ti1023 workpieces using Wire-EDM. After polishing and corroding the samples, the microstructure of the samples was observed under SEM (scanning electron microscope). Meanwhile, SEM also is used to observe the fatigue fracture surface of fatigue test specimens.
Surface roughness and topography
Under the same conditions, the machined surface roughness Ra and Rz using different worn tools are shown in Figure 5. Based on the experimental results, surface roughness increased from Ra 0.46 μm to Ra 0.69 μm when the tool wear VB increased from 0.05 to 0.15 mm. And the surface roughness decreased to Ra 0.44 μm when the tool wear VB = 0.25 mm. Finally, the surface roughness increased again to Ra 0.63 μm when the tool wear VB = 0.3 mm.

Influence of tool wear on surface roughness.
Comparing to the previous research achievements, Houchuan et al. 6 conducted that the machined surface roughness Ra always increased with the increase of tool wear in milling Ti1023. Liang and Liu 8 found in milling Ti-6Al-4V that surface roughness increased continuously when the tool wear VB increased from 0 to 0.2 mm, but surface roughness Ra decreased suddenly when the tool wear VB = 0.3 mm. The reason why surface roughness decreased was that higher cutting temperature was caused by the violently worn tool. The high cutting temperature was approximately 1000°C utilizing the tool with VB = 0.3 mm, which led to the material of Ti-6Al-4V emerging micro-melting states and given the effects of rubbing and ironing enhanced at the interface of tool and workpiece. The melting point of Ti-6Al-4V is 1650°C, which is almost the same as the melting point of Ti1023. However, the results in the experiment showed the trend that surface roughness increased with VB ranging from 0.05 to 0.15 mm and then decreased with VB ranging from 0.15 to 0.25 mm. Finally, surface roughness increased again when the value of VB reached 0.3 mm. There is a great difference between the experimental results and previous research findings.
The surface topographies of turning are shown in Figure 6. The grooves are significant and deeper on the surface machined by tool wear VB at 0.15 and 0.3 mm, and the corresponding surface roughness is higher. There are massive and significant pits on the machined surface only at VB = 0.3 mm, which has negative effects on the anti-fatigue behavior of specimens. However, when the surface machined by tool wear VB at 0.05 and 0.25 mm, respectively, the surface is more smoothly due to the grooves are shallower, and the corresponding machined surface roughness is lower.

Machined surface topography with different tool wear: (a) VB = 0.05 mm, (b) VB = 0.15 mm, (c) VB = 0.25 mm, and (d) VB = 0.30 mm.
Analyzing the experimental results by combining surface roughness and topographies. The contact areas increase at the tool and workpiece interface with the increase of tool wear VB from 0.05 to 0.15 mm, tool wear topographies are reflected on the machined surface. Because the tool wear causes plenty of deeper grooves on the machined surface, and leads the surface roughness increase obviously. The maximum surface roughness Ra 0.69 μm machined by the tool wear with VB = 0.15 mm.
However, surface roughness decreases at VB=0.25mm. Because the cutting heat increases with the increase of tool wear. Chips take the main cutting heat in turning Ti1023 with worn tools, but due to the poor thermal conductivity of Ti1023, the cutting heat not prompt discharge, and the temperature on the cutting area continuously raises for that. The high cutting temperature could be generated in machining. The increased cutting temperature leads to Ti1023 appearing micro-melting states, which enhances the effects of rubbing and ironing between tool and workpiece, and causes the surface roughness to decrease. After observing the topography of surface machined by a tool with VB = 0.25 mm, as shown in Figure 6(c), because the effects of cutting are enhanced, the grooves are shallower and the machined surface is smooth.
With the increase of tool wear, surface roughness increases substantially again when VB increasing from 0.25 to 0.3 mm. The result that surface roughness Ra 0.63 μm is lower than that at VB = 0.15 mm indicates the effect of micro-melting still happens on the machined surface at VB = 0.3 mm. But the contact area between tool and workpiece increases sharply with the increase of tool wear. There is significant plastic deformation on machined surface due to the tool wear seriously at VB = 0.3 mm, which not only weakens the effect of micro-melting in cutting but also leads the surface roughness to increase substantially. Meanwhile, the surface defects are obvious on machined surface at VB = 3.0 mm, which has a great negative influence on the fatigue behavior of specimens. Therefore, to avoid the surface defects in turning Ti1023, tool wear VB should less than 0.25 mm.
Surface microhardness
According to the previous research achievements, tool wear easily leads to serious plastic deformation and the increase of cutting temperature on the machined surface, which influences surface microhardness on workpieces. 6 Generally, the increase of tool wear enhances the effects of rubbing and extruding between the tool edge and workpiece surface, which causes serious plastic deformation to appear on the machined surface, and surface microhardness increases. 18 Houchuan et al. 6 found the microhardness decreased with the increase of tool wear in milling Ti1023. The main reason that led to the decrease of microhardness was the thermal softening caused by the raise of cutting temperature on machined surface. The based hardness of Ti1023 workpieces used in the experiments was 334 HV, and the relationship of surface microhardness and tool wear is shown in Figure 7. Work-hardening happens on the machined surface of all workpieces in the experiments Surface microhardness increases firstly with the tool wear VB ranging from 0.05 to 0.15 mm, and continuously decreases with the VB ranging from 0.15 to 0.3 mm.

Influence of tool wear on surface microhardness.
A competing process between thermal softening and work-hardening happens during the machining. Work-hardening and thermal softening both have different influences on surface microhardness. Contacting area between tool and workpiece surface increases with the increase of tool wear during VB ranging from 0.05 to 0.15 mm in turning Ti1023, and the effects of rubbing and extruding enhances with that. There significant work-hardening happens machined in the experiment, which mainly leads an increase of surface microhardness. Surface microhardness reaches the maximum value of 396 HV at VB = 0.15 mm, and the corresponding microhardness rate is 18.56%. The main reason leads microhardness raise is work-hardening caused by plastic deformation at VB = 0.15 mm.
When the tool wear increases from 0.15 to 0.25 mm, the temperature of the cutting area raises. The thermal softening phenomenon happens on the machined surface due to the rise of temperature, which mainly leads to microhardness decrease. The tool wear seriously at VB = 0.3 mm. There is not only serious plastic deformation on machined surface, but also the thermal softening phenomenon is more significant. The continuous decrease of microhardness indicates the thermal softening phenomenon is the main reason that influences microhardness at the VB from 0.15 to 0.3 mm. The range of surface microhardness is from about 360 to 396 HV in the experiment, which changes a little. It indicates that tool wear has a little influence on the changing of microhardness. And there are significant thermal softening phenomenon happens on the machined surface when the tool wear VB more than 0.15 mm.
Surface residual stress and microstructure
In the machining processes, due to the factors of cutting area temperature and plastic deformation of the machining surface, surface residual stress usually happens on the machined surface. Surface residual stress is an important indicator of surface integrity, which has a great influence on the fatigue behavior of parts.18,19 According to the previous research achievements, it is beneficial to the fatigue behavior of parts when there is residual compressive stress on the machined surface. The initiation and propagation of fatigue cracks could be restrained by the grains in the compression state due to residual compressive stress, which can improve the fatigue behavior of parts significantly. 20 Surface residual stress measurement results of turning Ti1023 under different tool wear states, as shown in Figure 8.

Influence of tool wear on surface residual stress.
The experimental results indicate there is residual compressive stress in the direction which parallel to cutting speed direction on the machined surface of all workpieces. With the increase of tool wear, the value of residual compressive stress firstly increases at the VB ranging from 0.05 to 0.15 mm and then decreases at the VB ranging from 0.15 to 0.3 mm. Liang et al. 8 investigated that there was residual compressive stress on the machined surface in turning Ti-6Al-4V, and the value of residual compressive stress decreased continuously with the increase of tool wear. The previous research even found that the residual compressive stress transformed into residual tensile stress on the machined surface with the increase of tool wear. 16 Through the summary and analysis of the previous research findings, the main reason that leads to the decrease of residual compressive stress is the significant thermal effect which causes by worn tools in machining.
In the experiments, machining by the tool with VB = 0.15 mm, there are significant plastic deformation phenomenon happens on surface utilizing worn tools. Not only the value of surface microhardness reaches the maximum, but also the value of residual compressive stress reaches the maximum 646.8 MPa when the tool wear VB = 0.15 mm. When the tool wear VB increase from 0.15 to 0.3 mm, the contact area between the tool and workpiece increases, the cutting temperature also increases. However, the poor thermal conductivity of Ti1023 reduces the effects of heat dissipation, which causes the heat to accumulates and the temperature on cutting area continuously raise. A significant thermal effect happens and reduces the effect of plastic deformation on the machined surface, which leads the value of residual compressive stress to decrease.
Microstructures of the surface machined by different worn tools were observed under the SEM, the micrographs are presented in Figure 9. Comparing to the microstructure of the based material, the significant plastic deformation layer happens on the machined surface, which is mainly composed of the deformed grain boundaries along the cutting speed direction of the sub-surface microstructure. Grain structure on the machined surface produces microstructural fibrosis deformation due to the effects of shearing and stretching, and grain structure cuts off finally. The microstructural fibrosis deformation direction of grains is related to the cutting speed direction. Generally, the plastic deformation is related to the improper machining methods and high cutting temperature that causes by worn tools. Under the high cutting temperature, the main reason that causes plastic deformation is the cutting force which increases with the increase of the tool wear. 3 Houchuan et al. 6 found in milling Ti1023 that the thickness of plastic deformation increased with the increase of tool wear. The high cutting force caused by worn tools was the main reason that led to this phenomenon.

SEM micrographs of machined surface on different tool wear: (a) VB = 0.05 mm, (b) VB = 0.15 mm, (c) VB = 0.25 mm, and (d) VB = 0.30 mm.
In the experiments, the thickness of plastic deformation on the machined surface increases with the increase of tool wear and the microstructural fibrosis deformation is also significant, especially at VB = 0.3 mm. Because the effect of extrusion enhances with the increase of tool wear, and cutting force increases significantly. As shown in Figure 9, the thickness of the plastic deformation layer is 8.7 μm at VB = 0.05 mm, and while that reaches a maximum of 32.6 μm at VB = 0.3 mm. The higher cutting force leads thicker plastic deformation layer, which causes by serious worn tools.
On the other hand, there is no significant recast layer on all machined surface microstructure of workpieces in the experiments. Due to the significant effect of coolant, the turning temperature is far below the phase transition temperature of Ti1023 microstructure. No phase transition of microstructure happens on the machined surface. The recast layer does not form, which is beneficial to the fatigue behavior of parts.
Anti-fatigue experiment
Conditions of anti-fatigue experiment
All low-cycle anti-fatigue experiments were carried out on GPS100 high-frequency digital tension compression fatigue testing machine. Based on the strength limit of Ti1023 listed in Table 2, the maximum tensile load of fatigue specimens was set to 900 MPa in experiments, and the direction of tensile load was parallel to the cutting speed direction. The cyclic stress ratio r was 0.1 and the fatigue experimental frequency was about 100 Hz. Each worn tool was used to machine three fatigue test specimens in finishing machining of Ti1023. After that, the three specimens were tested to obtaining the average of the low-cycle fatigue life of the specimens. The way of fatigue specimens clamping in the experiments is illustrated in Figure 10.

Clamping of fatigue specimens.
Anti-fatigue experimental results
Regarding the comparison effects of different worn tools on the fatigue life of the specimens, Nf of all the fatigue tests are presented in Figure 11. With the increase of tool wear VB in turning Ti1023, the fatigue life not monotonic decrease. The fatigue life of specimens is higher when the tool wear VB = 0.05 mm and VB = 0.25 mm, and fatigue life is lower when VB = 0.15 mm and VB = 0.3 mm. Therefore, the tool wear has a significant influence on the fatigue life of specimens. The value of fatigue life reaches a maximum of 57.72 × 10⁴ at VB = 0.25 mm. However, all specimens machined by a tool with VB = 0.3 mm, many significant cracks appeared on the surface during fatigue experiment, as shown in Figure 13. To ensure the safety of the anti-fatigue experiment, the experiment was stopped at once, even the specimen did not fracture completely. The fatigue life of specimens machined by the tool with VB = 0.3 mm is the lowest.

Results of fatigue experiments.
The cracks initiation of specimens in anti-fatigue experiments as shown in Figure 12. After observing and analyzing the fatigue fracture surface of specimens, at VB = 0.05 mm and VB = 0.25 mm, there only one fatigue source that happens on the fatigue fracture surface and originates on the sub-surface of the specimen. Radial fringes and crystalline morphology both appear on fatigue fracture, which indicates the main reason for fatigue fracture is cleavage fracture. Cleavage fracture of the specimen is closely related to material properties. However, the fatigue source appears on surface of specimens by the tool with VB = 0.15 mm. Because the surface roughness is higher at VB = 0.15 mm, and the phenomenon of micro-stress concentration became seriously.

SEM micrographs of crack initiation site of specimens: (a) VB = 0.05 mm, Nf = 39.89 × 10⁴, (b) VB = 0.15 mm, Nf = 19.76 × 10⁴, and (c) VB = 0.25 mm, Nf = 57.72 × 10⁴.
When the tool wear VB reaches 0.3 mm, not only the surface roughness is higher, but also there are significant defects on the machined surface. According to the previous research findings, high surface roughness, and surface defects both have a great negative influence on the anti-fatigue behavior of specimens. After observing fatigue specimen machined by the tool with VB = 0.3 mm, there are multiple fatigue sources on the surface of specimens, and significant cracks also happen, as shown in Figure 13.

SEM micrograph of fatigue specimen machined by the tool with VB = 0.3 mm.
Fatigue experiment discussion
There are large differences in anti-fatigue behavior of specimens that machine by different worn tools in the experiments. Analyzing the results by combining the surface integrity, when the workpiece machined by tools with VB = 0.05 mm and VB = 0.25 mm, the surface roughness was Ra 0.46 μm and Ra 0.44 μm, respectively. The main reason that caused fatigue fracture was cleavage fracture. Corresponding specimens not only had better anti-fatigue behavior but also the fatigue source appeared on the sub-surface.
When the workpiece machined by tools with VB = 0.15 mm and VB = 0.3 mm, the surface roughness was Ra 0.69 μm and Ra 0.63 μm, respectively. The fatigue life of specimens at the higher surface roughness was lower, and fatigue resources appeared on machined surface. The experimental results indicate that the specimens with lower surface roughness have better anti-fatigue behavior. Due to the higher surface roughness, it is easy to cause the phenomenon of micro-stress concentration on the machined surface, and fatigue resources easily appeared on the machined surface at higher surface roughness. Results show the higher surface roughness has a great negative influence on anti-fatigue behavior of specimens, which is the same as some previous research findings.14,15,18,21 Besides, the variation range of surface microhardness was small in the experiments, which had less influence on the anti-fatigue behavior of specimens.
According to the previous research achievements, the residual compressive stress on the machined surface is beneficial to improve the anti-fatigue behavior of specimens. 20 Even the value of residual compressive stress reaches a maximum at VB = 0.15 mm in the experiments, fatigue life is lower than that at VB = 0.05 mm and VB = 0.25 mm. When the workpiece machined by tools with VB = 0.05 mm and VB = 0.25 mm, the surface roughness was Ra 0.46 μm and Ra 0.44 μm, respectively.
However, the surface roughness Ra 0.69 μm at VB = 0.15 mm, which is higher than the surface roughness at VB = 0.05 mm and VB = 0.25 mm. Fatigue life of specimen at surface roughness Ra 0.44 μm is far greater than that of the specimen at surface roughness Ra 0.69 μm. Therefore, surface roughness has the most significant influence on anti-fatigue behavior than other indicators of surface integrity in the experiments.
There are significant surface defects on surface machined by the tool with VB = 0.3 mm, such as pits. Although the surface roughness is lower than that at VB = 0.15 mm, the phenomenon of micro-stress concentration easily happens on the machined surface due to the defects. Multiple fatigue sources cause significant cracks to appear on the machined surface, which influences the anti-fatigue behavior of specimens seriously. Therefore, the anti-fatigue behavior is the poorest at VB = 0.3 mm.
Moreover, from the analysis of the influence of surface integrity on anti-fatigue behavior of specimens which machine by different worn tools, the conclusion that plastic deformation layer on the machined surface is beneficial to improve anti-fatigue behavior of specimens is obtained in the experiments. According to the experiments, the value of surface roughness at VB = 0.05 mm and VB = 0.25 mm is almost the same and both under Ra 0.5 μm. Not only the value of surface microhardness is almost the same, but also there is almost same residual compressive stress on the machined surface at VB = 0.05 mm and VB = 0.25 mm. No significant surface defects on machined surface, and fatigue resources both appear on the sub-surface. However, fatigue life of specimens is 39.89 × 10⁴ at VB = 0.05 mm. The fatigue life of specimens is 57.72 × 10⁴ at VB = 0.25 mm, which is about 1.5 times than that at VB = 0.05 mm. It can be seen that fatigue life increases significantly at VB = 0.25 mm.
From the observing microstructure of the machined surface, as shown in Figure 9. Thickness of the plastic deformation layer is 8.7 μm at VB = 0.05 mm, and that is 21.5 μm at VB = 0.05 mm. The thicker plastic deformation layer and microstructural fibrosis deformation on the machined surface both lead the better anti-fatigue behavior of specimens, which has the effect of restraining the initiation and propagation of fatigue cracks on the machined surface.
When the indicators of surface integrity all are the almost same, such as surface roughness, microhardness, and residual stress, the appropriate increase of thickness of plastic deformation layer is beneficial to improve the anti-fatigue behavior of specimens. Microstructural fibrosis deformation under the machined surface, which enhances the structural strength of grins and also improves the anti-fatigue behavior. Meanwhile, according to the previous research findings, the main reason that improved the anti-fatigue behavior of specimens was surface enhancement caused by the thickness of the plastic deformation layer in finishing milling Ti1023. 17 Therefore, the plastic deformation layer on the machined surface has a positive influence on improving the anti-fatigue behavior of parts.
Conclusions
Anti-fatigue behavior of specimens not monotonic decreases with the increase of tool wear in turning titanium alloy Ti1023. The changing trend of anti-fatigue performance first decreases, then increases, and finally decreases sharply again. At first, the value of microhardness and residual compressive stress both increases, but the higher surface roughness also appears at VB = 0.15 mm. Micro-notches wear on tool edge causes the higher surface roughness which leads the anti-fatigue behavior to sharply decrease. When the VB increases from 0.15 to 0.25 mm, the surface roughness decreases. Meanwhile, the higher tool wear causes the thickness of the plastic deformation layer to increase, which leads to anti-fatigue behavior improving significantly. Finally, when the tool wear VB = 0.3 mm, the surface roughness increases sharply again and significant defects appear on the machined surface. Although the thickness of the plastic deformation layer is the thickest at VB = 0.3 mm, the anti-fatigue behavior decreases sharply.
Tool wear has a great influence on machined surface integrity in turning Ti1023. Surface roughness has the main and negative influence on the anti-fatigue behavior of specimens. When the surface roughness is less than Ra 0.5 μm, the plastic deformation layer and microstructural fibrosis deformation on the machined surface both have a positive influence on the anti-fatigue behavior.
When the tool wear VB = 0.3 mm, the surface defects are caused by seriously plastic deformation on the machined surface, which leads the anti-fatigue behavior to decrease sharply. Therefore, for achieving the better anti-fatigue behavior of specimens in turning Ti1023, the tool wear VB should less than 0.25 mm.
Footnotes
Acknowledgements
The authors thank the anonymous reviewers for their critical and constructive review of the manuscript.
Handling Editor: Claudia Barile
Declaration of conflicting interests
The author(s) declared no potential conflicts of interest with respect to the research, authorship, and/or publication of this article.
Funding
The author(s) disclosed receipt of the following financial support for the research, authorship, and/or publication of this article: This study was co-supported by Natural Science Foundation of China (Grant No. 51875028 and No. 91960203).