
Abstract
Load spectrum is the basis of wear analysis and life prediction in journal bearing. This paper proposed a method to generate the wear load spectrum from the measured loads that avoiding the errors introduced by the assumptions of traditional constant load. An axle pin load sensor that can recognize the load value and its orientation is developed to test the original wear loads of journal bearing in a concrete pump under working conditions. The interactive influence of perpendicular components in the measured loads is involved by introducing two effect coefficients. Subsequently, the amplitude distribution of the wear load and its lasting time are extracted from the measured complex load-time history using the rain-flow counting method and Weibull distribution. The wear load spectrum is generated by dividing the continuous load into eight load steps. The validity of the approach is supported by finite element analysis on the wear simulation of journal bearing using the generated load spectrum and the measured load. In addition, the effects of load types and load sequence on the wear are discussed based on the proposed method and the FE model. This study provides guidelines to efficiently generate the wear load spectrum for journal bearing, and enhances its reliability of wear prediction in the experimental tests and theoretical analysis.
Introduction
Wear usually occurs in journal bearing of mechanical system and substantially affects its life span, 1 especially under severe working conditions. However, it is very difficult to be directly measured due to the restrictions of testing technology, as well as time and cost. In practice, the basic wear behavior of journal bearing generally is obtained by an experiment or numerical simulation.2–6
It is well known that wear load is one of the most important parameters, and has a significant impact on the wear response. In the past years, some researchers7–11 measured and simulated the wear of journal bearing adopting constant loads. However, the data and models under constant loads may not be appropriate or sufficient to adequately assess the wear performance under complex and random loads in service. Prasad 12 studied on the effects of the test environment and applied load on the sliding wear behavior of a cast iron, and found that wear response is very sensitive to the load encountered. Goto and Amamoto 13 experimentally investigated the effect of change in load on the transition between severe wear and mild wear in a certain range of load, and showed that the load transition is not continuous. Their further research 14 indicated that the wear rate under a constant load and the changing-stepwise load has a significant difference. Therefore, it is indispensable to conduct wear prediction of the journal bearing based on a load spectrum that reproduced from the measured service loads.
In the recent years, load spectrum is widely used to simulate the random loads when calculating and testing the fatigue of materials and structures in experiments.15,16 Morrill et al. 17 presented a method to process random load data using power spectral densities from road durability events, and found that the main influence factors of fatigue damage are load amplitude and the number of load cycles. Thawre et al. 18 studied the effect of symmetric ply-drop on the fatigue life of the composite under a standard fighter aircraft spectrum load sequence. Wang et al. 19 proposed a cyclic simulation approach to generate the non-stationary load histories of engineering vehicles for fatigue tests. Heuler and Klatschke 20 proposed the principles applied for collection and analysis of measured load data, assessment of operating profiles and generation of the respective load spectrum and sequences. It indicated that load spectrum provides a useful base for a variety of fatigue-related issues.
From these literatures, it can be seen that the load spectrum generated from measured random loads has been successfully used to characterize the fatigue performance. These researches inspired us that the random wear loads in journal bearing maybe can be accurately reproduced in the experiment or numerical simulation using the load spectrum technique. However, it must be pointed that the amplitude and the number of load cycles are the key factors affecting fatigue life of material, while in general the main factors affecting the wear life of material are the load amplitude and its lasting time. 13 Therefore, how to obtain the two parameters when generating the wear load spectrum is a main work in this study.
In this present paper, a method is proposed to generate the wear load spectrum from the service loads that measured from the journal bearings in a concrete pump under working conditions. An axle pin load sensor is designed to recognize the service load value and its orientation in real time. The amplitude distribution of the wear load and its lasting time are extracted from the measured data using the rain-flow counting method and Weibull distribution. A finite element (FE) model is developed to simulate the wear process of journal bearings based on the Archard wear model, and is validated by the experimental results in Tevrüz. 21 Comparison is conducted using this FE model for the proposed load spectrum and the measured load, and the effects of the types and sequence of load on the wear behavior of journal bearings are also discussed.
Theoretical analysis
The process of simplifying original load into load spectrum is called generation of wear load spectrum or wear spectrum compiling. In service, wear load is a time-continuous stochastic process affected by many factors. This kind of load data can be simplified into typical load spectrum using statistical method according to the damage equivalent principle. 22 The objective of research on wear load spectrum compiling method is to reflect the actual load conditions and to reduce the compilation error.
The methodology of fatigue load spectrum compiling is relatively mature and has been formulated a standard in some areas. 13 According to fatigue damage theory, the amplitude, and the number of stress cycles are the key factors affecting fatigue life of material. The main work of fatigue load spectrum compiling is to determine these two parameters of load cycles with counting method. In the field of wear, however, the key factors are the load and its lasting time. Therefore, the key of wear load spectrum compiling is to solve the problem of lasting time of load cycles. In this paper, the statistical method is adopted to deal with the problem of lasting time of load cycles. Specifically, the probability distribution of load is determined according to the rain-flow counting results, and then the lasting time is obtained from the corresponding probability of all levels of load.
A journal bearing in concrete pump is selected to illustrate the generation of wear load spectrum in this paper, as shown in Figure 1. Concrete pump is widely used in tall buildings, bridges, and underground engineering projects to pump concrete to desired locations. The journal bearings are usually installed between each delivery pipe to adjust the direction of end hose. During pumping operation, concrete can be pumped continuously. However, the pumping must pause during switch motion, and this break off lasts approximately 0.3–0.4 s, which leads to a pressure reduction in the delivery pipe and vibration in the pumping system. The journal bearings are therefore subjected to cyclic loading that can lead to wear failure. 23 Therefore, it is very important to test and generate the load spectrum of the journal bearing under working condition, and this is the basis of wear analysis and life prediction in concrete pump. In additional, the journal bearing in concrete pump operated under heavy load and low speed conditions. Considering the fact, the change in velocity is not considered as a key factor in analyzing the wear of journal bearing.

Journal bearing for concrete pump.
The main steps to test and generate the load spectrum of the journal bearing in concrete pump are shown in Figure 2. It includes service loads measurement, data pre-treatment, rain-flow counting, amplitude distribution, and load spectrum compilation.

The flowchart for wear load spectrum compilation.
Service load measurement
As shown in Figure 1, the arms connected to the journal bearing in concrete pump usually work in different space position under different construction task, and the load direction of the bearing changes with the working circumstances. The traditional axle load sensor can only measure the loads in a given direction, it mostly cannot detect the real service loads that subjected to the bearing in practice. Therefore, an axle pin with load sensors is developed to replace the traditional one in this study. The developed load sensors can simultaneously measure the maximum load on the bearing and the corresponding direction.
In the sensor, four strain gauges placed at 45 degrees along the circumference of the axel pin are used to measure the forces in the x and y axial, as shown in Figure 3, and they are divided into two bridges. One bridge is composed of strain gauges 1 and 3, and can be used to test the force Fx along the x axial; the other one is consisted of strain gauges 2 and 4, and is used to measure the force Fy along the y axial. However, it must be indicated that the measured forces Fx and Fy are not the perpendicular component forces Px and Py of the wear load in the x and y axial because the measured forces will influence each other under the action of Poisson’s ratio. This paper finds a way to recognize the component forces Px and Py from the measured forces. Based on this, the instantaneous amplitude and the direction of total wear load acted on the bearing can be obtained. The basic principle is given as follows.

Simplified axle pin with load sensors.
In general, the material deformation of axle pin only occurs in the elastic region. According to the Hooke’s law and Poisson’s ratio, the measured force Fx and Fy can be respectively defined as


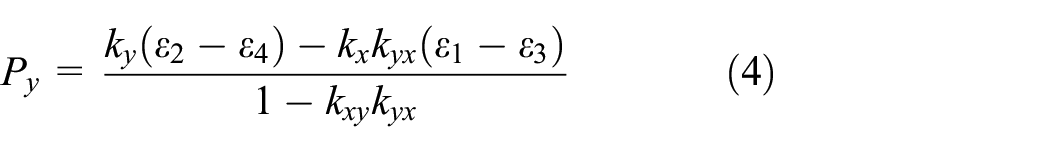
Where εi(i = 1,…,4) is the strain measured by the corresponding strain gauge; kx and ky are the correlation coefficients between the force and the strain in the x and y direction; kxy and kyx is the mutual effect coefficients for the two measured forces Fx and Fy. Based on the equations (1) and (2), the perpendicular component forces Px and Py of the wear load can be given by

Therefore, the wear load and its orientation can be given by


Where θ is the angle between the orientation of the wear load and the x direction.
Figure 4 is the calibration of the axle pin with load sensors on a bending machine. The load sensors are connected to a data acquisition system and the data is transferred to a computer.

Calibration of the axle pin with load sensors.
In the first step, 10 incremental force levels from 49 to 490 kN are applied to the axle pin in the x and y axial direction respectively in order to obtain the correlation coefficients kx and ky. For this case, the mutual effect coefficients kxy and kyx can be ignored. The kx and ky can be calculated using the measured strain from the equations (1) and (2), and the values are 116.70 and 109.62, respectively. In the next step, a constant force of 294 kN is applied and the axle pin is rotated in an interval of 30 degrees. Because the component forces Px and Py of the applied load can be calculated according to the rotated angle and the total force, the mutual effect coefficients kxy and kyx can be obtained based on the equations (1) and (2), and the values are 0.0669 and 0.0078, respectively.
To verify the robustness of the load sensors, another constant forces of 490 and 196 kN are applied. The results of the radial load and its direction obtained from the testing method are compared with the applied values, as shown in Figure 5. It can be seen that the results of load and angle between the measurement and application under three different loads have a good agreement, and the maximum errors are less than 8% and 4%, respectively. Therefore, the developed axle pin with load sensors can be used to measure the wear loads, and have a good accuracy and stability. Figure 6 shows the measurement results of the radial load on the journal bearing between the fourth and fifth arms for 48 M concrete pump under working condition.

Comparison of the radial load and its direction.

The original wear load signal in the journal bearing.
Consider the fact that the concrete pump always works under low vibration frequency that measured by an acceleration transducer installed on the arm, the low-pass filter with a sampling frequency of 100 Hz and with a cut-off frequency of 10 Hz is adopted to de-noise the original signals, as shown in Figure 7. Through the pre-treatment, the high-frequency noise is reduced efficiently, and the useful data with the wear load characteristics are obtained.

Filtered wear load signal of the journal bearing.
Rain-flow counting
Although the raw data has been pre-treated with low-pass filter, it still includes the immense mass of data that have no effect on wear accumulation, and these data are unnecessary to be simulated in the test rig. Rain-flow counting is a good procedure to separate small, uninteresting oscillations from the large ones, without affecting turning points by the smoothing effect of a filter nor interrupting a large range before it is actually completed. 24 This method is adopted in this paper to extract a sequence of simple load cycles with two parameters, namely amplitude and mean value, from the time history, and count the occurrence frequency of complete cycles. During this process, small amplitude ranges that don’t cause the wear to accumulate will be removed. Each simple load cycle is fitted using a sinusoidal load to facilitate the generation of the load in the control system of the wear test rig. In other words, complex loads will be separated into a number of relatively simple load cycles, and the amplitude and the mean value is the same as the original measured load signal.
Consider the data obtained from rain-flow counting have two random variables (amplitude and mean value), it makes the statistical analysis and simulation of load spectrum complicated, this paper tries to simple the two random variables to the one. In practice, the journal bearing of concrete pump is subjected to different loads with different construction task. However, it is worthy noted that the main load of the tested bearing doesn’t change too much since it is mainly caused by the gravity of the supported arm and the weight of the concrete in the arm, while its amplitude has relatively a high frequency fluctuation during the working. Therefore, an assumption that the fluctuation of the main load on the wear is ignored has been done in this paper. Based on this assumption, the two-dimensional random variables (amplitude and mean value, Figure 8) are simplified to one random variable (amplitude, Figure 9) using the wave center method in which the fluctuation center is the average of all load cycles. 25 It must be indicated that this simplified method is only applicable when the main load of the bearing does not change much.

Load cycles with two-dimensional variables.

Load cycles with one variable.
It can be found that the fluctuation center and the amplitude are the static component and the dynamic component of load cycles, respectively. The amplitudes are attached to the fluctuation center without considering the distribution of mean value. According to the results of rain-flow counting method, the wave center of the measured loads can be calculated, and the value is 32908.17 N.
Amplitude probability distribution
The measured load data usually cannot reflect the load conditions of the bearing completely and accurately in practice due to the limitation of the testing time and the influence of some other accidental factors. Some high loads may be not occurred during the testing, but these loads have a significant impact on the wear of bearing. To deal with this problem, the measured data needs to be extrapolated by the amplitude distribution that can be determined from the measured random loads.
Firstly, the statistical histogram of the load amplitude is calculated from the results of rain-flow countering according to the amplitude value and its occurrence number, as shown in Figure 10. Then, the distribution of amplitude is determined based on the statistical histogram. Finally, the corresponding distribution parameters are estimated.
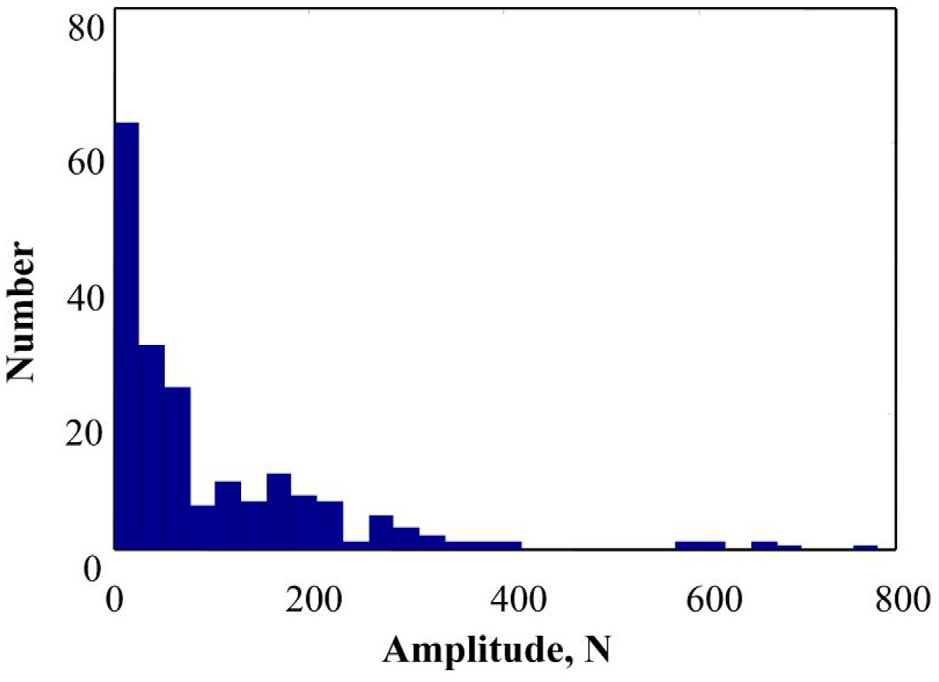
Statistical histogram of amplitude.
In general, the amplitude distribution of the measured loads is subjected to three-parameter Weibull distribution.20,22 Therefore, the shape, scale and location parameters of the amplitude distribution are obtained based on above statistical histogram, as shown in Table 1. The corresponding probability density function f(x) and probability distribution function F(x) can be given by


Three parameters of amplitude distribution.

Figure 11 shows that the result obtained from the probability distribution function of the load amplitude has a good agreement with its frequency histogram. It also verifies that the amplitude distribution of the wear load can be fitted with Weibull distribution. Based on the probability density function equation (7), the load amplitude can be calculated according to the corresponding probability. In this paper, the probability of the maximum amplitude of the wear loads is selected to 10−625. Therefore, the maximum amplitude can be given as 966.78 N using the equation (7), while the value is 783.44 N for the measured data.

Probability density function and frequency histogram.
Wear load spectrum generation
A continuous load probability distribution curve can be obtained after above statistical process of the measured load-time history. However, the continuous curve is difficult to reproduce in test rig. In practice, the continuous load curve usually is separated into several load levels, and transformed into stepwise load curve so that it can be reproduced by the control system of wear test rig.
According to the work by Conover et al., 26 dividing the histogram into eight steps was found to be sufficient to duplicate wear and fatigue effect, and this gives a program suitable for laboratory execution. They observed that the test starts at a moderate load and consists of an increasing and decreasing portion which are repeated until wear and failure occurs. Therefore, the amplitude ratio of eight steps was suggested that could be 1.0, 0.95, 0.85, 0.725, 0.575, 0.425, 0.275, 0.125, which divides the load spectrum into eight program segments. Load cycles of each load grade are equivalent to the frequency of each program segment. By combining eight program segments together, a one-period load spectrum can be obtained.
In this process, the amplitude for each level load can be calculated by the maximum amplitude multiplied by the ratio coefficient. The amplitude probability can be given by the equation (8) according to the occurrence number of the each level load. The lasting time Ti of each load can be determined by their probability, namely lasting time of each load grade is equal to the corresponding probability multiplied by the total loading time T. The main parameters of eight grades wear load spectrum is showed in Table 2. Using this approach, the eight-level amplitude spectrum can be superimposed on the wave center, and then a cycle program spectrum can be obtained. The final wear load spectrum from the measured loads is shown in Figure 12. In the wear testing, the wear load spectrum with eight level amplitude will be applied one by one until reaching the wear limitation.
Eight grades wear load spectrum.


Wear load spectrum.
Finite element simulation
The real wear load of journal bearing in concrete pump is very complicated, and difficult to reproduce in experiment. To validate the proposed method, a FE model would be developed to simulate the wear of journal bearing under the actual load and the generated wear load spectrum.
In this paper, a 2D FE model of journal bearing was built using the general-purpose finite element analysis software ANSYS, as shown in Figure 13. This study assumes that the shaft is rigid in the calculation, namely the wear just occurs at the bearing. The main parameters of the journal bearing are given in Table 3.

FE model of journal bearing in wear analysis.
Main parameters of the journal bearing.

Only cross-sectional areas of axle-pin and bearing are modeled due to the symmetry of loads and geometry about the axial axis. PLANE 42 with four-nodes elements are used to generate the mesh of the axle-pin and bearing. Surface-To-Surface contact pair is used at the pin-bearing interface. The contact elements CONTA172 are set on the outer surface of the pin, and the target elements TARGE169 are used on the inner surface of the bearing. The four nodes on outer surface of bearing are constrained. The motion of nodes on the contact surface is coupled with a single-pilot node built in the center of pin. In this type of constraint, forces or displacements applied on the pilot node are distributed to contact nodes. Two link elements with low elasticity modulus are set in the horizontal and vertical directions, respectively. The link elements allow the pin to translate or rotate in a way without rigid body motion.
A time dependent geometry of the contact surfaces is adopted in the FE model in order to simulate the kinematics behavior. Adaptive finite element wear modeling as the Rezaei et al. 8 and Dyck and Bund 27 are selected to simulate the wear of two contact surfaces through moving the contact nodes based on the following parameters: (1) The normal stresses at the contacting nodes; (2) Relative sliding of the contacting nodes; (3) Empirically determined wear coefficients.
The Archard wear model selected to express the local wear rate at each node is given by

where dh/dt is the wear depth rate; kw is defined as the wear coefficient; ν denotes the sliding speed and P is the nodal pressure.
According to equation (9), for a very small increment dt the wear depth dh can be written by

When running this model, the actual contact area changes with the ablation of the contact surface. It consequently influences the contact pressure. Therefore, it is necessary to set enough increment numbers in order to obtain a more realistic wear model. The total wear depth after the increment i is given by

where hi is the total wear depth with respect to the increment number of i, hi−1 is the total wear depth after the increment number i−1 and dhi is the wear depth of the current increment. From equations (9)–(11), the wear of a node can be calculated continuously on the corresponding contact surface. When a node is apart from its mating surface the wear depth of the increment will become zero.
Mary and Fouvry 28 indicated that the contact pressure distribution in the steady-state wear regime is almost uniform. According to the conclusion, Chen et al. 29 proposed the expression of the wear coefficient that can be obtained as

Where pave represents the average contact pressure, p0 is the referenced contact pressure, k0 is the wear coefficient corresponding to p0, and χ is a constant value. Therefore, equation (12) can be adopted to calculate the wear coefficient kw during the journal bearing wear.
Figure 14 is the flowchart for the FE wear simulation. It is composed of four basic steps as follows:

Flowchart for the finite elements wear simulation.
Results and discussion
Validation of FE wear simulation
This paper takes the experimental results of wear in Tevrüz 21 to verify the FE wear model. In this experiment, the bearing made of 35% carbon filled PTFE is used. The material of the shaft is AISI 440C stainless steel. The main parameters are given in Table 4. The number of rotations is 2.2 × 10⁵ in the experiment, and the relative sliding distance is 27.65 km.
Main parameters of the experimental bearing.

The comparison of wear mass of bearing under the radial preload 2000 N between experimental and numerical simulation with FE model is given in Figure 15. It can be seen that both wear curves have the similar trend. However, it also can be found that at the same sliding distance, the wear mass observed in the experiment is bigger than that of FE simulation, especially when the sliding distance is less than 2 km. A possible explanation for those differences is that the FE model takes a constant wear coefficient and it doesn’t consider the quick change in friction coefficient at the beginning of wear experiments. It is also shown in Figure 15 that in most cases, the differences of the wear mass between experiments and FE simulation results are less than 10% and both curves have very similar trend, therefore the FE simulation model can be used to verify the feasibility of the proposed wear load spectrum.
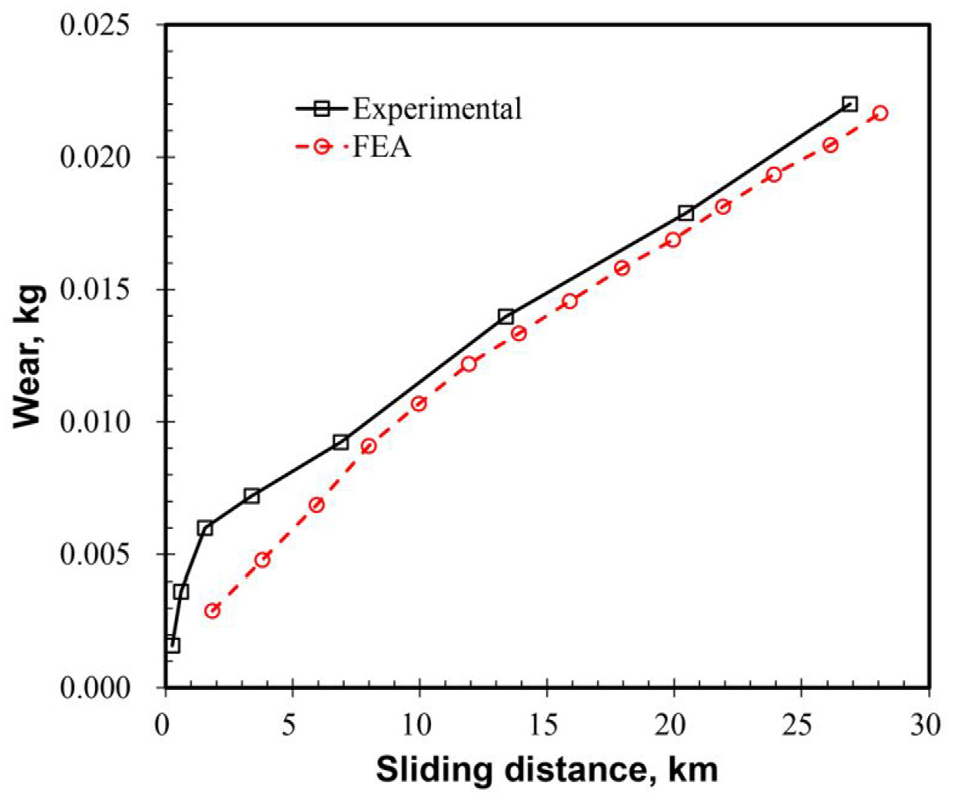
Comparison of wear between the FE simulation and experimental results.
The reason for this verification method is that the real complex load is difficult to reproduce in experiment but it is easily applied directly in the FE simulation. Therefore, the difference of the wear behavior between the actual load and the generated wear load spectrum will be compared using the FE simulation in this paper.
Effect of load types on wear
The type of load is a basic parameter to fit the load circle during load spectrum compiling, and has a significant influence on the wear performance of materials. Common load types include step load, triangle load, and sinusoidal load. Although step load is a simplest type to simulate the service load due to it is easy to generation in the control system, it usually introduces some errors comparing with the other types. In this paper, the load spectrum based on the three types of load is compiled respectively using the proposed method to study its effect on the wear. The corresponding wear loss is calculated by the FE model.
Figure 16 compares the wear of journal bearing for the three types of load and the measured load. It can be found that the wear for triangle load and sinusoidal load is similar with the value under the measured load, while the results from the step load is larger than the other ones. Figure 17 is the relative error of the wear obtained from the three types of load comparing with the one from the measured loads. From Figure 17, the maximum error for the step load is about 0.35%, while it is just 0.08% for triangle load and sinusoidal load. It means that the load spectrum based on the triangle load and the sinusoidal load can obtain a better wear simulation than using the step load. This paper selected the sinusoidal load to fit the service load circle considering the experimental control system in the future works. From Figures 16 and 17, it also can be seen that the wear loss obtained in the load spectrum based on the sinusoidal load and the measured load is in good agreement, and the relative error is less than 0.1%. Therefore, the method to generate the wear load spectrum proposed in this paper is accurate and stable to reproduce the service wear load.
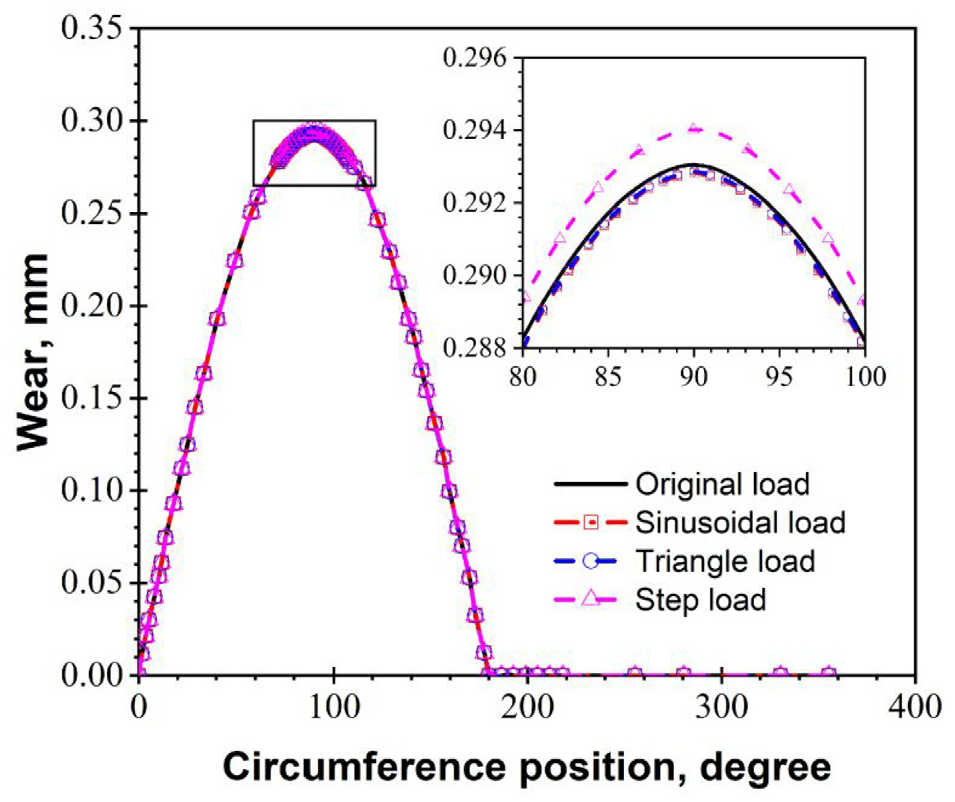
Effect of load types on the wear.

Relative errors of wear between different types of load.
Effect of load sequence on wear
The applied load sequence on the bearing is another factor that affecting the wear performance of materials, while the existing statistical methods did not consider this kind of influence. In this paper, the typical results under ascending and descending order of eight grade load spectrum are compared in Figure 18. It shows that in general the wear depth under ascending order is larger than that under descending one. The main reason maybe is that the initial applied high loads increase the contact area and the strength of material. That decreases the wear depth caused by the subsequent small loads. Furthermore, it can be found that the load sequence based on step load type has a significant impact on the wear depth, and the maximum error is about 0.6%. However, for the sinusoidal load type the effect is slight, and the maximum error is less than 0.1%. This may be caused by the fact that the load is increasing very quickly for the step load type comparing with the sinusoidal one. It makes the contact area significantly changes in a very short time and reduces the accumulation wear under the subsequent loads. The results also show that maybe the effect of load sequence can be ignored in the wear testing if the load spectrum is generated based on the sinusoidal type. The analysis results are similar with that reported by Akbarzadeh and Khonsari.30,31

Effect of load sequence on the wear.
Conclusions
In this study, a method to generate the wear load spectrum from the measured loads data is presented. Using this method, the real load condition instead of the traditional constant load can be introduced in the wear test of journal bearing so that the experimental results can reflect the service life of the bearing to the most extent. The reasonableness of the proposed approach is validated using the FE wear simulation. The effects of load types and load sequence on the wear behavior are also discussed. Based on the results presented in this paper, the following conclusions can be drawn.
An axle pin with load sensor is developed to measure the service wear load in real time from journal bearing in a concrete pump, and its robustness is verified by a bending machine.
The amplitude distribution of the wear load and its lasting time are extracted from the measured data of journal bearing. The short-term measured load cycles are extrapolated to describe the actual load-time history characteristics. The continuous load is divided into eight grade stepwise loads in order to facilitate its reproduction in the experimental tests.
A 2D FE model is presented to simulate the wear process of journal bearing based on the Archard wear model and validated by experimental tests.
The wear simulation is conducted under the proposed load spectrum and the measured load, and comparison of both cases is in good agreement. The relative error of wear depth obtained from the proposed method is lower than 1% comparing with the one from the measured loads.
The load types and load sequence have a significant impact on the wear behavior of journal bearing. The load spectrum based on the triangle load and the sinusoidal load have a better accuracy in the wear simulation than using the step load. The wear depth under ascending loads is larger than that under descending loads especially for the step load type.
In general, this study can provide a good choice to generate the wear load spectrum accurately and efficiently in journal bearing for the experimental tests and theoretical analysis. In the future works, a test rig of the journal bearing will be built to verify the robustness of this proposed approach in this paper. In additional, the degradation coefficient derived using DEG (degradation entropy generation) theory instead of Archard’s equation will be tried to use in the FE model to improve the prediction accuracy.
Footnotes
Handling Editor: James Baldwin
Declaration of conflicting interests
The author(s) declared no potential conflicts of interest with respect to the research, authorship, and/or publication of this article.
Funding
The author(s) disclosed receipt of the following financial support for the research, authorship, and/or publication of this article: This study was supported by National Natural Science Foundation of China (No. 51805412, No. 51635010), National Key Research and Development Project (No. 2020YFB2007900), Science and Technology Major Project of Henan Province under (No. 191110213300), and China Postdoctoral Science Foundation (No. 2019T120897, No. 2018M631144).