
Abstract
In ships, aerodynamic noise from the variable-air-volume fan is a common problem. This study experimentally explores the strategy of reshaping the traditional C-shaped channel structure to an L-shape to reduce noise. The noise level and resistance coefficient of the improved air distributor are analysed, and the results show that the noise of the original air distributor is 56.3 dB(A) under the rated working conditions (static pressure of 800 Pa and flow rate of 350 m3/h), which exceeds the International Maritime Organisation’s (IMO) ship noise limit (55 dB(A)). For the improved air distributor, the noise pressure level is 38.5 dB(A), the sound pressure level of high-frequency noise is reduced by 48% and the peak sound pressure level appears at 125 to 250 Hz, a frequency below the threshold of human hearing. Thus, the reshaping of the channel has a significant noise reduction effect. When the static pressure is 400 Pa and the flow rate is 100 to 500 m3/h, the sound pressure level of the improved air distributor is reduced by 29.9% to 32.2% to become less than 55 dB(A). Thus, the sound pressure level at the outlet of the improved air distributor meets the IMO ship noise standard.
Introduction
A survey of shipping accidents from the United States, the United Kingdom, Canada and Australia reported that 80% to 85% were caused by human error. 1 As the crew and passengers spend most of their time in the cabin, creating a more comfortable cabin environment is likely to improve work efficiency and overall passenger satisfaction, 2 leading to safer and more effective navigation and reduced shipping accidents due to human error. 3 The noise level is a significant indicator of cabin comfort. 4 To avoid unnecessary physical discomfort and illness for passengers caused by long-term exposure to excessive noise, research into noise reduction is receiving growing attention.5,6
The majority of studies from the industrial sector have focused on the impact of noise on the crew’s work efficiency. A review of the literature reveals that it is well established that noise has substantial negative influences on people’s lives, work and physical and mental health.7–9 In May 2012, the International Maritime Organisation’s (IMO) Maritime Safety Committee approved the ‘Code on Noise Levels on Board Ships’ to amend the noise limits for each area of ships, reducing the noise limit for the accommodation cabins of ships weighing more than 10,000 tons from 60 to 55 dB(A). 10
One important source of noise is the air-conditioning system, and a range of noise reduction measures can be used. First, the noise can be restrained at the source. To reduce noise from the compressor, its internal and external structure can be modified to simultaneously restrain vibration noise (50–150 Hz) and aerodynamic noise (800–1600 Hz).11,12 The main noise source from the air-conditioning unit is the pneumatic blower, 13 for which the traditional noise reduction strategies include changing the design of the blowers and their blades.6,14 However, because accommodation cabins are generally far away from the air-conditioning machine room, most of the air-conditioner noise comes from indoor units. The second strategy is noise reduction along the transmission path. The application of mufflers for this purpose is an attractive option,15,16 as they provide a high level of attenuation. 17 However, mufflers can only reduce the noise of the air inlet and outlet of the aerodynamic equipment or the noise of ventilation pipes, and cannot significantly protect the cabin crew. A third approach to improving the acoustic environment of the cabin is to reduce the terminal noise of the air-conditioning system. In practical applications, the air distributor evenly mixes the incoming air with the indoor air to meet the indoor heat and humidity needs. 18 However, the air distributor itself generates both outlet noise and radiation noise, which are superimposed and affect the indoor acoustic environment together with the noise from the tuyere. The design of existing air distributors is based on a flow channel structure. This is not ideal, as the structure gives rise to turbulent vortices inside the distributor, 19 which result in relatively high aerodynamic noise.
Through several modifications, including changing the size of the static pressure box, increasing the thickness of the silencer cotton, optimising the outlet shape and enlarging the internal baffle, which together effectively improve the noise reduction effect of the air distributor’s static pressure box. 20 Li invented a low-noise air distributor that uses several small-diameter guide tubes to guide air. The airflow in the guide tubes does not form a vortex, and it thus reduces aerodynamic noise, 21 but the pressure loss of the small-diameter flow path is large, which is not conducive to uniform air supply. Zhang argued that it is necessary to avoid excessive modification of the cross-section of the air distributor to prevent resistance loss. He further demonstrated the effectiveness of improving the flow field pipeline from a sudden cross-section pipeline to a progressive tube pipeline based on an analysis of the pressure-drop loss of the flow field and the transmission loss of the sound field. 22 An air distributor with multiple twists and turns of the ‘muffler’ was also invented, which substantially reduces the noise index due to U-shaped rotating airflows inside the box. 23 However, this type of air distributor has a relatively large resistance coefficient and poor energy efficiency. The existing air distributor cannot be simultaneously improved with respect to the noise and resistance coefficient.
This study addresses the noise problem of the air distributor. The noise generated by the air distributor is generally composed of two parts. One part is the vibration noise caused by the vibration of the pipe components when the air flows. And the other part is the aerodynamic noise generated by the air distributor mainly comes from the poorly designed cavity structure and flow channel structure, which causes the air to form a vortex and generates air flow regeneration noise. 24 This paper describes a study of the experimental noise measurement of an air distributor. Based on the noise generation mechanism and measurement, the acoustic parameters of the air distributor, including the sound pressure level, are analysed before and after a set of design improvements to explore the effect of aerodynamic noise optimisation of the air distributor.
Improvement of channel structure
The air distributor is mainly composed of a static pressure box, a baffle with sound-absorbing cotton and an air inlet and outlet. Figure 1 shows the structural design of the original air distributor. The size of the static pressure box is 600 × 450 × 200 mm. The air inlet diameter is 125 mm and the outlet diameter is 240 mm.
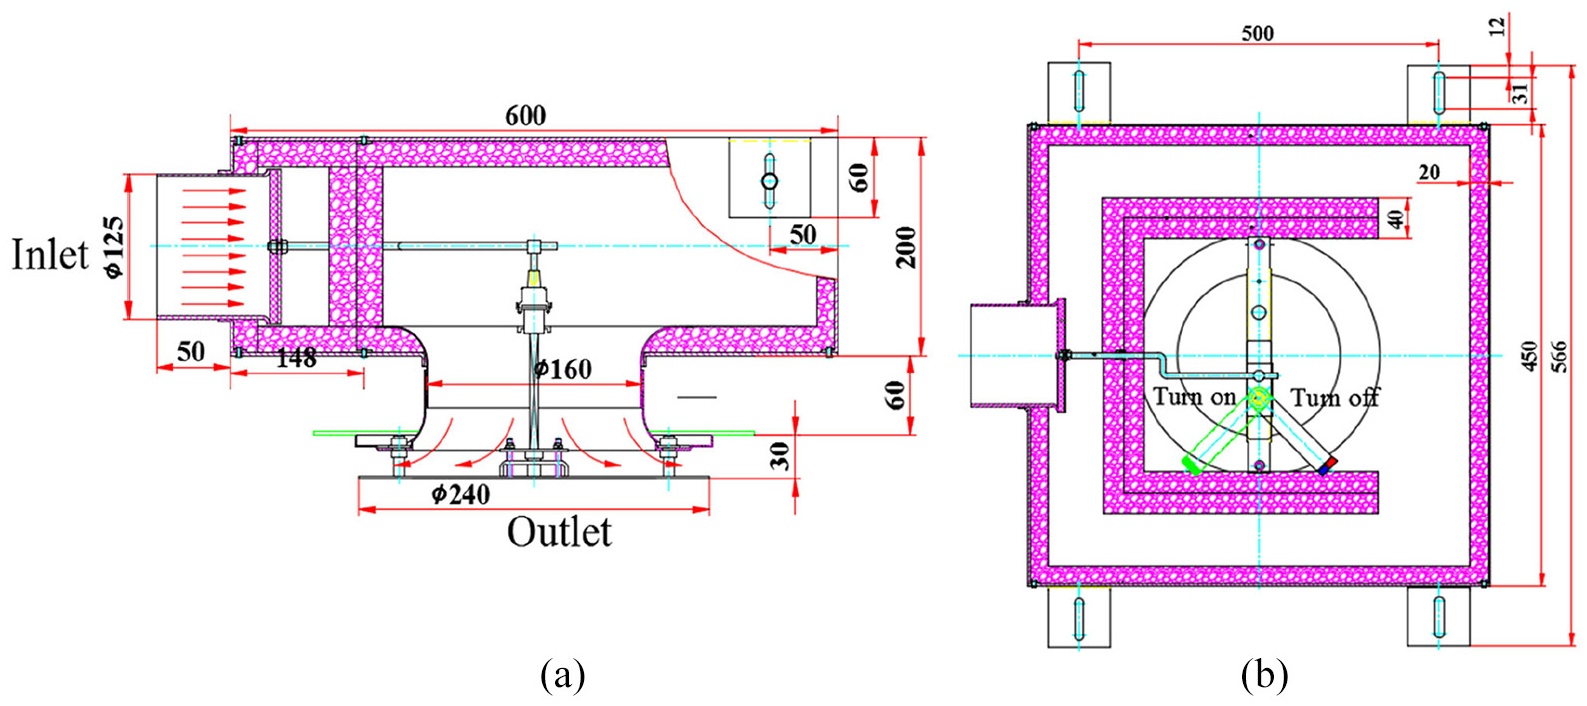
Structural diagram of the original air distributor (all numbers refer to dimensions in mm and ϕ is the diameter): (a) side view and (b) top view.
Because the overall dimensions of the air distributor are generally fixed by the manufacturer, the design improvement starts from the internal channel. The traditional C-shaped flow channel in an air distributor causes several problems, such as uneven flow field distribution, large aerodynamic noise and a high resistance coefficient. In addition, due to the difficulty in manufacturing the curved channel structure, the installation and layout of the downstream variable air volume controller are limited. In this study, the internal structure is adjusted to an L-shaped channel, which has a large internal space and is convenient for the integrated production of variable air volume controller. The internal flow channel structure is shown in Figure 2.

Structural diagram of the improved air distributor (all numbers refer to dimensions in mm and ϕ is the diameter): (a) side view and (b) top view.
During the design process, it was found that there were three main structural parameters of the L-shaped channel (labelled h, d and D, as shown in Figure 3) that directly affected the noise and resistance performance of the air distributor. Only appropriate combinations of these parameters can ensure the stability of the air flow in the air distributor. Figure 4 compares the experimental values of the resistance coefficient between the original air distributor and the improved design with h = 81 mm, d = 141 mm and D = 177 mm (the experimental process of measuring the resistance coefficient is described in Feng et al. 25 ). When the static pressure is 400 Pa and the flow rate is 350 m3/h, the resistance coefficient of the improved air distributor is reduced by 23.8% compared with the original design with respect to the maximum amplitude. When the static pressure is 800 Pa and the flow rate is 400 m3/h, the minimum amplitude is reduced by 11.4%. However, the reduction of the resistance coefficient does not by itself confirm that the noise problem has been effectively mitigated. Therefore, the noise levels were experimentally explored according to the determined structural parameters.

Model diagram of the interior area of the air distributor. 25

Experimental values of the resistance coefficients for the original and improved air distributors.
Acoustic experiment
The acoustic performance of the air distributor was measured based on the national standards GB/T 4760-1995 ‘Acoustics—Measurement Procedure for Silencers’, 26 GB/T 25516-2010 ‘Acoustics—Laboratory measurement procedures for ducted silencers and air-terminal units loss, flow noise and total pressure loss’ 27 and GB /T 3767-2016 ‘Acoustics—Determination of sound power levels and sound energy levels of noise sources using sound pressure—Engineering methods for an essentially free field over a reflecting plane’. 28
Acoustic parameters
Sound pressure level
Air forms a very thin boundary layer on a solid surface under the action of viscous force. The air in the boundary layer is easily disturbed to produce pressure pulsation, which drives the surrounding air to compress or expand periodically. Macroscopically, this manifests as the sparse and dense parts of the acoustic medium. Atmospheric pressure is disturbed by sound waves to produce sound pressure. It is more convenient to use the sound pressure level, Lp, rather than the sound pressure itself, to express the strength of sound. The conversion between the sound pressure level and sound pressure is expressed by equation (1). 26

where p is the actual pressure, Pa. p0 is the reference pressure, 2 × 10⁻⁵ Pa. Lp is the sound pressure level, dB.
Sound power level
Sound power and sound power level can be regarded as objective quantities independent of the environment, and can be used to describe and compare the level of radiated noise of the equipment under test. The sound pressure level is estimated based on the sound power level. The sound power level are expressed by equation (2). 26
where W0 is the reference sound power, W0 = 10−12 W. W is the sound power to be measured,W. LW is the sound power level to be measured, dB.
The A-weighted sound level essentially describes the frequencies that are audible to the human ear. It mainly simulates the frequency characteristics of low-intensity noise (less than 55 dB). It is currently the most widely used sound level curve in noise measurement.
Frequency, frequency course and spectrum
The frequency range of human hearing is 20 to 20,000 Hz. This range is divided into frequency bands according to a constant bandwidth ratio. Given a reference frequency f1 and a signal frequency f2 (both in Hz), the number of octaves between them, n, is calculated by equation (3). 26
For example, n = 1 and n = 1/3 correspond to a whole octave and 1/3 of an octave, respectively.
Air-conditioning system noise is generally composed of sounds of different frequencies. In acoustic analysis, a set of band-pass filters is often used to perform spectrum analysis to establish the relationship between the frequency components of the sound emitted by the sound source and the sound pressure level, which is a convenient way to study the distribution characteristics of noise.
Acoustic performance test experimental system
Figure 5 shows the layout of the experimental acoustic performance test-bench for the air distributor. The experimental platform has three adjacent rooms: the fan room, the operation room and the acoustic test room. The acoustic performance testing of the air distributor was carried out in a semi-anechoic acoustic test room established by the Shanghai Shipbuilding Industry Corporation Seven One Research Institute. All of the environmental indicators of the test room met the requirements of the standard GBT 6882-2016. The volume of empty space in the acoustic test room is 7.8 × 6.6 × 5.5 m, and the free field radius is greater than 2.5 m. The measurement error in the inlet state of the elbow is generally greater than that of the straight pipe inlet due to the turbulence of the air flow when the air passes through the elbow, the uneven air flow in the duct and the averaging of several data points measured by the wind speed sensor. Therefore, it is generally necessary to install a straight pipe section at the inlet for rectification when installing a variable-air-volume terminal device.

Schematic diagram of the acoustic experiment system.
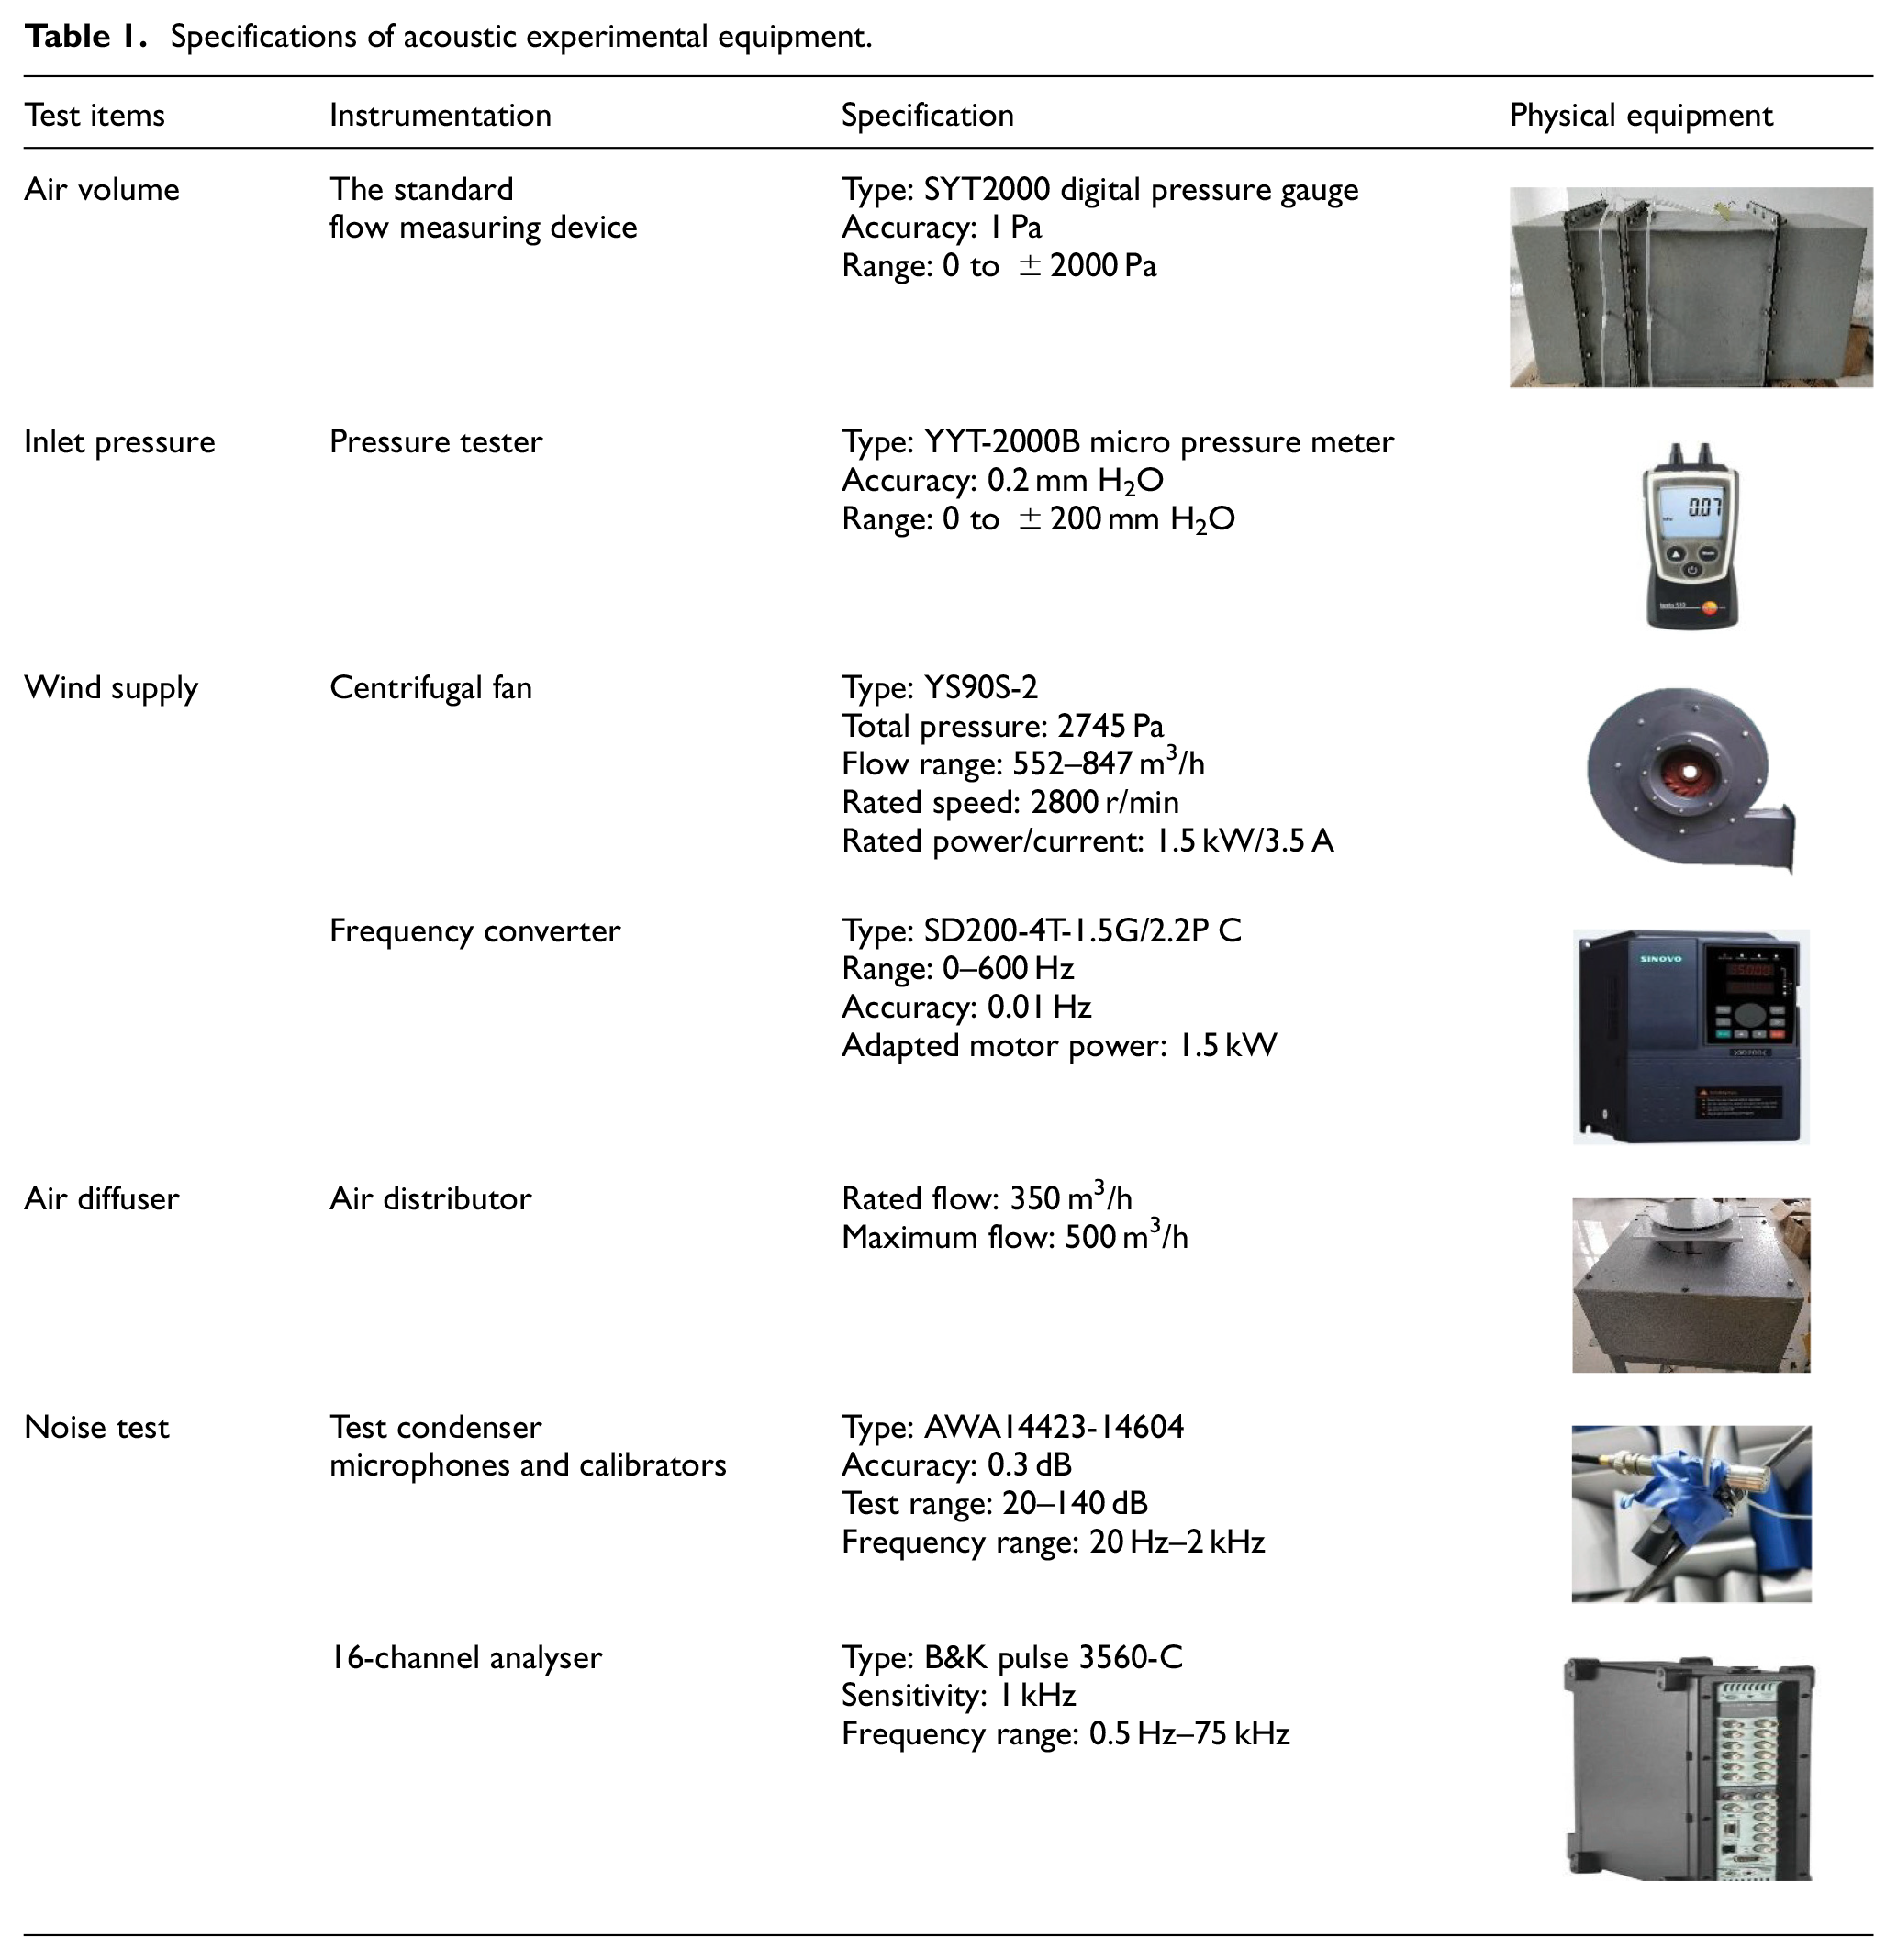
Table 1 shows the specifications of the experimental equipment. It should be noted that the air volume test uses a nozzle type standard flow measurement device. Its principle is to use the pressure difference between the inlet and outlet to calculate the air volume. Reference 25 gives the specific calculation step. For this acoustic test, the 3560-C PULSE system for analogue synthesis and analysis of multi-channel noise measurement was used (manufactured by B&K, Denmark). The system is mainly composed of acoustic and vibration sensors, binaural signal collectors, channel data acquisition recorders, digital playback systems and simulation synthesis software. The acoustic acquisition signals of multiple channels can be compared and analysed at the same time. The recorder can accurately record data including digital and analogue audio data, vibration and acceleration. In combination with analysis software, it is possible to perform digital quantitative analysis of sound and vibration signals in a specific time domain and frequency domain and analyse, filter, display and evaluate the monitored acoustic data.
Specifications of acoustic experimental equipment.
Experimental method
Under a specific flow channel structure, the dependence of the noise performance of the new air distributor on the static pressure and the opening of the air valve (air volume) was analysed. Using the noise test bench for the air distributor, the frequency converter and extent of valve opening could be adjusted while the acoustic tester was used to test the noise and sound pressure level of the fan under a specific static pressure and extent of valve opening (air volume). The curves of the relationship between the noise sound pressure level, static pressure and air volume were plotted separately. Furthermore, it was determined whether the noise pressure level of the improved air distributor met the IMO standard for cabin noise.
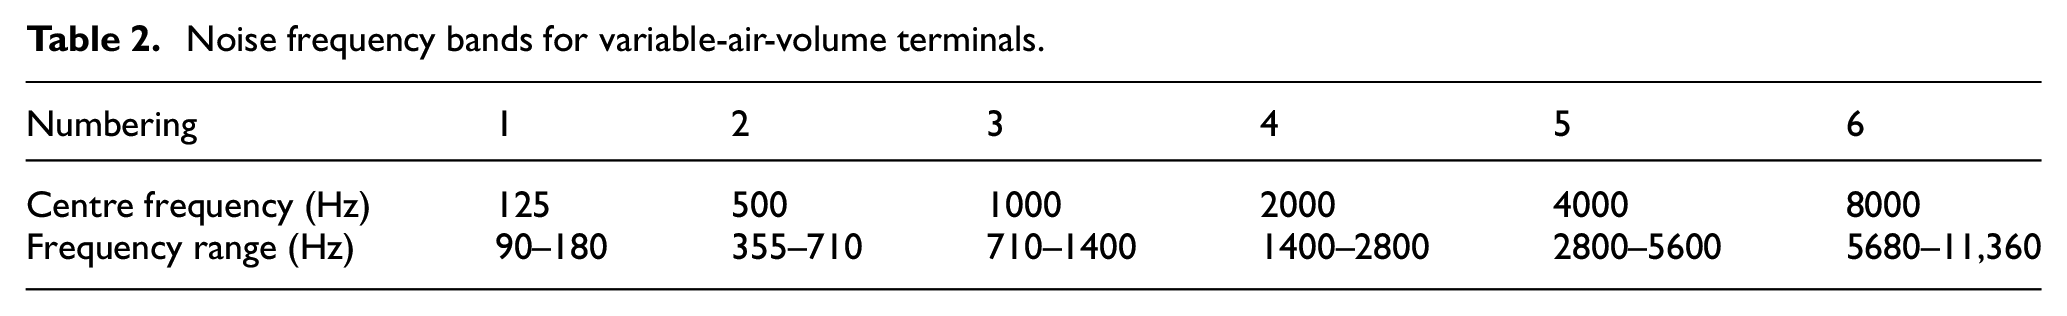
As described above, the constant bandwidth ratio is used to divide the human hearing domain (audio frequency range of 20–20,000 Hz) into multiple frequency ranges, and the ratio of the upper and lower limits of each frequency range is a constant. Generally, 1/3 of an octave is used; that is, the ratio of the two centre frequencies is 2:1. The centre frequencies are often taken to be 31.5, 63, 125, 250, 500, 1000, 2000, 4000, 8000 and 16,000 Hz, where these 10 frequency bands essentially include all audible sounds. However, in general air-conditioning system engineering and the standard certification of the Air-Conditioning, Heating and Refrigeration Institute, only seven frequency bands from 125 to 8000 Hz are typically selected, as shown in Table 2.
Noise frequency bands for variable-air-volume terminals.
The acoustic performance test bench of the air distributor is shown in Figure 6. Figure 7 is a structural diagram of an acoustic enclosure with an array of microphones positioned on the hemispherical measurement surface. The measured air distributor was placed in the centre of the acoustic enclosure. The dynamic pressure (representing the flow rate) and the static pressure (representing the inlet pressure of the air distributor) are observed. When the value is almost unchanged, the gas flow is considered stable. To further ensure the stability of the test, the noise test was started after the gas flow was stable for 5 min. When the fluctuation of the sound-level meter reading fell to not more than ±1 dB, the microphone reads the sound pressure level value at each measuring point. The test time lasts for the 20s. After the test, the data were processed to calculate the sound power level of the air distributor under different working conditions. The noise level was measured as a spatial average value using an integral sound-level meter. The sampling frequency was 0.2 Hz and the test lasted for 30 s. The acoustic test enclosure had a radius of 1 m, and 10 microphones were placed in it to receive the acoustic signals at the measuring points of the wind distributor. The locations of the measuring points are labelled 1 to 10 in Figure 7. Taking the hemisphere centre of the acoustic enclosure as the origin, Table 3 shows the location coordinates of the measuring points.
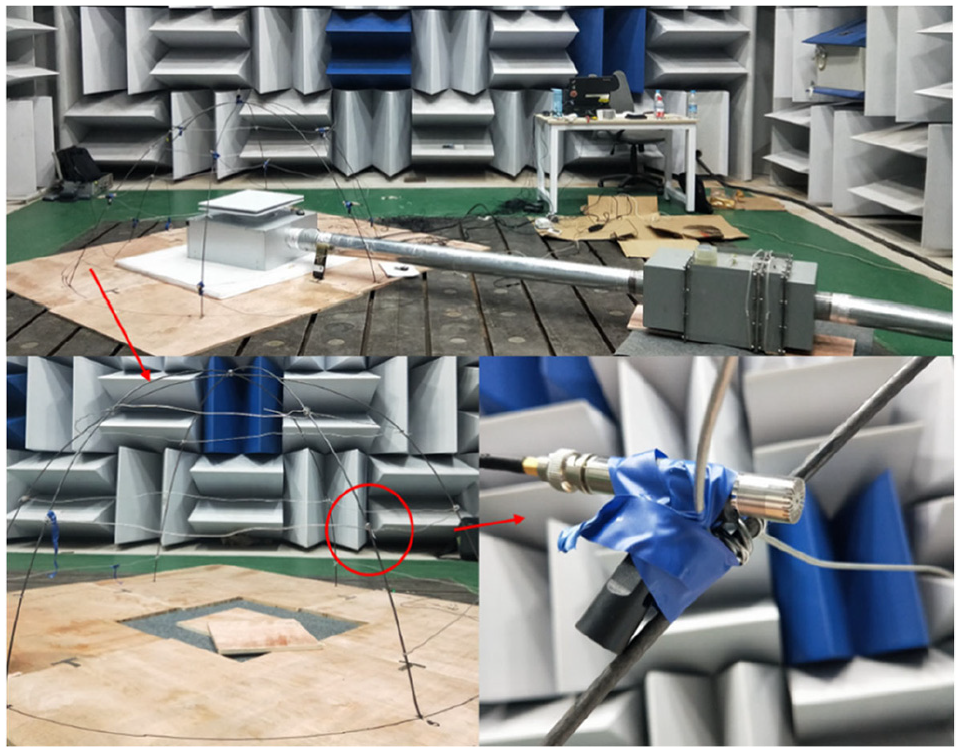
Acoustic test bench.

Structural diagram of the acoustic enclosure for the microphone array on hemispheric measurement surface: (a) side view and (b) top view.
Position coordinates of microphone measuring points.

The system was calibrated with a sound calibrator according to the standard procedure, 29 and the background noise was measured when the fan was turned off. According to the requirements in GB 12349-1990 30 and HJ 706-2014, 31 the sound level of background noise should at least than 10 dB(A) lower than that of the noise to be measured. When the difference between the two values is greater than 10 dB(A), there is no need to correct the noise measurement value. When the difference between the measured value and the background value is within the range of 3 to 10 dB(A), the measured result needs to be corrected according to Table 4.
Table of corrections for measured noise value when it differs from background noise by 3 to 10 dB(A).

The extent of valve opening and the frequency of the fan inverter were adjusted to ensure that the air volume and inlet static pressure simultaneously met the requirements of the working conditions. Then, the airflow noise measurement was performed. This required keeping the laboratory environment free from both internal and external noise, tightly closing the door of the acoustic test room, and opening all sound transmission channels. Acoustic data of the 10 measurement points in a free sound field with a radius of 1 m around the air distributor were recorded, including the seven-octave sound pressure levels and A-weighted sound pressure levels with centre frequencies between 125 and 8000 Hz.
Experimental steps
Under varied working conditions, the specific experimental procedures of the acoustic performance experiment of the air distributor were as follows:
Fans, ducts, air distributors and their brackets were installed. The connection between the test room and the equipment was completely sound-insulated. The test instruments for wind pressure and air volume were connected.
The acoustic enclosure was arranged, the microphones were fixed, and the microphones were then connected to the analyser and the computer.
Working conditions were debugged. As in test condition 1 (the design parameters of each condition are shown in Table 5), the extent of valve opening and fan frequency were adjusted so that the static pressure and dynamic pressure before the inlet of the air distributor were 400 and 3.32 Pa respectively. The extent of valve opening and fan frequency at this time were recorded.
The acoustics were tested. The doors and windows of the acoustic test room were closed to keep the environment quiet. Background noise (including environmental noise such as fans and pipes) was tested. The air distributor to be tested was placed as far as possible from the background noise source.
Acoustic information was collected through the 10 microphones at the outlet of the fan. Using the 16-channel B&K analyser and dedicated software Pulse Labshop, the sound pressure level was calculated and recorded. This completed the procedure of test condition 1.
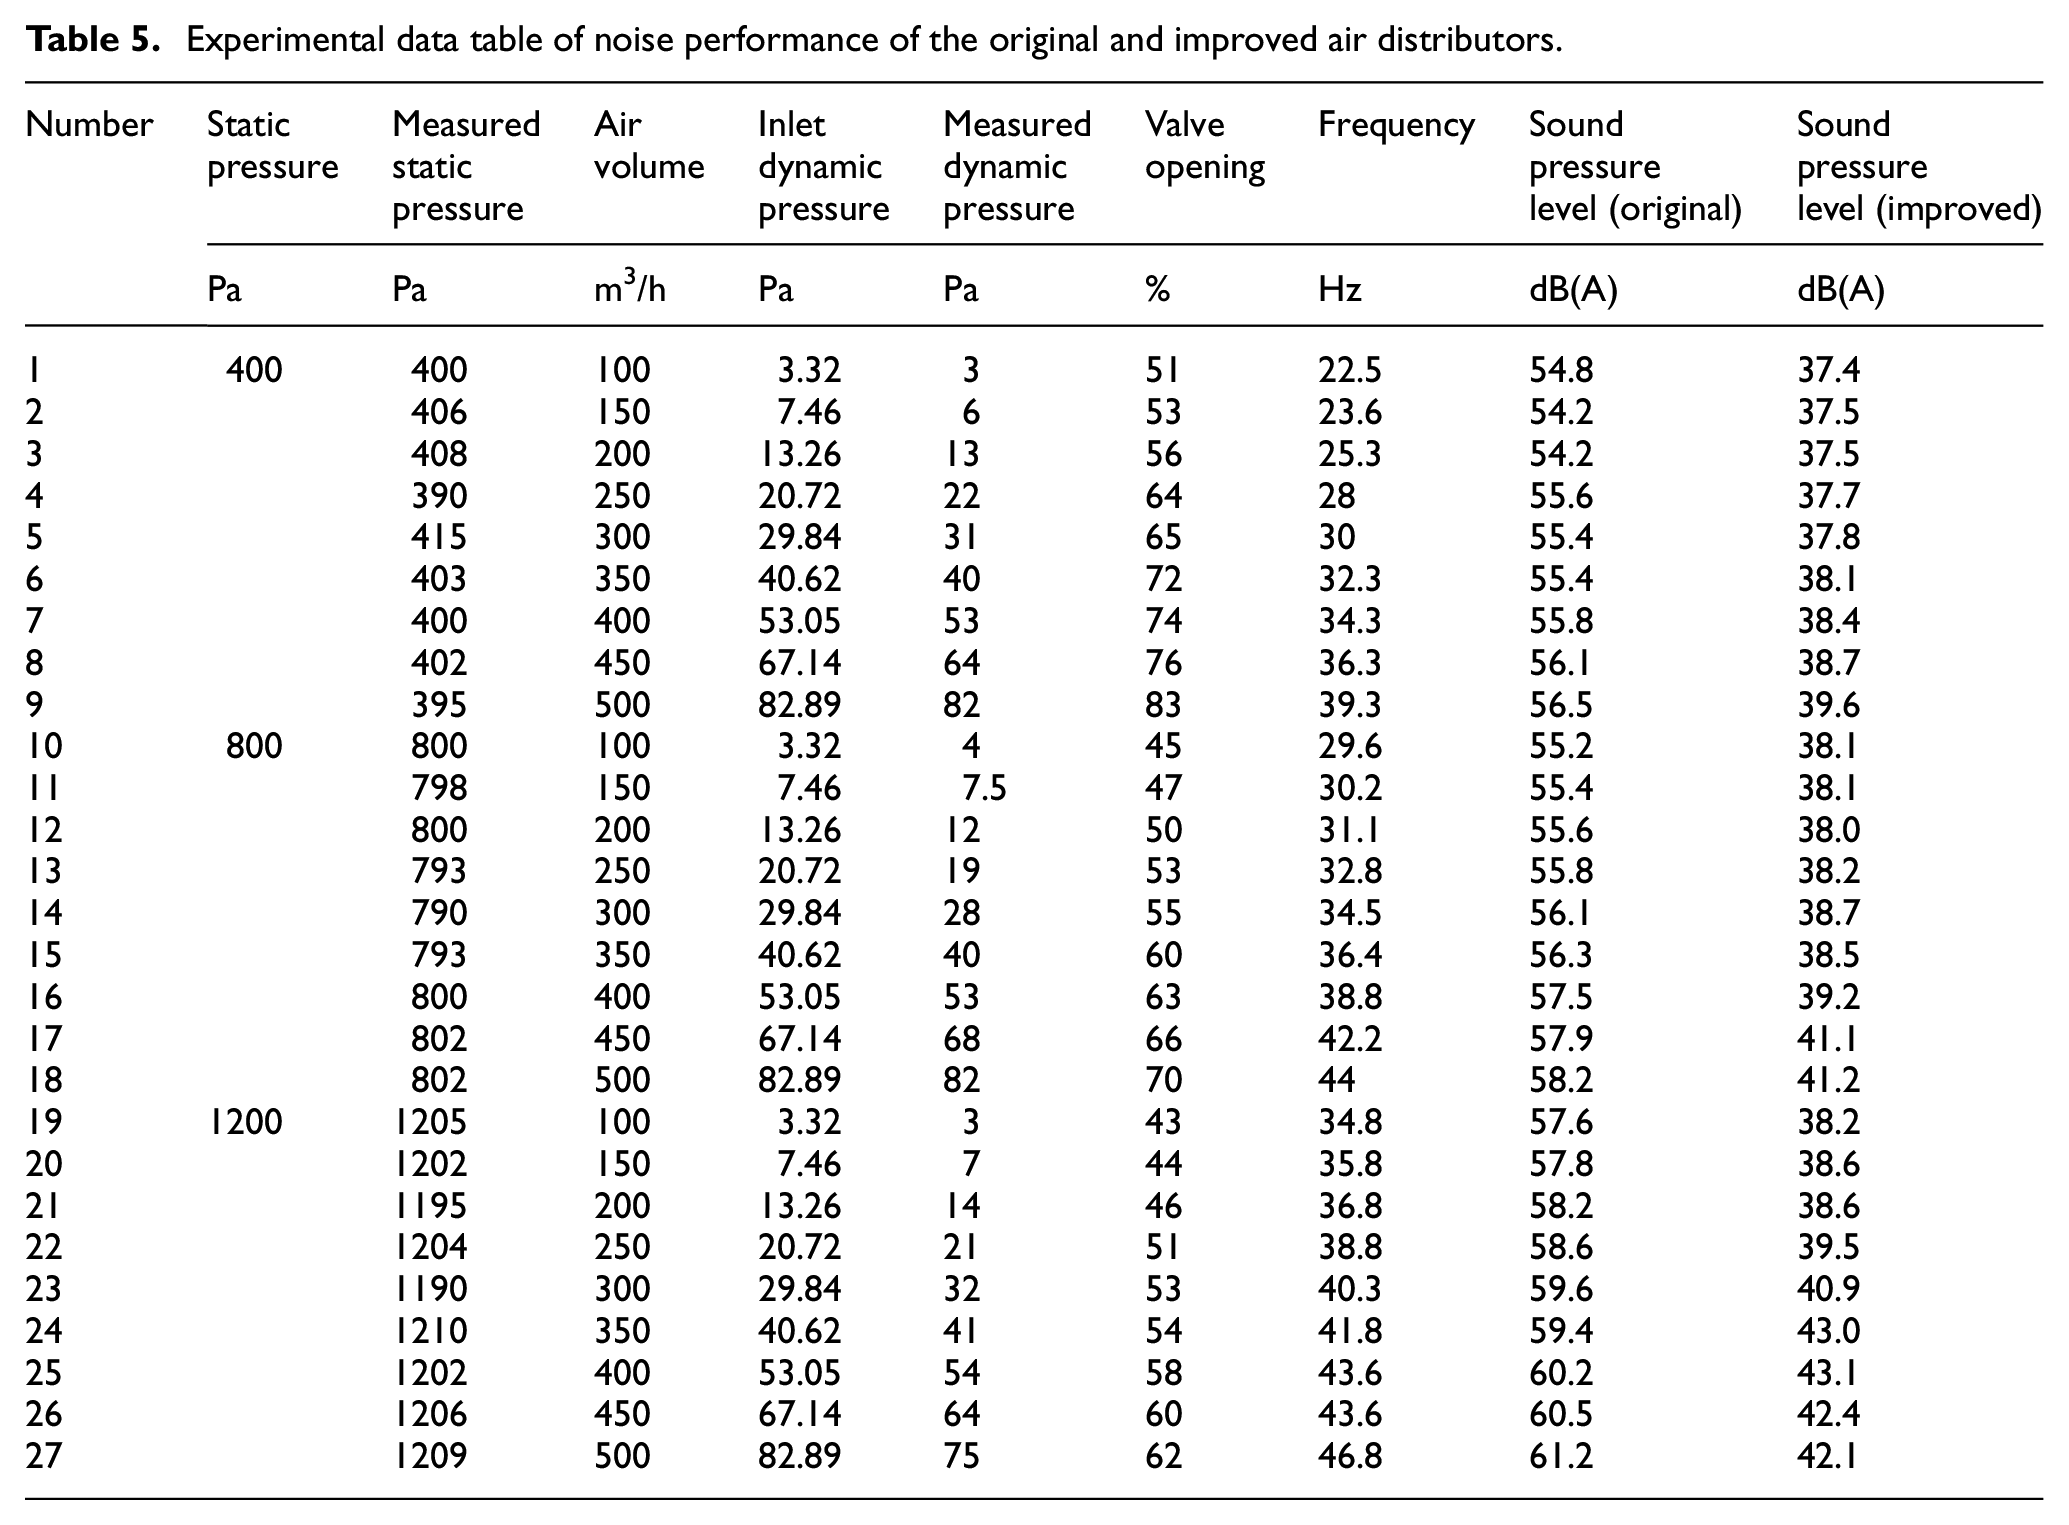
Experimental data table of noise performance of the original and improved air distributors.
Results and discussions
The relationship between sound pressure level and air volume
Figure 8 shows the relationship between the actual air supply volume of the air distributor and the noise sound pressure level. It can be seen that the noise of both the original and the improved air distributor increases with the increase of air volume under the same static pressure. However, the noise of the original air distributor is higher than 55 dB(A) under most conditions, which exceeds the IMO ship noise standard. Compared with the original air distributor, the aerodynamic noise of the improved air distributor is significantly reduced to lower than 45 dB(A) under all conditions. When the static pressure is 400 Pa, the sound pressure level of the improved air distributor is reduced by 29.9% to 32.2% at the flow rate of 100 to 500 m3/h. When the static pressure is 800 Pa, the sound pressure level of the improved air distributor under each flow condition is reduced by about 30%. When the static pressure is 1200 Pa, the corresponding reduction is 27.6% to 33.7%. It can be seen that the noise level of the air distributor with the L-shaped channel structure meets the IMO noise standard.

Acoustic test results of original and improved air distributor.
Spectrum analysis
In the aerodynamic noise experiment, the total sound pressure level of the measuring points was calculated from the octave sound pressure level of each measuring point i by equation (4).

where LPi is the sound pressure level of the i-th frequency band, dB. LPTi is the total sound pressure level of all frequency bands at the i-th measuring point, dB.
The average sound pressure level of the measuring surface was calculated from the acoustic data collected from all of the measuring points on the acoustic enclosure using equation (5).

where
Taking a typical rated working condition (static pressure of 800 Pa and air volume of 350 m3/h) as an example, Figure 9 shows the experimental results of the sound pressure level of the 10 measuring points in all frequency ranges after the air distributor established stable operation. It can be seen that after improvement, the total sound pressure level is reduced by 23.4%. The air supply noise of the air distributor is mainly high-frequency noise due to airflow turbulence. Figure 10 is the noise spectrogram of the fan. It can be seen that the noise peak of the original air distributor appears at 2000 to 4000 Hz, which has a substantial impact on the A-weighted sound pressure level. After the improvement, the sound pressure level of high-frequency noise drops by 48%, and the peak sound pressure level appears at 125 to 250 Hz, which is a low frequency to which the human ear is not sensitive. The noise reduction effect is remarkable.

Comparison of the total sound pressure level of each measuring point under 800 Pa and 350 m3/h.

Noise spectrogram of the original and improved air distributor under 800 Pa and 350 m3/h.
Figure 11 shows the 1/3 octave sound pressure level of each measuring point for the original and improved air distributor. At a static pressure of 800 Pa and air volume of 350 m3/h, the average sound pressure level of the original air distributor is 56.3 dB(A). Under the same working conditions, the average sound pressure level of each measuring point after the improvement is 38.5 dB(A), which is 17.7 dB(A) lower than the original. The sound pressure levels at the 10 measuring points are more uniform after improvement. This shows that the internal flow field of the air distributor has been significantly improved.

Comparison of 1/3 octave sound pressure level of original and improved air distributor under 800 Pa and 350 m3/h.
Table 5 shows the complete data of the noise performance experiment for the air distributor before and after the improvement under various working conditions. It can be seen that when the air volume is constant, as the extent of valve opening decreases, the noise value of the air distributor gradually increases. More importantly, the noise also increases rapidly. When the extent of valve opening has a fixed value, the noise increases with the increase of air volume. Because the valve is always more than 40% open, the resistance coefficient of the air distributor is significant. Furthermore, turbulent vortices near the surface of the wind deflector and the internal flow channel cause high-frequency aerodynamic noise. After the improvement, the sound pressure level at the outlet of the air distributor is below 55 dB(A), which meets the requirements of the IMO ship noise standard.
Error analysis
During the acoustic experiment, 10 condenser microphones collected the sound pressure levels at 10 measurement points. Then, the acoustic signal was passed into the 16-channel analyser. There thus were possible measurement errors due to the microphones themselves and the collected sound pressure levels at various frequencies. The total sound pressure level obtained by the analyser is in fact an indirect measurement.
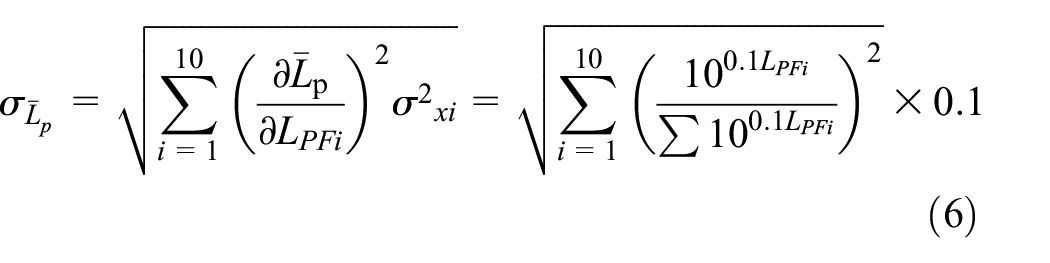
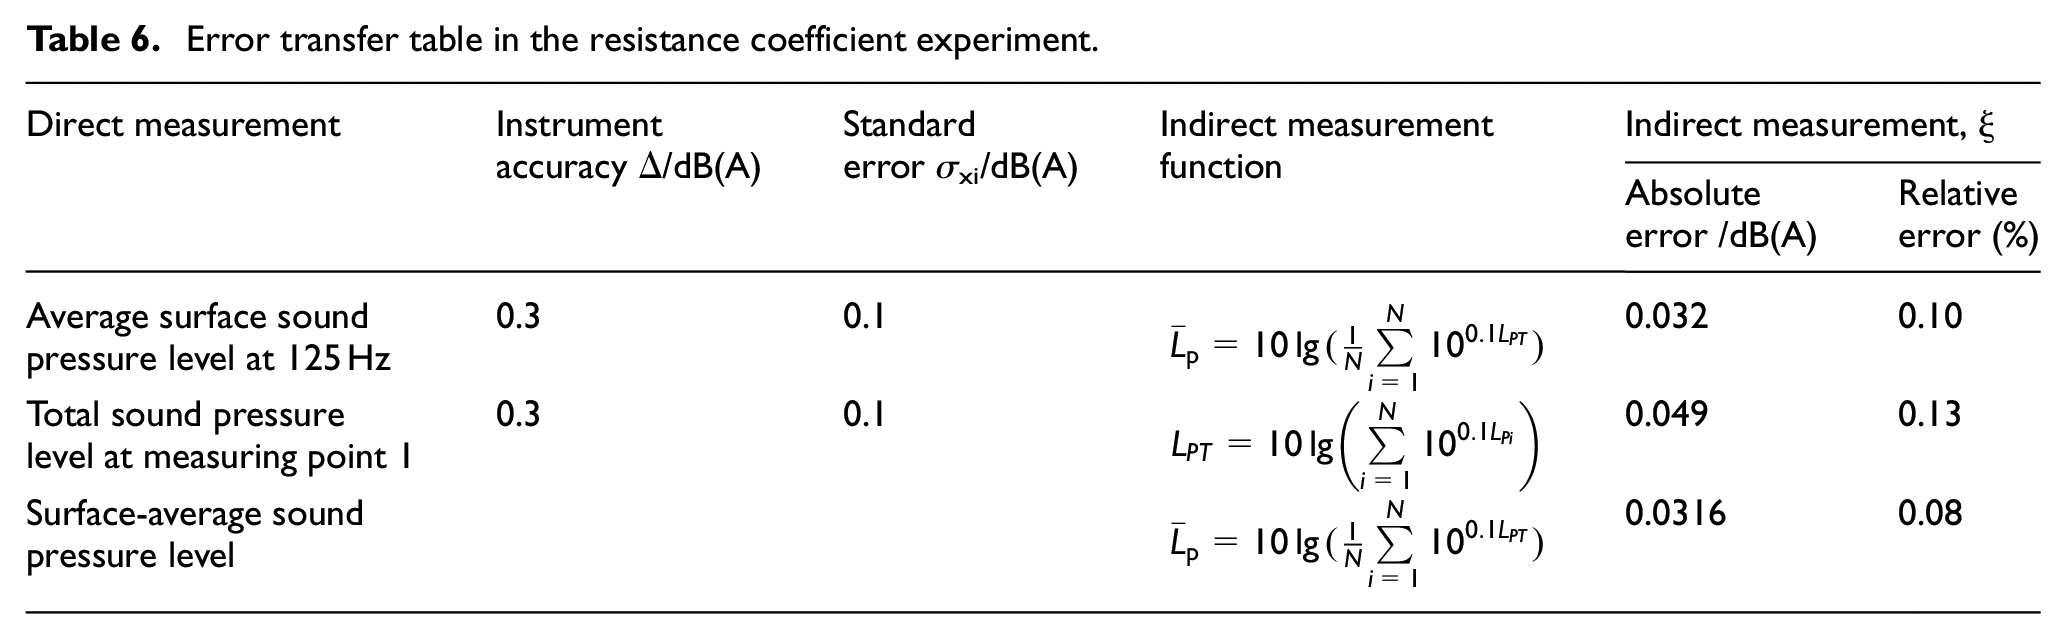
Taking the improved air distributor with a static pressure of 800 Pa and a flow rate of 350 m3/h as an example, equation (6) is the error transfer function of the surface-average sound pressure level measurement at a certain frequency.
Equation (7) is the error transfer function of the total sound pressure level measurement at a certain measuring point.

Table 6 shows the error transfer of the experimental results. At a frequency of 125 Hz, the calculated result for the surface-average sound pressure level has an absolute error of 0.032 and a relative error of 0.1%. The absolute error of the total sound pressure level at measuring point 1 is 0.049, and the relative error is 0.13%. The absolute error of the surface-average sound pressure level over the entire frequency range is 0.0316, and the relative error is 0.08%.
Error transfer table in the resistance coefficient experiment.
Conclusion
In this paper, an experimental platform for assessing the acoustic performance of an air distributor was built. Through the analysis and comparison of the noise parameters of an original and an improved air distributor, the following conclusions are drawn.
After changing the C-shaped flow channel structure of the traditional air distributor to an L-shaped channel, the resistance coefficient was significantly reduced under various working conditions, with a maximum reduction of 20.7%. At the same time, at static pressures of 400, 800 and 1200 Pa and air volumes from 100 to 500 m3/h, the outlet sound pressure level of the improved air distributor was lower than 55 dB(A), which meets the requirements of the IMO cabin noise standards. The reshaping of the air distributor structure reduced the resistance coefficient and aerodynamic noise at the same time.
Under the rated working conditions (static pressure of 800 Pa and air volume of 350 m3/h), the noise of the improved air distributor was reduced from 56.3 to 38.5 dB(A). The noise frequency of the original air distributor was mainly high-frequency noise, which contributed substantially to the A-weighted sound pressure level. The improved noise was mainly concentrated in the low-frequency area, where the human ear is less sensitive. Its contribution to the A-weighted sound pressure level was smaller, so the total sound pressure level dropped.
The spatial distribution of the sound pressure level was more homogeneous for the improved air distributor. This shows that through the improvement of the flow channel structure, the internal flow field of the air distributor was significantly improved. In actual applications, the layout of the air distributor will result in a top-type air supply, and there will be natural attenuation of noise in the room and absorption of sound by soft furnishings, so the actual noise perception of people in the room will be slightly less than the measured value in the laboratory.
If the variable air volume valve is not opened fully enough, the noise at the end will increase. When the extent of valve opening is constant, the noise of the variable air volume air distributor increases with the increase of the air volume. The smaller the extent of valve opening, the greater the noise under the same air volume. The valve of the variable-air-volume distributor should be designed to avoid it being too narrowly opened for too long a time, which would mitigate the large aerodynamic noise of the air distributor.
Footnotes
Appendix 1
Acknowledgements
The authors would like to thank Jiangsu Zhaosheng Air Conditioning Co., Ltd. and Shanghai Marine Diesel Engine Research Institute for providing assistance with the research and experiment. We are very grateful for the help of Guozhi Bao from Jiangsu University of Science and Technology and Dachuan Shi from Hong Kong University during the experiment.
Handling Editor: James Baldwin
Declaration of conflicting interests
The author(s) declared no potential conflicts of interest with respect to the research, authorship, and/or publication of this article.
Funding
The author(s) disclosed receipt of the following financial support for the research, authorship, and/or publication of this article: This work was supported by the Jiangsu Provincial Graduate Research and Practice Innovation Program (SJKY19 No. 2652).