
Abstract
To improve the forming quality of V-shaped clamps, a basis for optimal V-shaped clamp mold surface design is provided.
In this paper, the V-shaped clamp stamping process is simulated using Abaqus and the influence of the mold’s friction coefficient on the V-shaped clamp stamping parameters is revealed. The regional friction coefficient of the V-shaped clamp mold surface is optimized using an equal horizontal design scheme and the optimal friction coefficient combination for the mold surface is obtained, along with comparison and analysis of the molding parameters before and after optimization.
Results show that the mold’s surface friction properties have significant regional characteristics. Increasing the friction coefficient of the bottom, the rounded section of the punch’s V-shaped groove and the bulge filleted corner of the punch while reducing the friction coefficient of the bulge filleted corner and crimping area of the die head contributes to the material flow. Mold surface optimization makes the material flow velocity more uniform, disperses stress on the part’s surface, reduces strain and thickness reduction of the key parts, and improves overall quality.
Measurements show that the V-shaped clamp mold’s surface friction characteristics affect the molding parameters significantly and mold optimization improves the V-shaped clamp’s molding quality.
Keywords
Introduction
V-shaped clamps are widely used in the pipeline connections of automotive exhaust systems.1,2 Because these clamps have some complex features, such as convex plates and arc surfaces, these clamps are prone to failure forms such as tearing and wrinkling in the stamping process, which seriously affects a clamp’s usability. The traditional method used to address this problem is to increase or reduce the fillet radius and the clearance of the concave-convex die, reduce or increase the blank holding force at the sections that are easily cracked or wrinkled and promote or inhibit the material flow.3,4 However, changes in the mold geometry inevitably affect the forming shape, and change in the geometry of the functional area affect the usage performance of the clamp directly. In addition, this method is strongly dependent on experience. There is no perfect theoretical basis from which to obtain the optimal parameters available to date.
Researchers around the world have analyzed the stamping processes5,6 of hemispherical parts, cylindrical parts and elbows and have found that the friction coefficient of the mold area has a significant impact on the stamping effect. Darendeliler et al. 7 established a variable friction model to study the law by which the friction coefficient changed during the stamping process. Sanchez 8 established a friction test system for sheet metal in a plane strain state. Shivpuri and Zhang 9 optimized the friction in different areas of the punch, the die and the blank holder with an oil sump as their research object and reduced cracking and wrinkling as their goal. Lee et al. 10 analyzed the effects of the material and friction models and suggested an optimum selection of these models for springback analysis. Loeffler et al. 11 modified the surface of the tool and studied its impact on the material flow in sheet-bulk metal forming. Fu Yonghong et al. 12 selected cylindrical molds as their research object and simulated the effects of different regions on the thicknesses of the molded parts. Different areas of the mold have different friction coefficient requirements and there is an optimal combination of friction coefficients that can produce the best sheet forming effect.
In this paper, a V-clamp mold is used as the research object. Abaqus software is used to study the influence of the regional friction coefficient on the material flow and to determine the optimal friction coefficient combination for the mold surface during the molding process. The laser microtexturing active design method is used to produce the friction characteristics required by the mold and verified via experimental research. This method provides a new way to optimize the performance of V-shaped clamps.
Numerical simulation of V-shaped clamp forming
Modeling and meshing of V-shaped clamp in Abaqus
The geometric model of the V-shaped clamp mold and the sheet metal was established and meshed in Abaqus and the final finite element model is shown in Figure 1; the related parameters are shown in Table 1 and the shape and size of the sheet are illustrated in Figure 2. The upper die, lower die and blank holder are defined as a three-dimensional discrete rigid body and the element type is the four-node three-dimensional linear rigid shell element 3 (R3D4) type. The numbers of elements for these three components are 4460, 5512 and 137, respectively. The metal sheet is defined as a three-dimensional deformable body, the element type is the four-node quadrilateral finite film strain linear reduction integral shell element (S4R) and the number of elements is 5581.

Finite element model of the V-shaped clamp mold.
Model parameters.


Sheet size and shape.
Measurement of initial friction coefficient
The purpose of this test is to measure the initial friction coefficient between the die and the sheet metal during the pressing process, which then provides a reference measure for the parameter settings in Abaqus.
The test is conducted on the reciprocating module of the Rtec multi-function friction and wear testing machine (MFT-5000, Rtec Instruments, San Jose, CA, USA), as shown in Figure 3. The upper test sample is a cylinder with diameter of 6 mm and a height of 20 mm and the material of the upper die is SKD11 steel, which is the most common die raw material. The lower test sample is a block with dimensions of 35 mm × 25 mm × 2 mm and the block material is SUS 304 steel, which is a common raw material for V-shaped clamps. The lower test sample has a 20-mm reciprocating motion whereas the upper sample remains fixed.

Reciprocating module of the Rtec friction and wear testing machine.
In accordance with the real production conditions for the V-shaped clamp, the parameter settings for the friction test are as follows: the loading force is 80 N, the pressure is 2.83 MPa, the speed of lower test sample movement is 20 mm/s and the lubrication material is drawing oil, with 4 ml being used each time. The friction coefficient is collected during the test and the test is stopped after the friction coefficient is stabilized.
The results of the initial coefficient of friction (CoF) test are shown in Figure 4. The friction coefficient becomes stable after 60 s; therefore, the Abaqus numerical simulation uses 0.16 as the initial friction coefficient between the die and the sheet metal.

Initial coefficient of friction test results.
Simulation of forming thickness
As shown in Table 2, the material parameters for the finite element analysis (FEA) simulation are set according to the V-shaped clamp production conditions. The contact pressure is 2.83 MPa and the press speed is 20 mm/s with a 150-mm press stroke. The metal sheet is composed of SUS 304 with a 2-mm thickness and the friction coefficient is 0.16.
Basic physical parameters of SUS 304 sample.

To obtain the thickness distribution of the V-shaped clamp and select the appropriate partition scheme, the V-shaped clamp forming process is simulated and the simulation results are shown in Figure 5. Figure 6 shows the thinnest regions of the clamp, which appear in the tab round area and the transition area and are easy to crack. Therefore, in this work, further FEA simulations with variable friction coefficients are conducted to avoid or reduce the risk of cracking in these two areas.
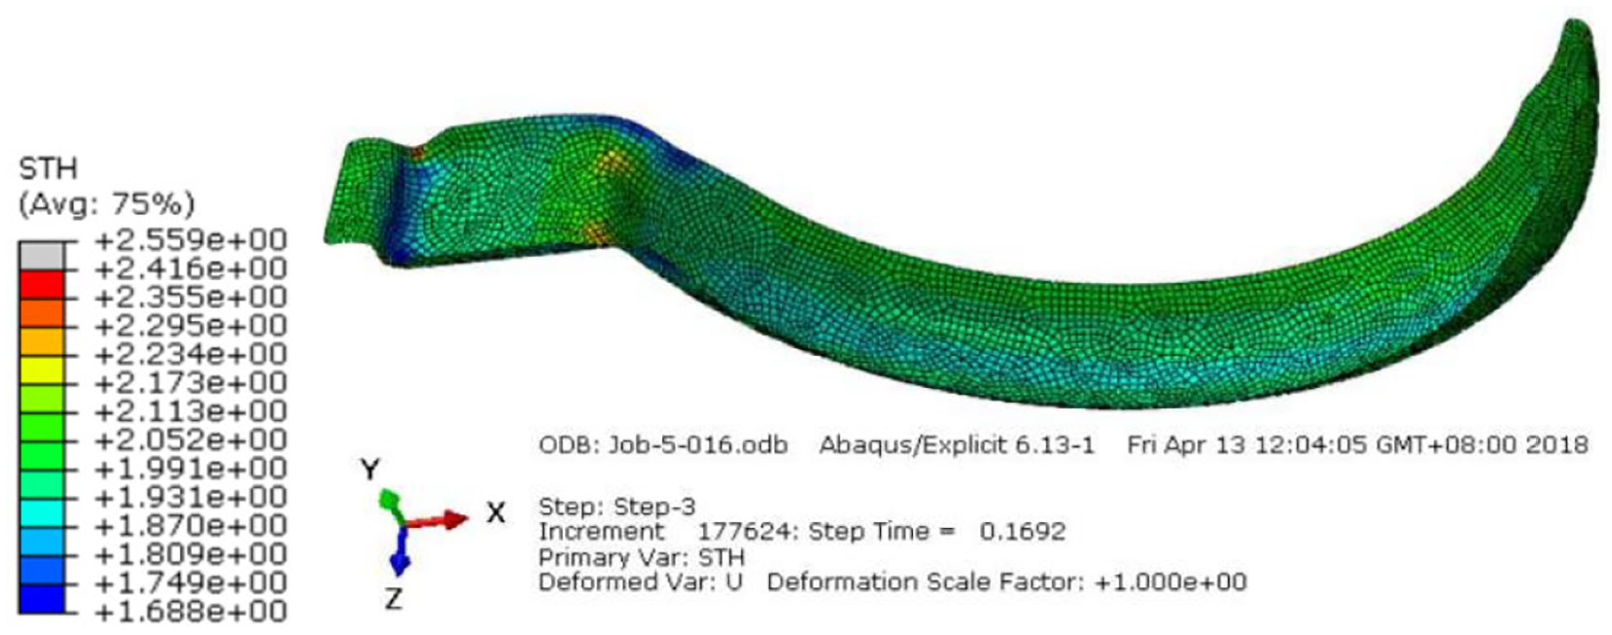
Thickness distribution mapping of the V-shaped clamp.
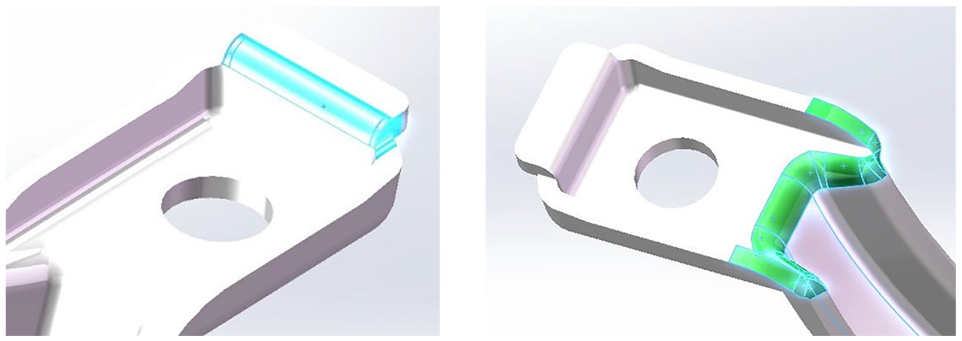
Thinnest positions in the clamp: tab round area (left) and transition area (right).
Zoning strategy
To study the influence of the variable friction coefficient of the forming dies on the thickness of the V-shaped clamp, the die surface is divided as shown in Figure 7 into the following seven areas according to the partition principle from the study 13 by Hetzner et al.: Zone A: bottom area of the V-groove on the upper die; Zone B: rounded area of the V-groove on the upper die; Zone C: head area of the upper die; Zone D: rounded area of the V-groove on the lower die; Zone E: two sides on the lower die; Zone F: head area of the lower die; and Zone G: die head blanking area. The other areas are considered unimportant areas that have a very limited impact on the forming process. The single factor rotation method is used in the simulations. Five levels of the friction coefficient are selected for each factor (region): 0.08, 0.12, 0.16, 0.20 and 0.24. When the friction coefficients of the regions under study are changed, the friction coefficients of the remaining regions remain constant at a value of 0.16.

Mold surface division diagram.
Analysis of simulation results
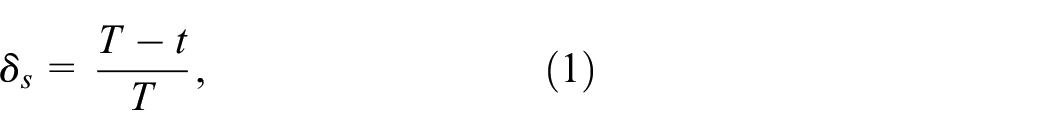
The main evaluation criteria used here are: (1) the thinning rate of the tab round area and the transition area, which must be increased after tooling optimization; and (2) the distance between the minimum plate thickness position at the edge of the transition zone and the head of the clamp, which is used to evaluate the material flow. The definition of the thinning rate is:
where
Impact of variable friction coefficient on the tab round area
Figure 8 shows the change in the thinning rate of the tab round area with variation in the variable friction coefficient and Figure 9 presents a graph that shows the change in the distance from the position of the smallest plate thickness in the fillet area to the head of the sheet versus the change in friction coefficient. The thinning rate decreases as the friction coefficient increases in zone B and the damping in zone C exceeds 3%. The position of the thinning plate is getting closer to the head position, which means that the increased friction in zone B and zone C is helpful for the material flow in the clamp forming process. When the friction in zone F and zone G increases, the thinning rate increases in tandem. The position of the thinning plate is then getting farther away from the head position, which shows that the increasing friction has a negative effect on the material flow. There are no significant differences in the thinning rate or the material flow when the friction in the other zones continues to increase. Therefore, when the thinning rate is considered, zones B, C, F, and G are the main zones influencing the thinning rate and the degree of influence of these zones is F > B > G > C.

Thinning rate of material thickness in the tab round area.

Position of the element with the smallest thickness in the tab round area.
Impact of variable friction coefficient on transition area
Figure 10 shows the relationship between the edge thinning rate in the transition area and the friction coefficient of the tooling, and Figure 11 shows the relationship between the minimum thickness position and the friction coefficient.

Thickness reduction ratio at the edge of the transitional area.

Position of the minimum thickness element at the edge of the transitional area.
The thinning rates of zone A and zone B both decrease when the friction coefficient increases, but the material fluidity and the minimum plate thickness both increase. The thinning rates in zone F and zone G both increase with increases in the friction coefficient and the thinnest point is located farther away from the head, which indicates that increases in the friction coefficient in zone F and zone G inhibit the fluidity of the material. Variations in the friction coefficient in the other zones have limited effects on both the thinning rate and the material flow. Therefore, the main influencing zones can be considered to be zones A, B, F and G and the degree of influence among these zones is B = F > A > G.
According to the preliminary analysis, promotion of the radial flow of the material has a significant effect on increasing the filling rate of the cavity in the mold, thereby reducing both the thinning rates of the easy-to-crack parts and the risk of ripping the material. During the forming process, zone A makes contact with the sheet metal first and corresponds to the bottom of the V-groove, where the raw material is pulled by the upper die in both the axial and radial directions. Zone B makes contact with the metal sheet near the corner of the V-groove. Increasing the friction coefficient in zone A and zone B has a positive effect on the material flow in the radial direction within the experimental friction coefficient range (0.08, 0.12, 0.16, 0.20, 0.24) and restrains the material outflow in the axial direction, thus ensuring that the thinning rate is well controlled. There is relative slip between the raw material and zone C on the upper die and thus an increase in the friction coefficient in zone C can inhibit the material outflow and also increase the minimum thickness of the transition area. When the sheet metal is pressed into the V-shaped clamp body, it slides through zone F, and when the friction coefficient of zone F is reduced, the material flows more easily into the V-shaped clamp body. A metal sheet in zone G is subject to tensile stress in the radial direction and compressive stress in the axial direction; therefore, reducing the friction coefficient in this region can allow the sheet to flow more easily and the sheet thickness is then more uniform after forming. The analysis results are consistent with the simulation results above.
Optimization of surface friction characteristics of V-clamp die
Orthogonal optimization scheme
With the aim of reducing the thinning rate of the V-shaped clamp and adopting the uniformity of the formed sheet as the optimization target, further FEA simulations are conducted. According to the simulation results and analysis presented above, larger friction coefficients in zones A, B and C and smaller friction coefficients in zones F and G contribute to the material flow and to uniform thickness for the V-shaped clamp. Therefore, five regional factors (denoted by μA, μB, μC, μF and μG) and ten levels for each factor are defined to perform further orthogonal optimization analyses. The friction coefficient range for zones A, B and C is defined as 0.16 to 0.34 with a step size of 0.02. In zones F and G, the friction coefficient range is defined as 0.07 to 0.16 with a step size of 0.01 and the friction coefficient in zone E is set at 0.20. The friction coefficients in the other zones remain constant at 0.16 during the simulation process.
Based on the elements described above, the uniform design table U10*(108) is selected, as shown in Table 3. This table covers eight factors and each of these factors has ten levels. Under the guidance of the usage table (shown as Table 4), columns 1, 3, 4, 5 and 7 of Table 3 are selected. The uniform design deviation D is 0.2414. The simulation factors are confirmed and are presented in Table 5.
Uniform design table U10*(108).

Use table for uniform design table U10*(108).

Simulation factors for the test.

Determination of the optimal plan
The coefficients of friction of the different zones are redefined in Abaqus based on the results in Table 5 and then ten groups of simulations are calculated. The simulation results are presented in Table 6.
Simulation results.

The results in Table 6 indicate that group 8 shows the best simulation result for the maximum thickness reduction; i.e., under the conditions where μA=0.30, μB=0.18, μC=0.34, μF=0.13, μG=0.12, μE=0.20 and a factor of 0.16 is used for the other zones, the plate thickness is more uniform. In this simulation group, the friction coefficients in zone A and zone C are taken as the extremes in the test range, which increases the influence of these two zones on the material fluidity. The friction coefficients in zone B and zone F are slightly larger or smaller than their initial values. The values of the friction coefficients in each zone balance out the influence of each zone on the material fluidity and avoid interactions among the friction coefficients in each zone; this makes the stress distribution more uniform, thus ensuring that the material flow is more uniform in the forming process and that the maximum thinning rate of the forming part is reduced. Therefore, the combination above represents the optimal combination of friction coefficients on the surface of the die.
In addition, in the third group, the thinning rate of the tab round area is the lowest and the thinning rate for the transition area is the highest. This occurs because the friction coefficients in zone B and zone F have a greater influence on the thinning of the tab round area, whereas the higher friction coefficient in zone B and the lower friction coefficient in zone F promote material flow into the V-shaped concave cavity. In addition, the higher friction coefficient in zone A and the lower friction coefficient in zone G increase the radial displacement of the material, thus causing the thinning rate of the tab round area to be reduced significantly. However, the friction coefficient in zone B in this optimization scheme is too high, which causes the material to flow into the concave cavity of the arc area, whereas the material in the bottom area of the V-shaped groove hardly flows out at all. This brings a two-way tensile stress into the material in the transition area, which results in noticeable thinning of this area.
Comparative analysis of molding parameters before and after optimization
According to the simulation results, the most important parts for the V-shaped clamp forming process are the tab round area and the transition zone. Therefore, the forming parameters for these two regions are compared before and after optimization. As shown in Figure 12, two paths are defined. Path 1 starts with the sheet metal head nodes and runs through the tab round area, whereas path 2 passes through the edge of the transition zone. These two paths are suitably representative for use in the study of the influence of the molding parameters of the key parts noted above.

Path settings for the comparative analysis,
Comparison of material flows before and after optimization
To analyze the fluidity of the materials, points are selected in both the tab round area and the transition area and time curves are then drawn for these two points during the forming process, as shown in Figure 13. In the first 1.4 s of the forming process, the tail of the metal sheet is pressed into the lower die and the material of the head is not displaced. Subsequently, at 2.4 s, the material displacement of the tab round area and that of the transition area increase linearly with the time flow. This is a bulging and drawing period. After 2.4 s, the material flow speed slows and the main forming process is drawing. The optimized material flow curve is smoother, which indicates that the material flow velocity and the forming process are more stable, thus reducing the risks of cracking and wrinkling. Because the friction coefficient value in each zone tends to have the same effect on the material fluidity, the material flow velocity tends to be identical in each deformation stage and the friction coefficient distribution promotes the material’s radial flow.

Material flow displacement diagram for the key parts.
Comparison of stress and strain before and after optimization
The von Mises stress distributions before and after optimization and the equivalent plastic strain distribution along the defined path are shown in Figures 14 and 15, respectively. Figure 14 shows that the V-shaped clamp is subject to tensile stress during the forming process and the von Mises stress in the tab round area and the transition area is significantly reduced after optimization; in addition, the stress distribution is also more uniform. This is because the change in the friction coefficient changes the constraint conditions for the sheet during the forming process. Figure 15 shows that the equivalent plastic strain of the von Mises stress concentration portion is high, i.e. the amount of deformation of the sheet material in the fillet of the boss and in the transition area is large, but the amount of this deformation is greatly reduced after optimization. The equivalent plastic strains before and after optimization of the fillet area of the convex plate are 0.459 and 0.344, respectively, representing a reduction of 25.05%. In addition, the equivalent plastic strains before and after optimization of the transition area are 0.709 and 0.458, respectively, representing a reduction of 35.40%. The equivalent plastic strains of the transition zone edge are 0.485 and 0.403 before and after optimization, respectively, representing a reduction of 16.91%.

Von Mises stress distributions,

Strain distribution along the defined path.
Comparison of thinning rates before and after optimization
The thickness distributions along the defined paths before and after optimization are shown in Figure 16. The figure shows that the minimum thicknesses of the tab round area are 1.68 mm and 1.80 mm and the thinning rates are 16% and 10% before and after optimization, respectively. In the transition area, the minimum thicknesses before and after optimization are 1.76 mm and 1.80 mm and the thinning rates are 12% and 10%, respectively. The analyses above indicate that the optimized combination of the regional friction coefficients not only promotes radial displacement of the sheet metal but also maintains a uniform material flow velocity, which improves both the filling rate of the lower die and the uniformity of the forming part. In addition, this optimized combination also disperses the surface stress of the sheet metal, reduces the strain in the key parts significantly and reduces the risks of cracking and wrinkling.

Thickness distributions along the path,
Optimization of surface friction characteristics of V-clamp die
Laser microtexturing on mold surface
Laser microtexturing can change the friction characteristics of the mold surface. Machining the shape of a laser micro-convex body onto the mold surface can increase the friction force and machining the shapes of laser micro-pits onto the mold surface can reduce the friction between workpieces. The required friction characteristics can thus be attained by varying the laser processing parameters.
According to the simulation results, the best tribological behavior distribution occurs on the mold surface when μA = 0.30, μB = 0.18, μC = 0.34, μF = 0.13, μG = 0.12 and μE = 0.20, with all remaining coefficients of friction within the micro-influence zone having a value of 0.16. Therefore, it is necessary to increase the friction of the bottom area (zone A) of the V-groove of the punch, the straight arm and the fillet area (zone C) of the convex boss of the punch and the inclined surface (zone E) of the V-groove of the die and also reduce the friction in the blank area (zone G). Because the required friction coefficients for the punch V-groove fillet area (zone B) and the die boss straight arm and fillet area (zone F) are close to their initial uncoated friction coefficients, they do not participate in the optimization process. The test results from the laser microtexturing friction coefficient measurements indicate that the laws between the friction coefficient, the area occupancy rate and the depth of the morphological depression are obtained, but no accurate quantitative rule exists between them. Therefore, based on the process test and morphology tribology test results, the laser composite texture on the surface of the V-clamp mold tends to match the optimized tribological characteristics distribution as far as possible.
(1) Laser microtexturing scheme for the bottom area of the V-shaped groove of the punch (zone A) and the straight arm of the punch boss and the fillet area (zone C)
With reference to the process test results, the following laser processing parameters are selected: the laser power is 50 W and the pulse width is 5000 µs with no air. The roughened point processed using these parameters is M-shaped, the diameter of the roughened point is 285 µm, the height of the protrusion is 3.646 µm and the depth of the depression is 3.546 µm. The area occupancy rate is 15%, i.e. the row and column spacing is 652 µm. The morphology and the cross-sectional view of the surface of the mold processed under these conditions are shown in Figure 17.
(2) Laser microtexturing scheme for V-groove bevel (zone E) of the concave die
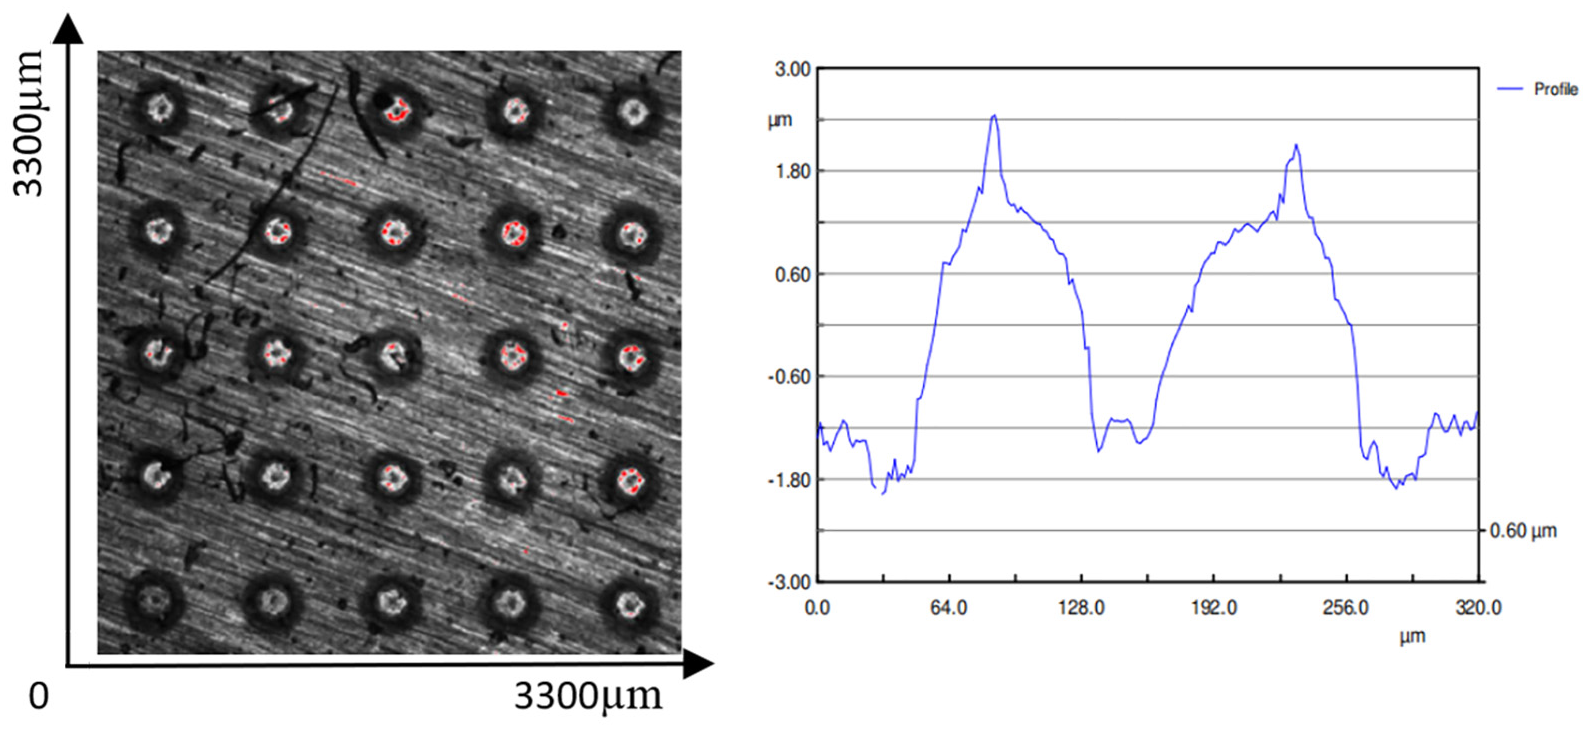
Morphology of the mold surface in zones A and C.
With reference to the process test results, the following laser processing parameters are selected: the laser power is 50 W, the pulse width is 5000 µs and no air is blown. The roughened point processed using these parameters is M-shaped, the diameter of the roughened point is 285 µm, the height of the protrusion is 3.646 µm, and the depth of the depression is 3.546 µm. The area occupancy is 5%, i.e., the row and column spacing is 1130 µm. The surface morphology and the cross-sectional view of the roughened point of the mold processed under these conditions are shown in Figure 18.
(3) Laser microtexturing scheme for the die blank blanking area (zone G)

Morphology of the mold surface in zone E.
With reference to the process test results, the following laser process parameters are selected: the laser power is 50 W and the pulse width is 5000 µs with no air. The roughened point processed using these parameters is M-shaped, the diameter of the roughened point is 285 µm, the height of the protrusion is 3.646 µm, and the depth of the depression is 3.546 µm. The area occupancy is 50%, i.e. the row and column spacing is 357 µm. The surface morphology and the cross-sectional view of the roughened point of the mold processed under these conditions are shown in Figure 19.

Morphology of the mold surface in zones F and G.
Laser microtexturing processing of the mold surface
In accordance with the planned laser composite texture scheme for the mold surface, laser microtexturing is performed on the surface of the V-clamp mold. The laser composite texture is processed on the V-clamp mold surface as shown in Figure 20.

Overall effect and partially enlarged view of the laser composite texture on the mold surface.
Results and analysis
Mass detection and contrastive analyses are performed on the formed parts of the untextured die and the composite laser textured die. In the impact forming process of the V-shaped clamp, the critical parts are the convex plate and the transition area. In this paper, tests are performed to measure the residual stress and the thickness of the critical parts and the thinning rate is used to decide the uniformity coefficient of each formed part’s thickness. The distribution of the residual stress test points is shown in Figure 21.
(1) Contrastive analysis of the impact of laser microtexturing on the residual stress of the molded part
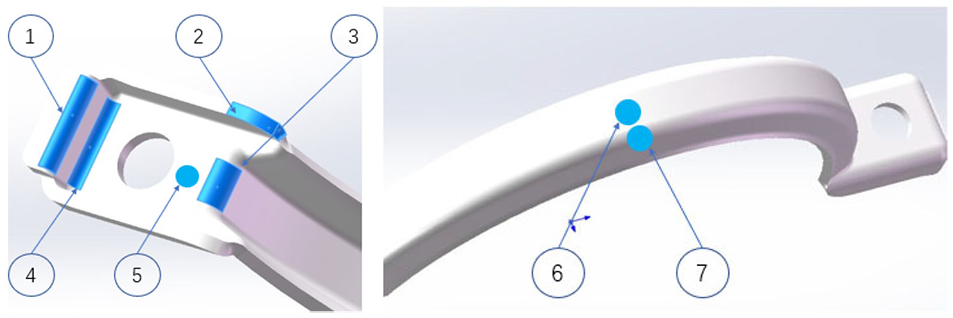
Distribution of the residual stress test points for the molded part.
The Xstress 3000 G2R X-ray stress tester (Stresstech Oy, Vaajakoski, Finland) is used to measure the residual stress on the V-shaped clamp surfaces for the two groups of stamping forming tests. The roll fixed ψ method, a cross-correlation legal peak, MnKα radiation and (311) crystal plane diffraction are adopted; the X-ray tube voltage is 30.0 kV, the current is 6.6 mA, the exposure time is 15 s and the values of the tilt angle ψ are taken to be 0.0°, 24.1°, 35.3° and 45.0°; the angles of detectors A and B are both 152.3° (2θ = 152.3°) and the diameter of the collimator Φ is 2 mm. The distribution of the residual stress test points is shown in Figure 21. Because the V-shaped clamp is subject to complex forces and both tensile and compressive stresses simultaneously, the stress at each point is measured in two directions: the radial (0°) and axial (90°) directions. Table 7 and Table 8 show the residual stress distributions at the surface test points of the stamping before and after the laser composite texturing process, respectively.
Distributions of residual stresses on the surface test points of the untextured V-shaped clamp molded part.

Distributions of residual stresses on the surface test points of the laser composite texture V-shaped clamp molded part.
The results of the residual stress tests presented in Tables 7 and 8 combined with the distribution of the residual stress test points indicate that on the surface of the V-shaped clamp molded part and on the edge of the transition zone that connects the convex plate to the arc surface, both the radial direction (0°) and the axis (90°) are subject to tensile stress; however, the value of the radial (0°) tensile stress in the fillet area of the head convex plate is small. The rest of the test area is subject to compressive stress. These test results are consistent with the results of the numerical simulation, thus verifying its correctness. Comparison of Table 7 and Table 8 shows that when compared with the untextured conventional mold, use of the V-clamp mold processed by laser composite texturing can reduce the residual stress significantly in each area of the formed part. In this case, the texture disperses the surface residual stress of the molded part, causes the stress on the molded part to be uniform, and reduces the number of molding defects in the molded part.
(2) Comparative analysis of the effect of laser microtexturing on the thickness of the formed part
The thicknesses of the molded test parts are mainly measured using a spiral micrometer and a vernier caliper. During data processing, the average of the three measurements is taken to be the final thickness measurement result. The distribution of the thickness measurement points is shown in Figure 22.

Distribution of the thickness measurement points on the molded part.
The thickness distributions and the thinning rates of the V-shaped clamps obtained from the two sets of stamping tests at the measurement points are shown in Table 9 and Table 10.
Thickness distribution over the measurement points and corresponding thinning rates for the untextured V-shaped clamp molded part.

Thickness distribution over the measurement points and corresponding thinning rates for the laser composite texture V-shaped clamp molded part.
Comparison of the thicknesses and thinning rates at the measurement points for the two sets of V-shaped clamp forming parts in Table 9 and Table 10 shows that, in contrast to the untextured conventional mold, the damping of the thinning rate at measurement point I of the laser composite texture molded part is 5.3%, the reduction rate at measurement point II is 5.65%, the reduction rate at measurement point III is 0.75% and the reduction rate at measurement point IV is 2.9%. These results are consistent with the simulation results. When compared with the untextured mold, the thinning rates of the molded parts obtained by stamping using the laser composite texture mold are reduced significantly. Therefore, laser microtexturing of the mold surface can reduce the thinning rate significantly, improve the thickness uniformity of the molded part and reduce the risks of cracking and wrinkling of the molded part by changing the surface friction and lubrication.
Conclusion
Using Abaqus finite element simulation software, this paper simulates the stamping process of V-shaped clamps numerically to reveal the influence of the friction coefficient of the mold area on the stamping parameters of V-shaped clamps and determine the main impact area. In addition, the surface friction coefficient of the V-shaped clamp mold is optimized based on partitioning of the impact area. Using the optimized friction coefficients as a basis, the laser microtexturing design method is used to process the surface area of the mold and the V-shaped clamp is then punched. The performances of the V-shaped clamp before and after microtexturing were compared and the results are as follows:
Abaqus was applied to the stamping process for V-shaped clamps to divide the mold area and analyze the effects of the different regional friction coefficients acting between the mold and the blank on the parameters of the V-shaped clamp stamping process. The results show that the friction properties of the mold surface have significant regional characteristics.
Optimization of the friction coefficient values of the V-clamp mold surface area causes the material flow curve to be smoother and the forming process to be more stable during V-clamp stamping. The risks of cracking and wrinkling of the molded part are thus minimized in this case. The optimization of the friction coefficient causes its degree of influence on the material fluidity to tend to be consistent, which means that the material flow velocity tends to be consistent during each deformation stage; the distribution of the friction coefficient also promotes radial flow of the material, which makes the stress distribution more uniform.
Based on the optimized friction coefficient values, the laser microtexturing active design method is used to process the mold surface area and the V-shaped clamp is then punched. The experiment compares the residual stresses and thinning rates of the V-shaped clamp surface before and after microtexturing. The microtexturing process causes a remarkable reduction in the residual tensile stress of the molded part, disperses the stress on the molded part’s surface and reduces both the maximum thinning rate of the molded part and the strain in the key areas.
The optimized results obtained from Abaqus tend to be consistent with the results of the actual tests, thus verifying the correctness of the finite element simulations.
Footnotes
Handling editor: James Baldwin
Declaration of conflicting interests
The author(s) declared no potential conflicts of interest with respect to the research, authorship, and/or publication of this article.
Funding
The author(s) disclosed receipt of the following financial support for the research, authorship, and/or publication of this article: Project funding: National Natural Science Foundation of China (51375211; 61273151)