
Abstract
In this paper, series of full-scale cutting tests and cutting simulations are carried out to investigate the influence of installation parameter and geometry of the pick on cutting performance. The discrete element method is used to simulate the rock cutting process. A general process to calibrate macro properties of rock including uniaxial compressive strength (UCS), elastic modulus, Poisson’s ratio, cohesion and internal friction angle is proposed and used to complete the calibration of coal model. The cutting simulations are performed using picks with different tip angles and rake angles. The results show that the peak cutting force (PCF) decreases with the increase of rake angle following an inverse proportional function when the rake angle is positive, while it varies following a parabolic curve in the condition of negative rake angle. Moreover, the crack mode changes from primarily shear failure to primarily tensile failure with the increase of rake angle. Finally, a multiple-attribute index is proposed to evaluate the cutting performance and select the optimum cutting parameters.
Introduction
In order to meet the society increasing requirement for energy and improve the economic profit of coal mining enterprises, it’s necessary to optimize the cutting head of shearer, continual miner, excavator, and so on. Further knowledge about the stress state between pick and rock and crack propagation is essential to determine the optimum cutting parameters. Many researchers have done much work to study the rock cutting mechanics based on theory, laboratory experiment and numerical simulation. Due to the complexity of the rock cutting process, there are many drawbacks which limit the accuracy and usage of theoretical cutting models at present, for example, most theoretical cutting models1–3 are built based on static analysis while it’s a dynamic process during rock cutting. Experimentation and numerical simulation are widely used to study the dynamic rock cutting process.
In terms of experiment, much work has been done about influence factors on cutting performance. Bilgin et al. 4 investigated the effect of rock properties on cutting performance by full-scale cutting experiments, and found that uniaxial compression strength was best correlated with specific energy. Dewangan and Chattopadhyaya 5 found the optimum tilt angles of investigated two picks were 27° and 17° by linear cutting tests using the combined multiple attribute decision-making method. Liu et al. 6 studied the effect of pick geometry parameters, that is, conicity and carbide-tip diameter, on the cutting performance of a drum, and the results suggested that the torque of the drum increased with carbide-tip diameter and decreased with conicity of the pick. Kim et al. 7 investigated the influence of cutting depth, cutting space and skew angle of the pick on the cutting force and pick rotation, and found none of the cutting parameters had significant effect on pick rotation. Ouyang et al. 8 investigated the influence of rake angle of chisel picks in the range of −40° to 50° by linear cutting tests. The experimental results showed that the mean cutting force decreased with the increase of rake angle, and the proportion of large chips increased with rake angle. Hekimoglu 9 conducted linear cutting experiments with a wide range of tilt angles to investigate the influence of tilt angle on cutting performance on a roadheader cutting head. The results showed that the optimum tilt angle for corner cutting picks was approximately equal to the half of breakout angle of rock, and the corner cutting picks acted as gage tools after this value.
Through experimentation is a more direct method, it is expensive and time consuming. Besides, it’s hard to investigate the crack propagation and the stress state during cutting in experiments. On contrary, the details in the whole cutting process are visible in numerical simulation, which is meaningful for the further understanding of rock cutting mechanics. Numerical simulation is reliable and convenient to conduct the rock cutting tests of single variable for parameter optimization. Much work has been done on rock cutting process using numerical simulation based on Finite Element Method (FEM), Boundary Element Method (BEM), Discrete Element Method (DEM), and so on. Menezes et al. 10 built the rock cutting model with a chisel pick using FEM, and the formation process of fragment was simulated with different cutting velocity and cutting depth. Samui et al. 11 conducted a series of numerical simulations using FEM to determine the optimum tool in rock cutting, and investigated the effects of attack angle, cutting depth, cutting velocity and friction between tool and rock on cutting force and crack propagation. The results showed that the cutting condition with triangular pick, installation angle of 45° and cutting velocity of 5–7 m/s was optimum. However, the tip angle of the pick used in their simulation was 15° which was impractical in the actual cutting condition with intense attacks. Huang et al. 12 used the DEM code, Particle Flow Code in two dimensions (PFC2D) to investigate the fracture mode in rock cutting and found that the rock crack in brittle or ductile mode was determined by cutting depth. Lei and Kaitkay 13 investigated the effect of hydraulic pressure on rock cutting process using PFC2D. The hydraulic pressure restrained the crack propagation and induced the increase of cutting force. Su and Akcin 14 and Rojek et al. 15 performed the rock cutting simulation using PFC in three dimensions (PFC3D) and verified the reliability of the model by experimental and theoretical results. Zhu et al. 16 investigated the influences of cutting depth, hydrostatic pressure, cutting velocity, back rake angle and joint set on failure mechanism in rock-cutting by PFC2D. The simulation results showed that the crack initiated and propagated parallel to the free surface with a smaller rake angle while it changed to toward the intact rock with larger rake angle. Liu et al. 17 studied the transition of ductile to brittle failure mode during rock cutting and the influence of cutting parameters on critical cutting depth using PFC2D. The results showed that with the increase of cutting depth, the failure mode of rock translated from ductile to brittle, and the hydraulic pressure, larger cutting velocity and rake angle resulted in larger critical cutting depth and specific energy. Zhang et al. 18 investigated the influence of operating parameters and geometry of conical pick on cutting performance by PFC3D. The simulations showed that the number of cracks and cutting force decreased with negative rake angle and increased with positive rake angel. Though the results in the available literatures are meaningful for the understanding of cutting mechanics, the effect of rake angle on failure mechanism and specific energy is not clear.
In the present work, series of full-scale cutting tests were conducted to investigate the influence of rake angle of the pick on cutting performance. Furthermore, PFC2D was used in modeling rock cutting process to obtain the optimum parameters of pick geometry and installation. A general calibration process of rock macro properties in PFC2D was proposed and a type of coal model was built. The rock cutting simulations were performed using picks with different tip angles and different rake angles. The cutting forces, crack propagation and stress state between the pick and coal were recorded and analyzed. Finally, a multiple-attribute index was used to evaluate the cutting performance and select the optimum cutting parameters.
Full-scale rock cutting tests
The full-scale cutting rig used in the experiments is presented in Figure 1. The rig was designed and manufactured by Collaborative Innovation Center of Intelligent Mining Equipment of China University of Mining and Technology. It can accommodate rock samples up to 1 × 0.5 × 0.5 m3 in length, width and height. The cutting rig is composed with measuring and controlling system, mechanical system and hydraulic system. The mechanical system is designed to adjust the cutting depth and cutting space. A force sensor is equipped to record cutting forces up to 500 kN in three dimensions. The cutting motion is provided by a hydraulic cylinder. The cutting speed is controlled by a servo proportional valve in the hydraulic system. The rock fixture is designed to simulate the confining pressure up to 32 MPa.
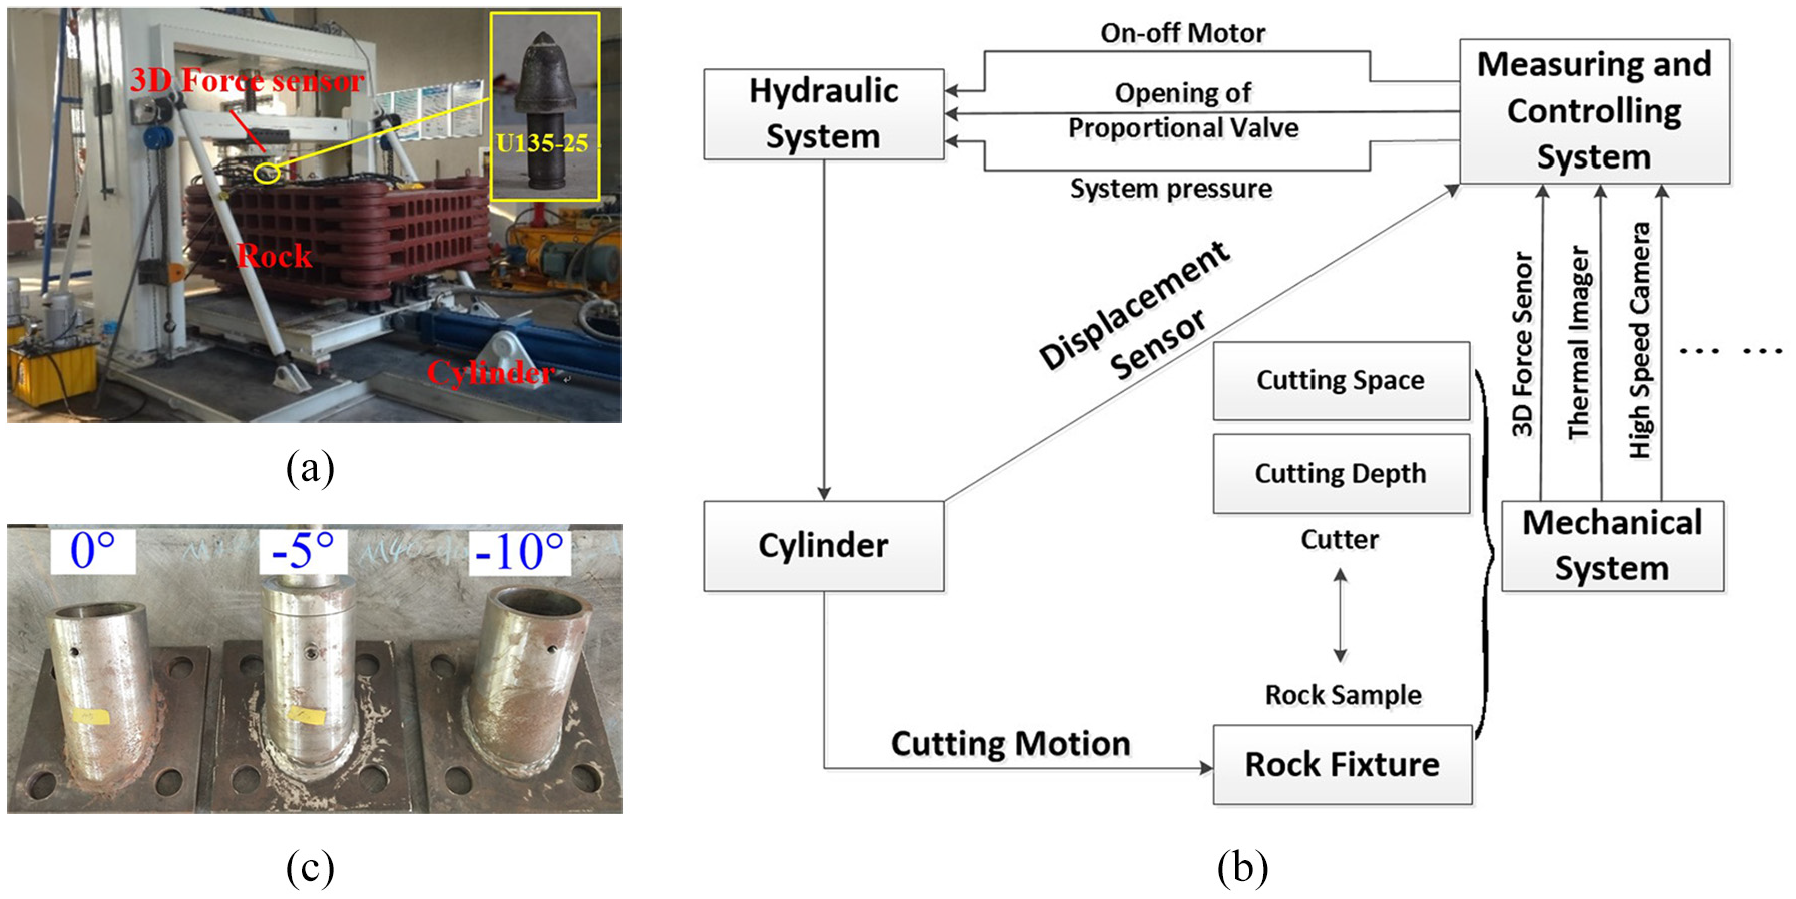
The photograph (a) and schematic (b) of the full-scale rock cutting rig, and (c) pick holders with different rake angles.
The cutting tests were carried out with a conical pick (U135-25) manufactured by Shandong Sanqiang Mining Machinery Co., Ltd. with a tip angle of 90°. The rock sample used in the cutting test is an artificial rock sample made by pulverized coal, cement and sand with weight ratio of 1:1:1 shown in Figure 2. The properties of the rock sample are density of 1390 kg/m3, uniaxial compressive strength of 13.3 ± 1.6 MPa, tensile strength of 1.12 ± 0.6 MPa, Young’s modulus of 12.1 ± 1.6 GPa and Poisson’s ratio of 0.23 ± 0.04. The constant variables through the experiments are cutting speed of 50 mm/s and skew and tilt angles of 0°. The data sampling rate is 2000 Hz. The cutting depths set in the experiment are 5, 10 and 15 mm. Figure 1(c) shows the pick holders with different rack angle of −10°, −5° and 0°. Each cutting test was repeated at least three times. The 3D forces of the cutter were recorded and the cutting chips were collected in each cutting test. The coarseness index (CI) and specific energy (SE) are used to evaluate the chip size distribution and cutting efficiency, respectively. CI is defined as the sum of cumulative weight percentages retained in each sieve. 19 SE is defined as the work consumed for cutting a unit of volume 20 calculated by equation (1).

where, FC′ is the mean cutting force; L is the cutting length; m is the weight of chips; ρ is the density of the rock.

Artificial rock sample used in the experiment.
The relationships between cutting and normal forces and attack angle with different cutting depths are shown in Figure 3. It shows that the cutting and normal forces decrease with the increase of rake angle. When the rake angle is negative, the cutter compresses the rock to crush with high forces in shear fracture mode. With the increase of rake angle, the rock fracture mode transports from primarily shear to primarily tensile due to the cutter wedging into the rock with lower forces.

Relationships between cutting force (a), normal force (b) and rake angle.
In order to investigate the influence of rake angle on cutting efficiency and grain size, the analysis of grain size distribution was conducted with the cutting condition of cutting depth of 10 mm and different rake angles shown in Figure 4. The SE and CI were calculated and drawn in Figure 5. Figure 5 shows that CI increases with the increase of rake angle while SE decreasing. It indicates that when the rake angle is negative, the cutter compressed the rock to crush resulting in shear fracture, larger proportion of tiny chips and high consumption of energy. Therefore, while guaranteeing the strength of pick, the rake angle should be maximized to reduce the cutting forces and improve the cutting efficiency.

Grain size distributions in the condition of different rake angles.

Relationships between coarseness index, specific energy and rake angle.
Numerical simulation
The results of experiments above indicate that the rake angle has great influence on cutting force, cutting efficiency and grain size distribution. However, due to the difficulty in conducting cutting tests, more influence of rake angle and tip angle of the pick on cutting process was studied by simulation with discrete element method.
Calibration of coal model
In this paper, the parallel-bond contact model was used to model coal samples in PFC2D. The calibration of rock model in PFC2D is a process of trial and error. Through many researchers investigated the relationship between micro and macro properties of DEM rock model,21–23 no certain or exact relationships between micro and macro properties were published. Lei and Kaitkay 13 proposed a general process to calibrate rock samples in PFC2D. Referring to the literature, many researchers calibrated the micro-properties by matching the uniaxial compressive strength (UCS), elastic modulus (E) and Poisson’s ratio of the rock. However, there are other micro properties of parallel-bond except the ones mentioned by Lei and Kaitkay 13 affecting these macro properties. Consequently, there are many combinations of different micro-properties to obtain the same macro-properties. In order to obtain a more real coal model, the cohesion and internal friction angle of the coal were matched additionally by conducting series of biaxial compressive tests. The cohesion and internal friction angle are obtained based on Mohr-Coulomb intensity criterion by triaxial tests in laboratory and biaxial tests in PFC2D. The equation of Mohr-Coulomb intensity criterion expressed by principal stresses is equation (2). 24

where σ1 and σ3 are the maximum and minimum principal stresses, respectively, c is the cohesion, φ is the internal friction angle. The cohesion and internal friction angle are obtained from the linear relationship between confined compressive strengths and the corresponding confining pressures.
The calibration process is a repetitive and time-consuming process using trial-and-error method. Fortunately, some rules were found in the calibration process. Firstly, as reported in literatures,13,21 UCS, E and Poisson’s ratio of the rock are mainly determined by parallel-bond tensile/shear strength, parallel-bond modulus and parallel-bond stiffness ratio. Secondly, the parallel-bond friction angle and the standard deviation of parallel-bond strength have great influence on UCS of rock model. Besides, the parallel-bond friction angle and the parallel-bond tensile/shear strength ratio have great influence on the cohesion and internal friction angle. The general process to calibration macro properties of rock models is given in Figure 6.

Process of rock model calibration.
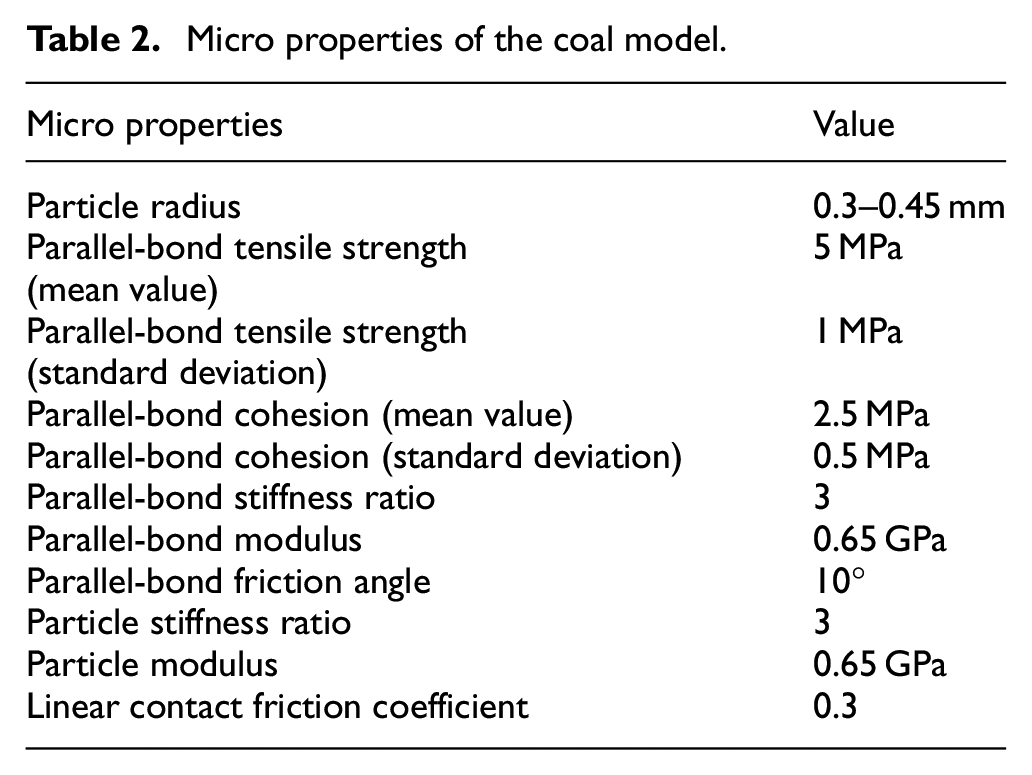
The macro properties of the coal obtained from experiments 25 and simulations are listed in Table 1. The ratio of UCS to BTS obtained from simulation is about 3.89 which is less than that measured in laboratory tests due to the defect of parallel-bond contact model. 26 The tensile strength will be over predicted when the rock model is calibrated to UCS. The corresponding micro properties of the coal model are summarized in Table 2. Figure 7 shows the crack patterns of the coal model under different confining pressures. In the uniaxial compressive test, there are many tensile cracks along the axial of the coal model except a main shear crack through the coal model. In the confined conditions, the shearing slip fracture mode is more obvious with the increase of confining pressure. Under low confining pressures (2, 4, 8 MPa), there is a main shearing slip crack through the coal model with some small fractures distributing in the model. Under high confining pressures (12, 16 MPa), the main shearing slip crack is rhombus accompany with many small fractures spreading all over the coal model. Figure 8 shows the relationships between deviatoric stress, crack number and axial strain under the confining pressures of 2 and 16 MPa. According to the stress-strain curve, the damage process of the coal model in biaxial test was divided into four stages, that is, elastic stage, plastic stage, damage stage and residue stage. The stress-strain curve in the elastic stage is almost linear. In this stage the coal model is compacted with few fractures. In the plastic stage, the slope of the stress-strain curve decreases and the increment rate of crack number increases with the increase of axial strain. The damage stage occurs after the peak stress. The deviatoric stress decreases rapidly while the crack number increases dramatically. Subsequently, the deviatoric stress is almost a constant with few fractures in the residue stage. Figure 9 shows the deviatoric stress-strain curves under different confining pressures. The compressive strength of the coal model as well as the corresponding radial strain and axial strain increases with the increase of confining pressure. Figure 10 shows the relationship between the compressive strength and confining pressure. The linear relationship between compressive strength and confining pressure is obtained by regression analysis. Then, the cohesion and internal friction angle are calculated by equation (2).
Macro properties of the coal.

Micro properties of the coal model.

Crack patterns of coal model in uniaxial and biaxial compressive tests: (a)-(f) represent the confining pressure of 0MPa, 2MPa, 4MPa, 8MPa, 12MPa and 16MPa, respectively. Red and green segments represent micro tensile and shear fractures, respectively.

Relationships between deviatoric stress, crack number and axial strain under different confining pressure of: (a) 2MPa and (b) 16MPa.

The deviatoric stress-strain curves under different confining pressures.
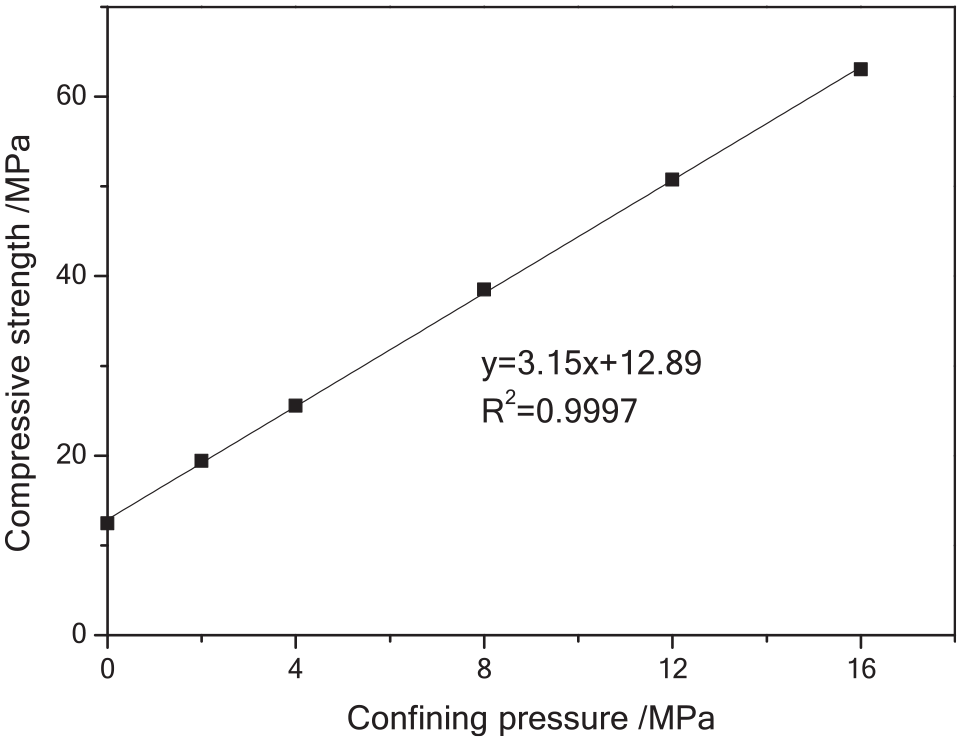
The relationship between compressive strength and confining pressure of the coal model.
Rock cutting model
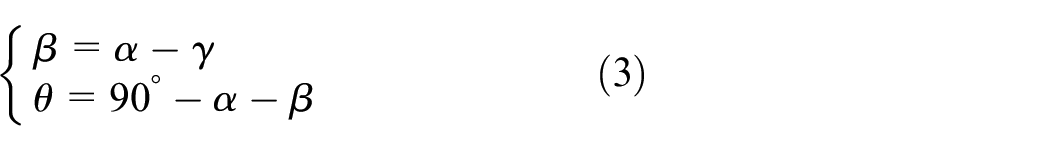
The rock cutting model is built shown in Figure 11 using the micro parameters mentioned above. The dimensions of the coal sample are 0.2 m in length and 0.08 m in height which are much larger than the cutting depth of 5 mm. The radii of the particles are the same as those used in the calibration process of the coal model, that is, 0.3–0.45 mm. There are approximately 0.32 million particles in this coal sample. Picks with different tip angles were built and imported into PFC2D as a rigid wall with different rake angles. The schematic of rock cutting is shown in Figure 12. The symbols of α, β, γ and θ are semi-tip angle, installation angle, rake angle and clearance angle, respectively. The relationships between the four angles are shown in equation (3). In the condition of negative clearance angle shown in Figure 12(b), the interference of pick body and rock would result in severe wear of the pick and the increase of dust, SE and cutting force. Consequently, installation angle and tip angle of picks should admit the criterion of equation (4).


Rock cutting model built by PFC2D.

Schematic of rock cutting with a conical pick in different conditions of: (a) positive and (b) negative clearance angle.
The tip angles of picks and the corresponding installation angles, rake angles, clearance angles are listed in Table 3. The cutting depth of 5 mm and cutting velocity of 1 m/s are used. The cutting simulations are repeated three times on the coal samples built by different random seeds in the particle assemble generating process.
Parameters of rock cutting simulations (°).

The cutting forces, the micro-fracture number, chip formation and stress state during the cutting process were recorded. In order to investigate the cutting efficiency under different cutting conditions, the curve of the cut surface was extracted as shown in Figure 13 using FISH (an embedded programming language in PFC2D). The accurate fragment volume shown in Figure 13 is calculated by integral operation. Subsequently, the specific energy (SE) and production rate (PR) were calculated. In this section, SE is calculated by equation (5).

where, FC is cutting force, V is the total volume of coal fragments. PR is defined as the volume cut in a unit displacement calculated as equation (6).

where, l is the cutting distance.

The surface of coal sample after cutting.
Besides, the fluctuation index (FI) 27 was calculated by equation (7) to evaluate the fluctuation intensity of cutting force. The cutting force fluctuates more acutely with larger FI value.

where
Pulse number (PN) 27 is defined as the number of peaks in the cutting force-displacement curve in a unite displacement calculated by equation (8). Since the fluctuation of cutting force is induced by the formation of coal fragments, a smaller PN suggests that more large chips are formed.

where m is the total number of peaks larger than
Results and discussions of simulation
A series of cutting simulations were conducted to investigate the effect of tip angle and rake angle of the pick on cutting performance. Figure 14 shows the crack patterns cut by picks with different tip angles and rake angles. These figures show that the cut surface is coarse and much coal beneath the pick tip is cut. It is benefit for improving production rate and the subsequent cutting process. Besides, the cut surfaces are smoother when the rake angle is negative or large enough, for example, the conditions of 2α = 80°, γ = –5° and 2α = 60°, γ = 25°. Consequently, there should be an optimum installation parameter for different picks.

Crack patterns cut by picks with different tip angles and rake angles: (a) 60°, (b) 70°, (c) 80° and, (d) 90° of tip angles.
Figure 15 shows the relationships between peak cutting force (PCF) and rake angle, clearance angle. It shows that the correlation between PCF and rake angle is better than that between PCF and clearance angle. Besides, PCF is rarely affected by tip angle. Namely, PCF is mainly determined by rake angle. The rake angle is regarded as the variable of installation of the pick in the following analysis. For picks with positive rake angles, PCF decreases with the increase of rake angle following inverse proportional function. When the rake angle is negative, PCF varies with the increase of rake angle following a parabolic curve. PCF is the largest when the rake angle is zero for picks with different tip angles. Figure 16 shows the force chain graph of the coal sample and crack propagation during cutting with different rake angles. As shown in Figure 16(a), the rake angle is positive, that is, γ = 15°. Firstly, a stress concentration zone was formed at the pick tip. The crack originated from the stress concentration zone approximately along the axial of the pick and then propagated to the free surface. The fragment was formed like a simply supported beam. Consequently, it’s primarily tensile failure mode in the condition of positive rake angle, which is the reason for the decrease of PCF with the increase of rake angle. In the condition of the rake angle is zero shown in Figure 16(b), the crack propagated from the pick tip horizontally and then to the free surface. The coal ahead of the pick was squeezed and separated from the sample. Larger cutting force was needed for crack initiation and propagation in this cutting condition. When the rake angle is negative shown in Figure 16(c) (i.e. γ = –10°), the macro crack originated at the pick tip and propagated to the free surface along an arc similar to the condition of positive rake angle. Subsequently, the coal ahead of the pick in the range of cutting depth was squeezed and secondary crushed forming tiny fragments. The crack mode in the condition of negative rake angle is primarily shear failure accompany with tensile failure. Dust and SE will increase due to the tiny fragment formation in these cutting conditions.

Relationships between peak cutting force and (a) rake angle, (b) clearance angle.

Force chain graphs and crack propagation during cutting under different conditions of (a) 2α = 60°, γ = 15°, (b) 2α = 70°, γ = 0° and, (c) 2α = 90°, γ = -10°.
Figure 17 shows the relationships between FI, PN of cutting force and rake angle. As shown in Figure 17(a), a linear relationship between FI and rake angle is obtained with high correlation coefficient of 0.942. FI increases linearly with the increase of rake angle for picks with different tip angles. A quadratic function relationship between PN and rake angle is found with the correlation coefficient of 0.9311 shown in Figure 17(b). PN decreases with the increase of rake angle. Namely, the proportion of large chips increases with the increase of rake angle which induces the increase of the fluctuation intensity of cutting force. Figure 18(a) shows the relationships between SE and rake angle for picks with different tip angles. For picks with tip angles of 60°, 70° and 80°, SE decreases with the increase of rake angle, and it tends to be a constant when the rake angle is larger than 10°. Figure 18(b) shows the relationships between PR and rake angle. When the rake angle is positive, PR increases and then decreases with the increase of rake angle. However, the relationships between SE, PR and rake angle are not notable when rake angle is negative. SE is high in the condition of negative rake angle since much work is consumed in forming tiny fragments or secondary crush.

Relationships between rake angle and (a) FI, (b) PN of cutting force.

Relationships between rake angle and (a) SE, (b) PR.
In order to evaluate the comprehensive cutting performance in different cutting conditions, a multiple-attribute index was proposed as equation (9).

where, PR′, PN′, SE′ and FI′ are normalized data in the range [0, 1] based on min-max normalization method 28 shown as equation (10), K1, K2, K3 and K4 are weighting coefficients.

where, p is the data sequence, d is one of p, d′ is the normalized value in the range [0, 1] of d, min(p) and max(p) are the minimum and maximum values of the original data, respectively. The original and normalized results are summarized in Table 4.
Original and normalized results.

According to the production requirements, economy target and experiences of the mining enterprises, K1, K2, K3 and K4 are selected as 0.3, 0.3, 0.15 and 0.25, respectively. Namely, the production rate and proportion of large chips are the most important factors while specific energy and fluctuation index are less important factors. Figure 19 shows the relationships between rake angle and the multiple-attribute index. It suggests that the optimum cutting condition is the pick with tip angle of 60° and rake angle of 15° in this paper. Besides the optimum rake angle for picks with tip angle of 70° and 80° is 10°.

Relationships between rake angle and the multiple-attribute index.
Conclusion
In this paper, series of full-scale cutting tests and simulations were conducted to investigate the influence of installation parameter and geometry of the pick on cutting performance. Some conclusions are drawn as following:
Peak cutting force (PCF) is mainly determined by rake angle. For picks with positive rake angles, PCF decreases with the increase of rake angle following inverse proportional function. When the rake angle is negative, PCF varies with the increase of rake angle following a parabolic curve.
From the perspective of crack mode, it’s primarily tensile failure mode when the rake angle is positive resulting in lower peak force, greater proportion of large chips and lower energy consumption. Besides, it’s primarily shear failure when the rake angle is zero. In the condition of negative rake angle, the crack mode is primarily shear failure accompany with tensile failure.
Footnotes
Handling Editor: James Baldwin
Declaration of conflicting interests
The author declared no potential conflicts of interest with respect to the research, authorship, and/or publication of this article.
Funding
The author disclosed receipt of the following financial support for the research, authorship, and/or publication of this article: This research was supported by the National Basic Research Program of China (2014CB046301), the Talent Introduction Plan of Nanjing Normal University.