
Abstract
Short carbon-fiber-reinforced composites, especially short carbon-fiber-reinforced polyetheretherketone composites (CF-PEEK), are used extensively in the engineering field because of their superior properties. However, their surface quality and material removal rate need to be optimized to satisfy design and processing requirements. This work focused on a multi-objective optimization to minimize the surface roughness and maximize the material removal rate during machining by grey relational analysis with an analysis-of-variance (ANOVA) and response surface methodology before a multi-objective mathematical model was established. The statistical significance of the predicted model was examined by using an ANOVA to obtain the optimal machining parameters (spindle speed, feed rate, cut depth). The optimal combination of cutting parameters was a spindle speed of 2600 rpm, a feed rate of 720 mm/min, and a cut depth of 1.8 mm.
Keywords
Introduction
Polyetheretherketone (PEEK) is a crystalline high-performance special engineering plastic with excellent physical, mechanical, chemical, electrical and thermal properties such as its high heat resistance, fire resistance, and fatigue resistance. 1 To enhance the PEEK strength and performance, it is often necessary to add carbon fiber to the PEEK matrix. 2 Because carbon fiber and PEEK have a good compatibility, they can enhance the strength, friction performance and thermal properties of composites. Carbon-fiber filling provides the composites with a high performance, but increases the machining difficulty. 3 Cutting of CF-PEEK composites is usually needed to obtain components with a specified shape to meet the required dimensional accuracy and surface roughness to complete the assembly process. 4 However, because of the discontinuity, non-uniformity and anisotropy of the phase distribution of CF-PEEK composites, the cutting process is complex with fiber fracture, matrix cracking and fiber and matrix separation and release. Therefore, CF-PEEK processing is different from traditional metal cutting. Surface roughness is an important index that is used to evaluate a machined surface. A lower surface roughness implies an excellent friction performance, higher fatigue life, and precision fit of critical surfaces. However, the processing efficiency decreases when a high surface quality is achieved. Because, higher surface roughness is often obtained by reducing the cutting speed. The processing efficiency depends on the cutting tool properties, workpiece properties, and machining parameters. For a given material and specified tool, the primary steps for optimizing the surface roughness and machining efficiency is to optimize the machining parameters. An experimental optimization of machining parameters is expensive and time-consuming, so this study presents a predictive and mathematical model to optimize the surface roughness and material removal rate simultaneously. Through grey relational analysis (GRA) and principal component analysis (PCA), a multi-objective predictive model was developed. The response surface methodology (RSM) was used to optimize the machining parameters.
Recent studies have reported the machinability characteristics of CF-PEEK. For example, G. Petropoulos et al. 5 studied the impact of cutting conditions on surface roughness in turning of PEEK composites including unreinforced PEEK, reinforced PEEK with 30% of carbon fiber and reinforced PEEK with 30% of glass fiber using PCD tool and K15 cemented carbide tool. It was found that feed and cutting speed was the crucial cutting conditions and unreinforced PEEK presented the smallest surface roughness values than reinforced PEEK. J. Paulo Davim et al. 6 presented a study that evaluated the cutting parameters (cutting velocity and feed rate) under the surface roughness and damage in milling laminate plates of carbon fiber-reinforced plastics (CFRPs). They also established a model between cutting velocity and feed rate with the surface roughness and damage using multiple regression analysis. Xiao et al. 7 used an analytical approach to develop a model that can predict the cutting force for milling multidirectional laminate of carbon fiber reinforced polymer (CFRP) composites. Hanafi et al. 8 studied the turning process of 30% CF-PEEK composites using TiN cutting tools. They designed experiments by the Taguchi method, determined the effects of three different machining conditions and used the developed response surface models to optimize the machining conditions. Azmi AI et al. 9 elucidated the end milling machinability of GFRP composites with respect to surface roughness, tool life and machining forces. Taguchi analysis combined with statistical analysis of variance (ANOVA) was performed to quantify the effects of spindle speed, feed rate and depth of cut on those characteristics.
The influence of processing parameters on the machining responses and the multi-objective optimization of processing parameters have been studied extensively. Shi et al. 10 predicted the optimal parameters to improve the microhardness and surface roughness by using GRA in the dry milling of magnesium alloy. In the end milling of an aluminum composite, Rajeswari and Amirthagadeswaran 11 decreased the tool wear, cutting force and surface roughness, and improved the material removal rate (MRR) simultaneously by using RSM based GRA. A higher power consumption and a greater tool wear were related to and increased with spindle speed. In the dry turning of ASSI 1045 steel, a combination of RSM and GRA was applied by Kant and Sangwan 12 to reduce the power consumption and surface roughness. Their results suggested that the power consumption and surface roughness decreased when the spindle speed decreased. Oktem et al. 13 optimized the surface roughness in the machining of aluminum 7075-T6 by regression analysis. Bagaber et al. 14 studied the effect of turning parameters of stainless steel 316 on power consumption. To optimize the turning parameters, the method of response surface and compound desirability value were used. In the machining of tempered and hardened steel AISI 1060 under the application of a pressurized oil jet, Mia et al. 15 presented predictive model equations to elucidate the relationship between the surface roughness and machining parameters by applying RSM. Mia et al. 16 used Taguchi L36 orthogonal array experiments to evaluate the effects of cooling conditions and material hardness during machining. They presented a S-N ratio to optimize the surface roughness and machining temperature.
The literature indicates that multi-objective optimization problems have been applied more extensively than single-objective optimization problems in production. The machining of many different materials (such as milling and turning) have been studied and the cutting parameters have been optimized. However, there are shortcomings and limitations as discussed below.
In previous studies, no comprehensive analysis has been undertaken on the multi-objective optimization of dry milling of CF-PEEK composites with 30% short carbon-fiber. The material removal rate and surface roughness have rarely been considered simultaneously. The nonlinear relationship between the technological performances and processing parameters (spindle speed, feed rate, cut depth) has not been studied systematically. In terms of optimization methods, the GRA has been applied extensively in the multi-objective optimization of metal machining. However, the GRA has rarely been reported in the parametric optimization of CF-PEEK composite machining.
Although long carbon-fiber reinforced PEEK composites have been studied, limited research has been conducted to study the effect of machining parameters on the machinability of short and no-directional CF-PEEK composites during milling. Furthermore, previous studies have been limited to the optimization of only one response. Practicality, material removal rate and surface roughness often need to be considered simultaneously during production. Therefore, the aim of this work is to obtain a more comprehensive understanding of the milling process for short and no-directional CF-PEEK composites. The main influences of the machining parameters (spindle speed, feed rate, cut depth) on the material removal rate and surface roughness of CF-PEEK with 30% fiber contents were analyzed systematically based on GRA and RSM. Multi-objective optimization of the material removal rate and surface roughness was also studied. This study can provide operators and part-processing programmers with practical guidance on selection of machining parameters. It also provides important technical support to improve the machining quality and efficiency.
Methods of research and analysis
Research methods
As shown in Figure 1, the study was conducted by establishing a multi-objective predictive model, optimizing the machining parameters, and verifying the results.

Research methods used in the study.
In the first phase, milling parameters (spindle speed, feed rate, cut depth) and their levels and performance characteristics (surface roughness and material removal rate) were determined. According to the statistical requirements of the Taguchi orthogonal table, 27 experiments were carried out. In the second phase, GRA was used to transform a multi-objective problem (material removal rate and surface roughness) into a single objective problem (grey relational grade, GRG), and PCA was applied to evaluate the weights of material removal rate and the surface roughness. By using regression analysis, a mathematical model was established to predict the nonlinear relationship between the GRG and the machining parameters. In the third phase, the statistical significance of this model was determined by an analysis of variance (ANOVA). To confirm the results, optimized parameters were used in the verification experiments.
Analysis approaches
Three approaches were used: the GRA, PCA and RSM.
GRA
Data processing
In this multi-objective optimization, the experimental results must be transformed to a dimensionless quantity. The nondimensionalization was carried out by using the surface roughness (equation (1)) 17 and material removal rate (equation (2)), as follows 18 :


The original sequence is represented as

For the surface roughness, the original sequence was normalized as:

Grey relational coefficients
The grey relational coefficient was determined as 19 :

where


GRG
The GRG is determined as 12 :

Where
PCA
PCA is a comprehensive simplification of multivariate data. It is the dimensionality reduction of a high dimensional variable. The PCA steps are as follows 20 :
(1) Standardizing the original data
Assume that there are


Where,
(2) Computing correlation coefficient array
The correlation coefficient array

(3) Computing the eigenvalues and eigenvectors
The eigenvalues and eigenvectors are determined from the correlation coefficient array by using:

Where,
(4) Determining principle components.
The new indicator variables that consist of eigenvectors are 21 :

Where,
The contribution rate of the ith principal component is given in equation (14):

The cumulative contribution rate of the first Pth principal components is given in equation (15):

When
RSM
The response surface is a function between the response variable and the input variables. For a model with one factor in the model, the response surface is a curve in two-dimensional space. For two factors, the response surface is a surface in three dimensions. In the analysis of multi-factor quantitative processing, the regression relationship between the test indicators (dependent variables) and multiple test factors (independent variables) can be analyzed by RSM. To study the effect of the machining parameters on the response, a second-order polynomial mathematical equation, as shown in equation (16), was used to develop the response surface 22 :

where
Experiments
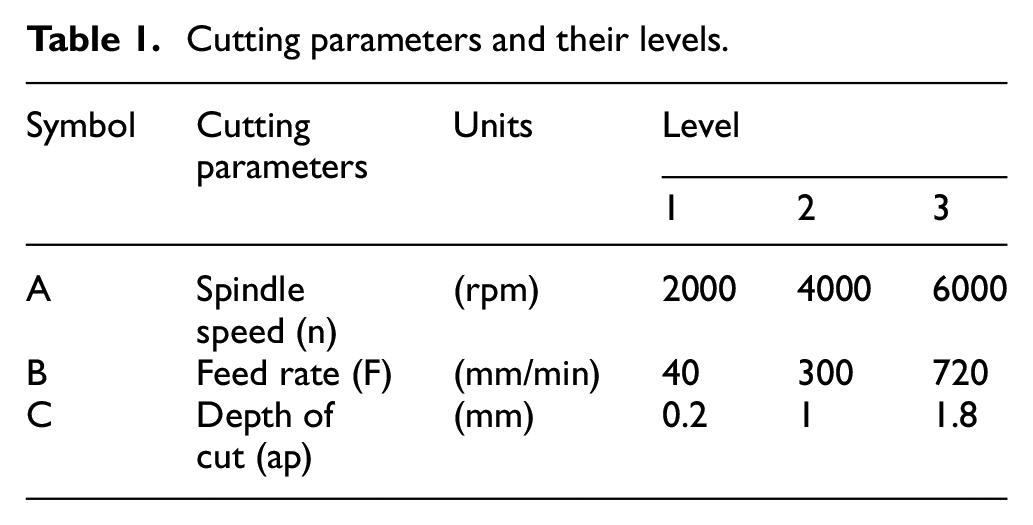
Milling experiments were carried out on a 5-axis machine tool with a maximum spindle speed of 18,000 rpm under dry cutting conditions. We selected the cutting parameters and their levels as shown in Table 1.
Cutting parameters and their levels.
Materials
Figure 2 shows a micrograph of the 30-µm-long CF-PEEK composite sample that was reinforced with 30% short carbon fiber. The carbon fiber was distributed in the PEEK matrix randomly and evenly. The size of the machining specimen was 80 mm × 30 mm × 30 mm.

Micrograph of 30% short carbon fiber reinforced PEEK.
Cutting tools
An 8-mm-diameter PCD end mill with two blades was selected to process the CF-PEEK and cut width is 4mm. The PCD tool has high hardness, high compressive strength, good thermal conductivity and abrasion resistance, and it can achieve a high machining accuracy and efficiency. PCD tool displays an excellent performance when cutting carbon/epoxy or carbon/PEEK materials. 23 PCD tool tends to provide lower roughness than cemented carbide tool when it was used to cut PEEK composites. 5
Photographs of the milling experimental device and the end mill that were used are presented in Figures 3 and 4, respectively.

Diagram of the milling experimental device.
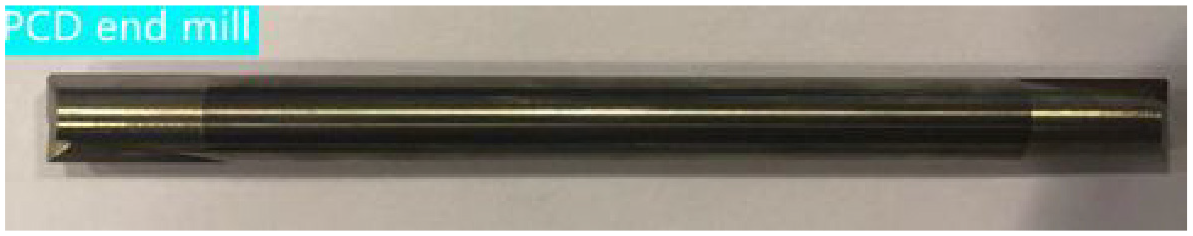
PCD end mill used in experiments.
Performance parameter measurement
After the milling experiments, the surface roughness was measured by using a two-dimensional surface roughness tester (SJ-310, Japan) according to surface roughness measurement standard ISO 4287, as shown in Figure 5. In each trial, the machined surface roughness was measured three times, and the mean value of the three measurements was selected as the measured result. The MRR was computed from equation (17) 24 :

Where
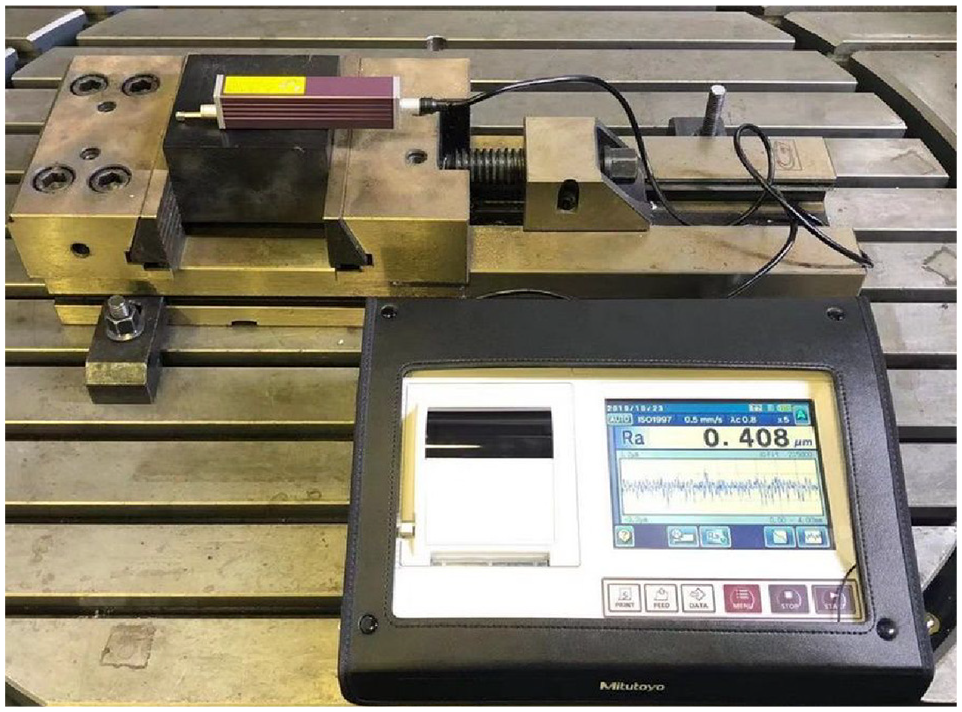
Surface roughness measurement.
The experimental results, including the MRR and surface roughness (Ra), are given in Table 2, and some R-profiles of the surface roughness are shown in Figure 6.
Orthogonal table L27 for responses.

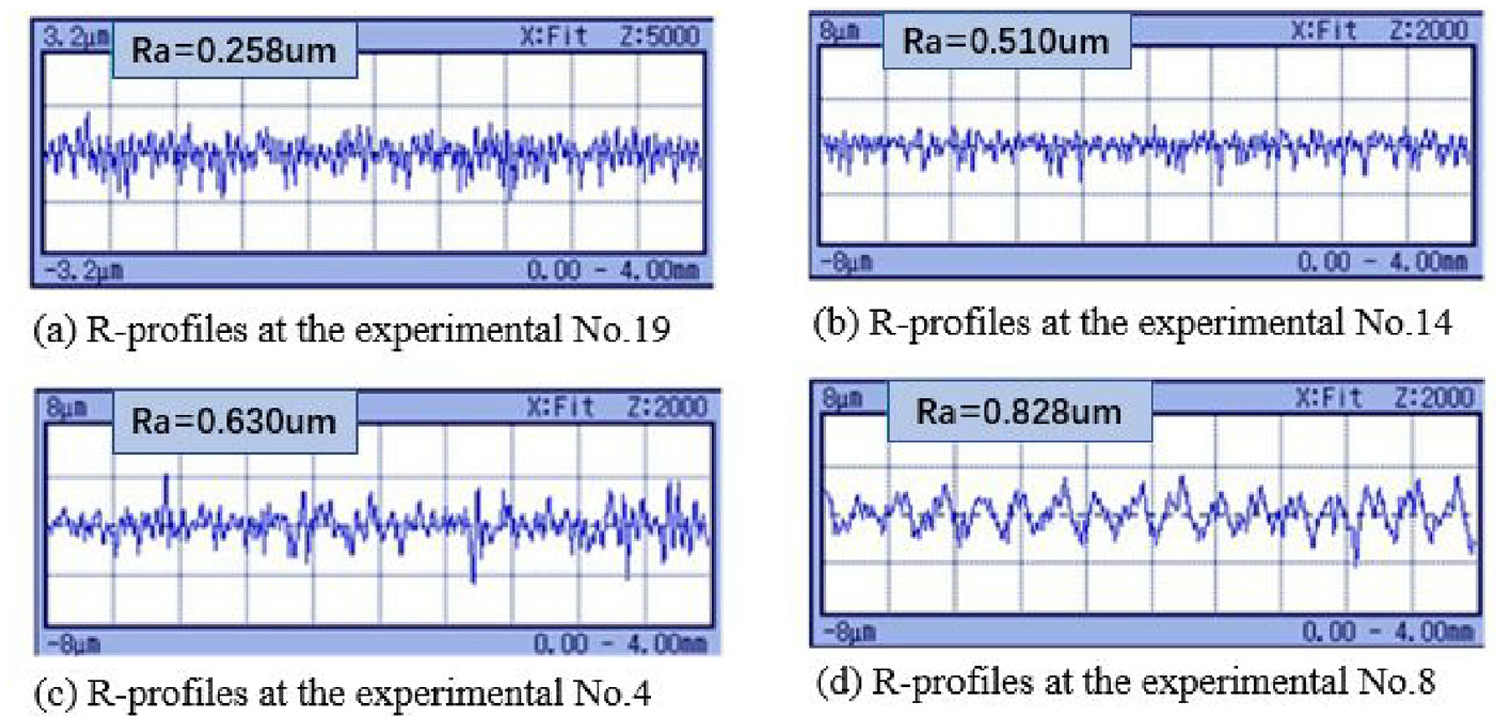
Roughness profiles at various machining conditions.
Establishing the predictive model
Calculation of grey relational coefficient
Table 3 shows the S-N ratio values and their normalized values. The S-N ratio values were computed from equation (1) for Ra and equation (2) for MRR. The processing sequence was calculated by using equation (4) as the surface roughness fits “the-smaller-the-better” methodology, whereas for the material removal rate, the values were calculated by using equation (3) because the MRR fits “the-larger-the-better.”
The calculated values of processing sequences, deviation sequences, grey relational coefficient, and grey relational grade.

The deviation sequence was computed as follows:


From the deviation sequences in Table 3, we found that:

The GRC values were calculated as:

Computing GRG
Before computing the GRG, we need to determine the weights of the response characteristics. The eigenvalues, eigenvectors and performance characteristics contribution rate are shown in Tables 4 and 5.
Eigenvalues and contribution rate for principal components.

Eigenvectors for principle components.
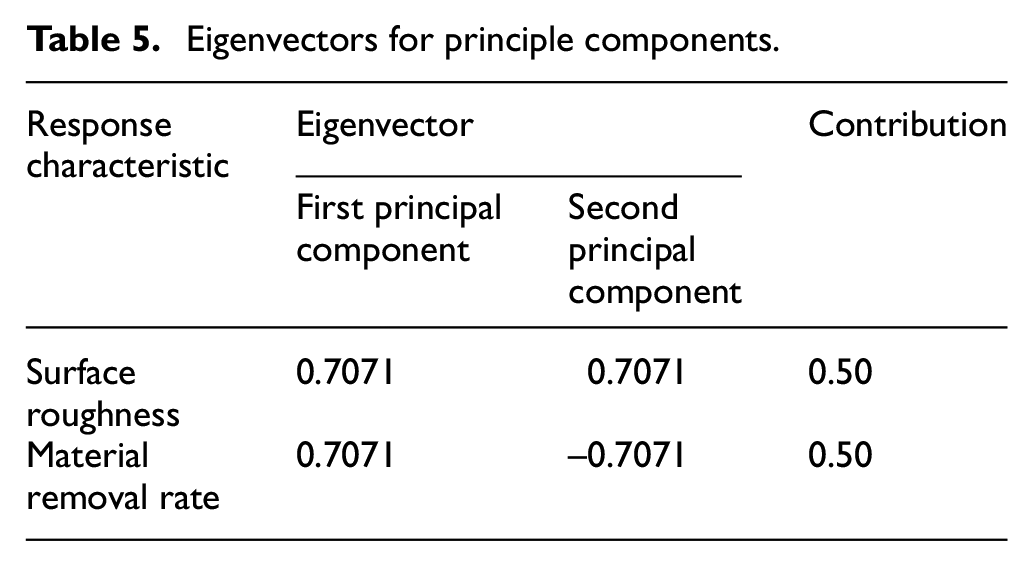
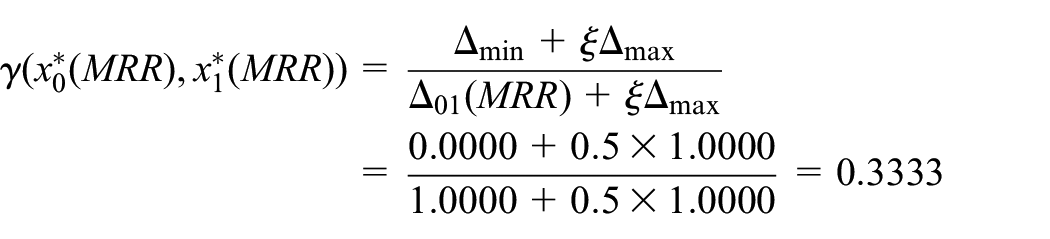
The eigenvectors for principal component in Table 5 show that the weights of surface roughness and material removal rate are 0.5 in the GRA. The MRR and Ra have an equivalent effect on the GRG. Thus, in equation (8),

The rest can be calculated in the same way, and the values are given in the tenth column of Table 3. The rank of GRG is also shown in Table 3.
Finding the optimal experimental run
The average GRG for each cutting parameter level was calculated. The average GRG for spindle speed at level 1 was computed.

In a similar way, the average GRG values for n, F, and ap at their three levels were calculated and are given in Table 6.
Response table for average grey relational grade.
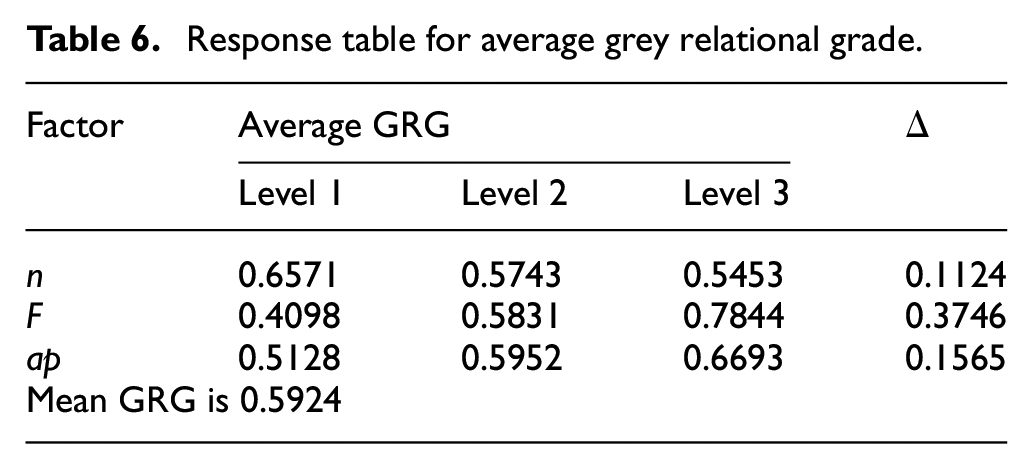
The better performance characteristics correspond to the largest GRG. Therefore, the optimal level of every parameter is a spindle speed at level 1 (2000 r/min), a feed rate at level 3 (720 mm/min), and a cutting depth at level 3 (1.8 mm). It also corresponds exactly to the maximum GRG value of the ninth experiment. The Max–Min values (

Predictive model
The predictive model for the GRG was established as follows:


Figure 7 shows the experimental results and predicted values of the GRG. The two sets of values correspond well.
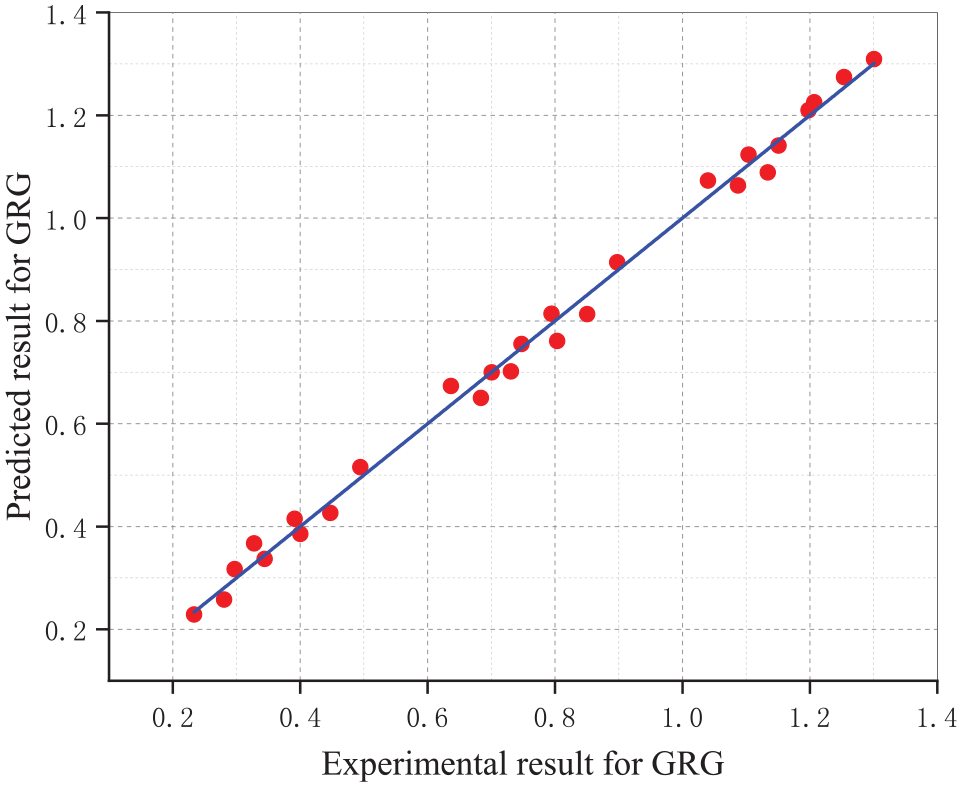
Predicted values of CRG and experimental values of GRG.
Optimization of cutting parameters
ANOVA
An ANOVA was carried out to determine the important cutting parameters. The confidence of the ANOVA was 95%. The sum of squares, the mean square, the F value, and the P value of every factor for the GRG are shown in Table 7. In general, if F > 4, the input parameter has a significant impact on the response characteristics. If p < 0.05, the input parameter is considered statistically significant. 25 Table 7 also shows the contribution rate of each parameter for GRG.
Analysis of variance (ANOVA) for GRG.
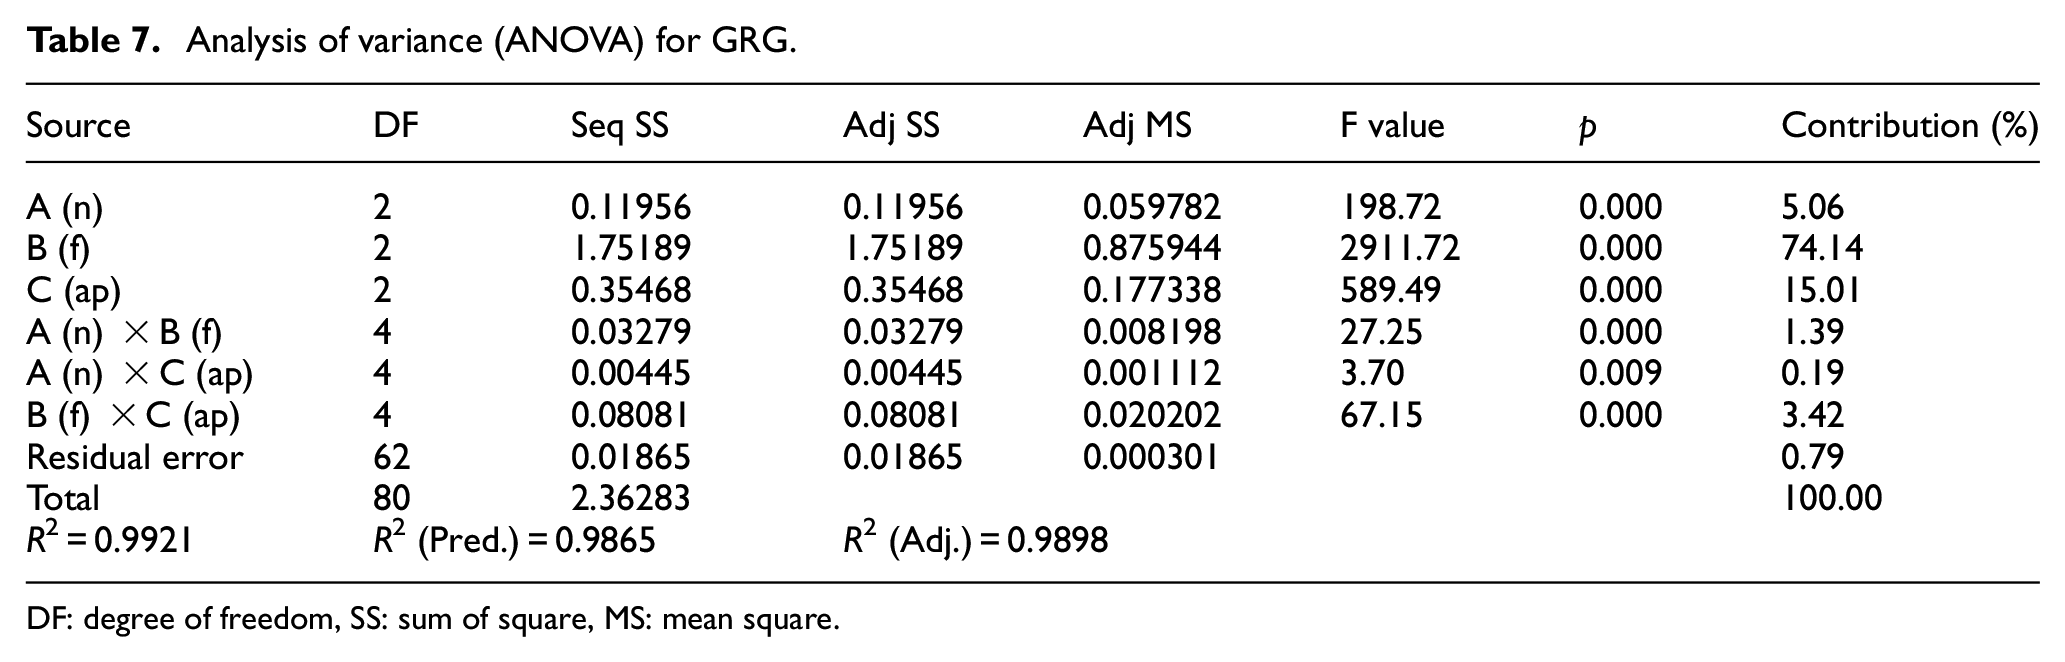
DF: degree of freedom, SS: sum of square, MS: mean square.
From Table 7, we conclude that the feed rate (F) is the most important machining parameter because of its high contribution rate of 74.14%, followed by a cut depth (ap) at 15.01% and a spindle speed (n) of 5.06%.
Model fitness check
Figure 8 shows the normal probability plot of the GRG residual, which forms a straight line and indicates that this model is effective. Figure 9 shows a plot of the residual versus the fitted values for the GRG. Because there are no obvious patterns or abnormal structures, it is clear that the developed model is adequate to evaluate the GRG. 18
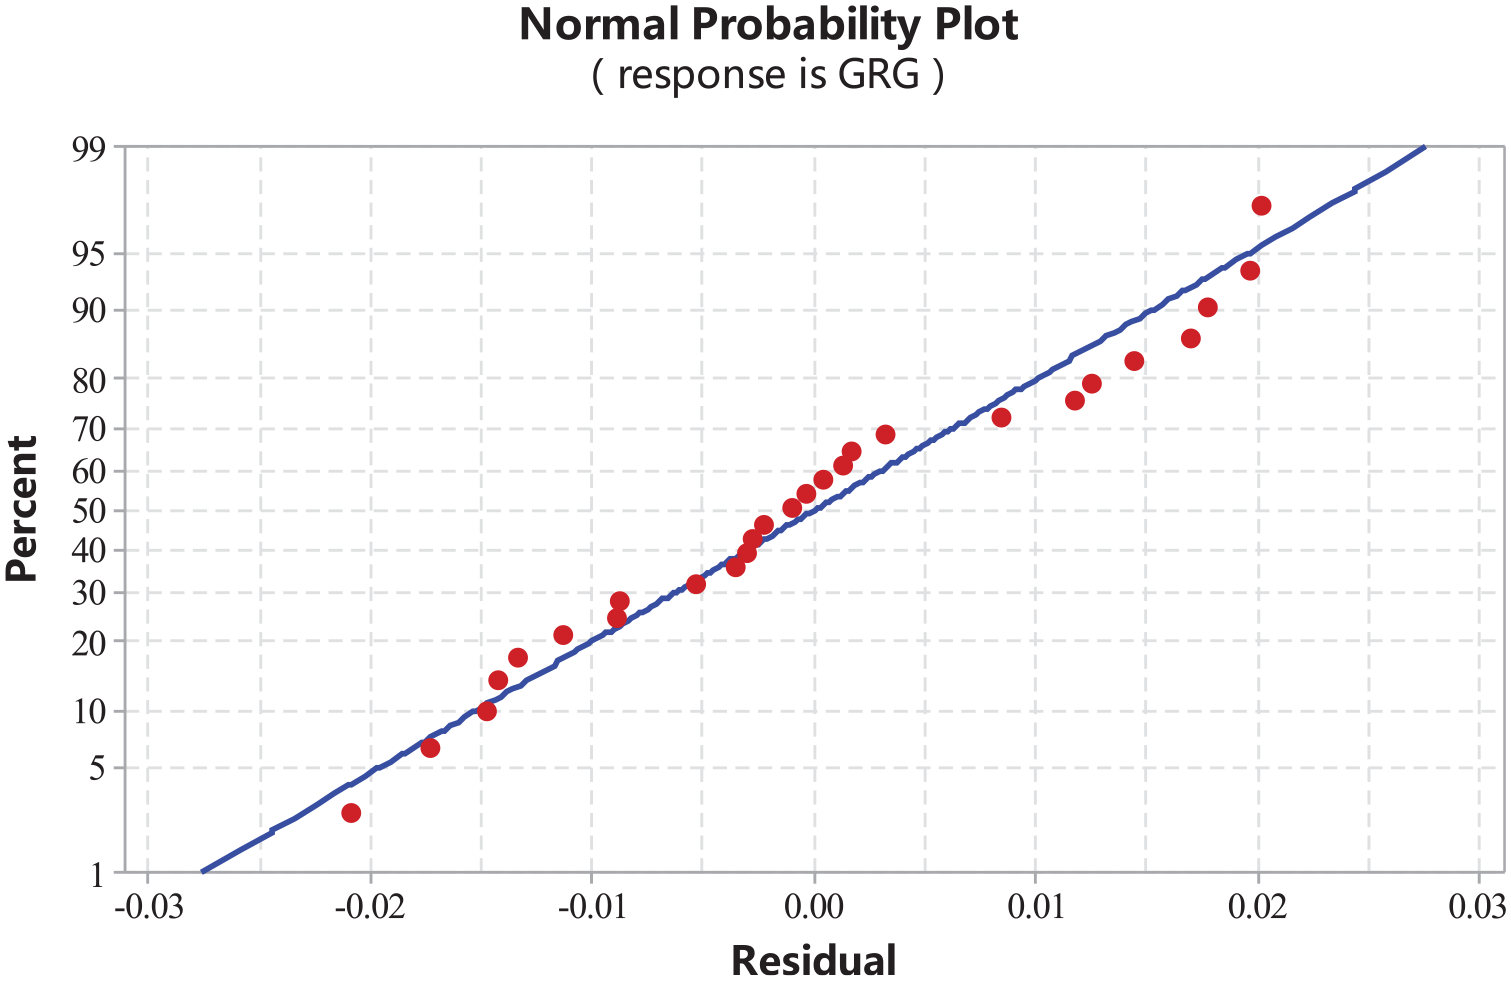
Normal probability plot of residual for GRG.

Plot of residual versus fitted values for GRG.
Influence of parameters on GRG
Figure 10 shows the main effect plot for MRR, Ra and GRG. The horizontal line is the average value. A larger line slope indicates a greater impact on the response. Figure 10(a) shows that the influence of cutting parameters on MRR is: F > ap > n. The optimal combination of processing parameters for MRR are level 3 for feed rate and cut depth, and spindle speed has no effect on MRR. By the same token, Figure 10(b) shows that the influence of cutting parameters on Ra is: F > n > ap. Ra decreases as spindle speed grows but increases as feed rate grows. Cut depth has the minimal impact on Ra. When ap is 0.2 mm and 1 mm, Ra doesn’t change much, and when ap is 1.8 mm, Ra increases significantly. Figure 10(c) shows that the slope of feed rate was largest, followed by cut depth and spindle speed. To obtain a high surface quality at a high machine efficiency, the optimal values are levels 3, 3, and 1 for feed rate, cut depth and spindle speed, respectively. This result is also consistent with the parameters corresponding to the maximum GRG value in Table 3.

(a) Main effects plot for material removal rate (MRR), (b) main effects plot for average surface roughness (Ra), (c) main effects plot for material removal rate (GRG).
The interaction plot for GRG is shown in Figure 11. In the two graphs in the first row, the line space is smallest, which indicates that the spindle speed had the smallest effect on the GRG. The feed rate had the greatest impact on the GRG, and the cut depth is second largest. The graphs in the second column show that when the feed rate is at level 1, the GRG value remains virtually unchanged regardless of the spindle speed and cut depth. The interaction graph shows that the maximum GRG value appears when the spindle speed is at level 1, and the feed rate and cut depth are at level 3.

Interaction plot for GRG.
Figure 12 shows the three-dimensional surface and contour plots that represent the influence of the three milling parameters on the GRG. As shown in Figure 12(a), feed rate influenced the GRG more than the spindle speed. The GRG was a maximum at a smaller spindle speed and larger feed rate and increased with an increase in feed rate. The influence of feed rate and cut depth on the GRG at a spindle speed of 4000 rpm is shown in Figure 12(b). The GRG was a maximum at a larger feed rate and cut depth. Even at smaller cutting depths, with an increase of feed rate the CRG increased and when feed rate is large, the GRG increased with the increase of cut depth. Figure 12(c) confirms that the GRG is a maximum at larger cut depth but at lower spindle speed. With an increase in cut depth, the GRG increases, but compared with Figure 12(a), the maximum GRG was lower. The 3D surface and contour plots show the relationship between the GRG and the machining parameters, namely the spindle speed, feed rate and cut depth. These results can serve as a guide for operators to select the appropriate machining parameters.

(a) surface and contour plot showing the influence of feed rate and spindle speed on GRG at 1 mm depth of cut, (b) surface and contour plot showing the influence of feed rate and depth of cut on GRG at 4000 rpm spindle speed, (c) surface and contour plot showing the influence of depth of cut and spindle speed on GRG at 300 mm/min feed rate.
Optimum GRG values
The goal of this study was to determine the optimal combination of machining parameters to obtain the minimum surface roughness and maximum machining efficiency. To achieve this goal, Minitab 18 was used for the response surface optimization and the result is shown in Figure 13. The optimal combination was a spindle speed of 2600 rpm, a feed rate of 720 mm/min and a cut depth of 1.8 mm.

Optimization plot of GRG using response optimizer.
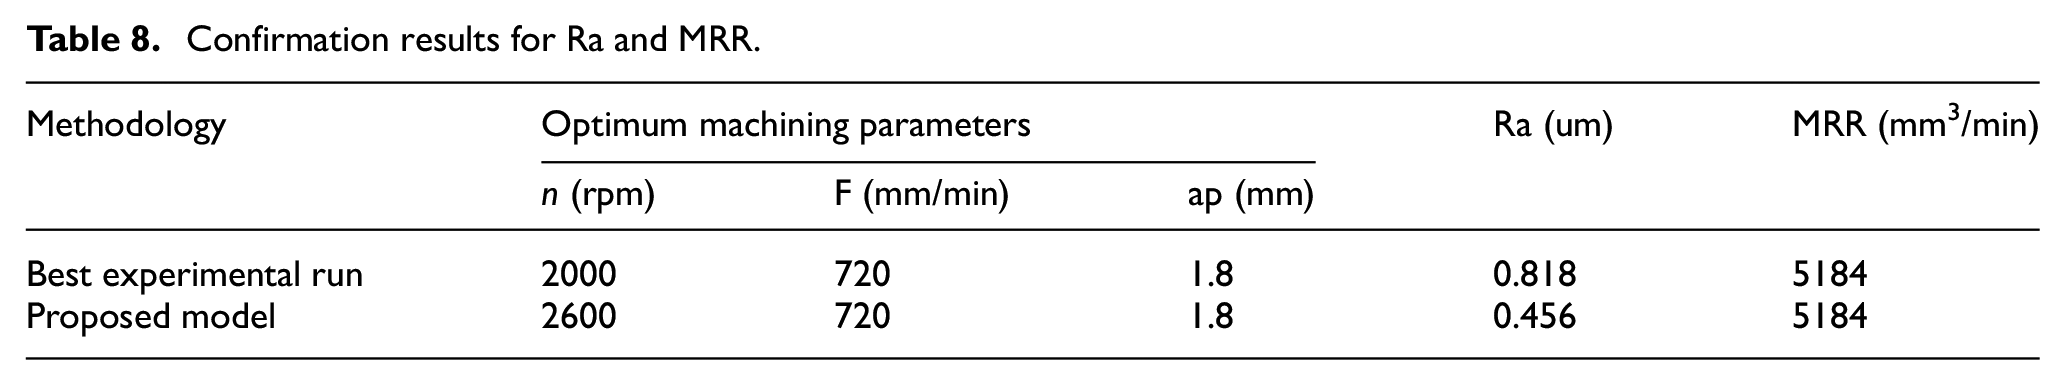
Confirmation experiment
The optimal machining parameters for the confirmation experiment are shown in Table 8. The results of the confirmation experiment for the surface roughness and material removal rate are listed in Table 8. It is concluded that the optimal machining parameters can lead to better surface roughness.
Confirmation results for Ra and MRR.
Discussion
The influence of cutting parameters on material removal rate and surface roughness
As can be seen from equation (17), material removal rate is related to cut width, feed rate and cut depth and MRR increases with the increase of these three parameters. However, spindle speed has no effect on MRR.
The surface roughness increases with increase of feed rate. This can be explained by the theoretical surface roughness formula: Ra ≈f2/ 8r, where r is nose radius of the cutting tool and f is feed rate. 12 Because when feed rate increases, it means more heat and vibration will be created and therefore lead to higher surface roughness. 26 The surface roughness decreases with increase of spindle speed. This situation can be explained as an increase of spindle speed will reduces the formation of build-up edge and vibration, which is benefit for surface quality. 27
Comparison of relevant literature
This paper provides an optimization of material removal rate and surface roughness simultaneously during a milling of 30% CF-PEEK. During the literature research, the author found only one research paper 28 related to optimization of MRR and Ra. In that paper, the effects of cutting speed, feed rate and depth of cut on surface roughness and material removal rate during turning of X20Cr13 were investigated using Taguchi experimental design method and ANOVA. It was concluded that feed rate and depth of cut were the most significant factors for Ra and MRR respectively. The current research also shows that feed rate and depth of cut were the most significant factors for MRR. But for surface roughness, the most significant factors are feed rate and spindle speed, which is different from the Lakhdar Bouzid’s 28 results. This may be because of difference in the workpiece material and cutting mode (turning and milling). Not only metal and plastic materials are different in cutting properties, but also different plastics. Tushar U Jagtap et al. 29 proposed a review paper on the machining of polymers: cases of turning, milling, and drilling. The authors indicated that the behavior regarding machining of various polymers is not the same. For example, Azmi AI et al. 9 studied the Machinability study of glass fiber-reinforced polymer composites during end milling. This study revealed that feed rate is the governing factor affecting all the machinability outputs. Therefore, the study of machining properties of 30% CF-PEEK composite material is necessary.
Unlike Hanafi et al. 30 the weights of the two factors (material removal rate and surface roughness) in this paper are not assumed, but determined by using principal component analysis.
Hanafi et al., 30 Camposeco-Negrete et al. 31 and Emami et al. 32 only provide the average value of response for a level of parameters. However, this study not only gives the average value of response but also gives 3D surfaces created by using RSM, it will give operators the effect of parameters on response. It is an important and realistic guidance.
Conclusion
This study presents a multi-objective optimization model to minimize the surface roughness and maximize the cutting efficiency during the machining of 30% CF-PEEK. It has been concluded that optimum machining parameters can be obtained by the predictive model and the predictive model was statistically significant by ANOVA. It was observed that feed rate is the main cutting parameter for the maximization of cutting efficiency and the minimization of surface roughness followed by the cut depth and spindle speed. The optimal combination of cutting parameters was a spindle speed of 2600 rpm, a feed rate of 720 mm/min, and a cut depth of 1.8 mm. For material removal rate, feed rate is the main influencing parameter followed by depth of cut and spindle speed doesn’t have effect on material removal rate. For surface roughness, feed rate is the main influencing parameter followed by spindle speed and depth of cut. For operators, the 3D surface and contour plots will be a good reference for choosing the optimal machining parameters. It is also useful for machine tool manufactures to give a proper range of cutting parameters for particular application. This study can be a reference for analyzing the effect of different machining parameters and tools on material removal rate and surface roughness during machining other material.
Footnotes
Notation
ap Cut depth
ae Cut width
Handling Editor: Min Zhang
Declaration of Conflicting Interest
The author(s) declared no potential conflicts of interest with respect to the research, authorship, and/or publication of this article
Funding
The author(s) disclosed receipt of the following financial support for the research, authorship, and/or publication of this article: The work is supported by the National Natural Science Foundation of China (Grant No. 51674251).