
Abstract
The objective of this study is to perform experimental and numerical analysis of the static strength and fatigue life reliability of parabolic leaf springs in heavy commercial trucks. To achieve this objective, stress and displacements under static loading were analytically calculated. A computer-aided design model of a parabolic leaf spring was created. The stress and displacements were calculated by the finite element method. The spring was modelled and analysed using CATIA Part Design and ANSYS Workbench. The stress and displacement distributions on a three-layer parabolic leaf spring were obtained. The high-strength 51CrV4 spring steel was used as sample parabolic leaf springs material, and heat treatments and shoot peening were applied to increase the material strength. Sample parabolic leaf springs were tested to obtain stress and displacement under static loading conditions. By comparing three methods, namely, the static analytical method, static finite elements method and static experimental method, it is observed that results of three methods are close to each other and all three methods are reliable for the design stage of the leaf spring. Similarly, sample parabolic leaf springs were tested to evaluate the fatigue life under working conditions. The reliability analysis of the obtained fatigue life test value was carried out. It was shown that both analytical model and finite element analysis are reliable methods for the evaluation of static strength and fatigue life behaviour in parabolic leaf springs. In addition, it is determined by a reliability analysis based on rig test results of nine springs that the spring achieves its life cycle of 100,000 cycles with a 99% probability rate without breaking. Furthermore, the calculated fatigue life is 2.98% greater than experimentally obtained fatigue life mean and the leaf spring can be used safely and reliably during the service period in heavy trucks.
Introduction
The goal of this study is to define the factors affecting the static strength and fatigue life behaviour of parabolic leaf springs and to validate the methods used to design new leaf springs commonly used in heavy commercial vehicles that meet the demands of the vehicles prior to the prototyping and manufacturing process. The stress and displacement analyses of a three-layer parabolic leaf spring designed for a heavy truck have been performed using the numerical and finite element methods (FEMs).
A parabolic leaf spring takes its name from its shape and may have one or more layers. An example of a three-dimensional (3D) parabolic leaf spring is shown in Figure 1.

A 3D parabolic leaf spring.
Parabolic leaf springs are vital components of the suspension system that absorb the vertical vibrations and impacts due to road conditions. They store potential energy as strain energy that is gradually released to maintain driving comfort. In spite of the fact that leaf springs have long been used as suspension components, this kind of spring is still widely used in automobiles, and in particular in light and heavy commercial trucks.
Increasing developments and innovations in the automobile industry tend to modify or replace the existing components by developed and improved products. Parabolic leaf springs have replaced conventional leaf springs because they are lighter, cheaper, have better fatigue life and provide greater noise isolation.
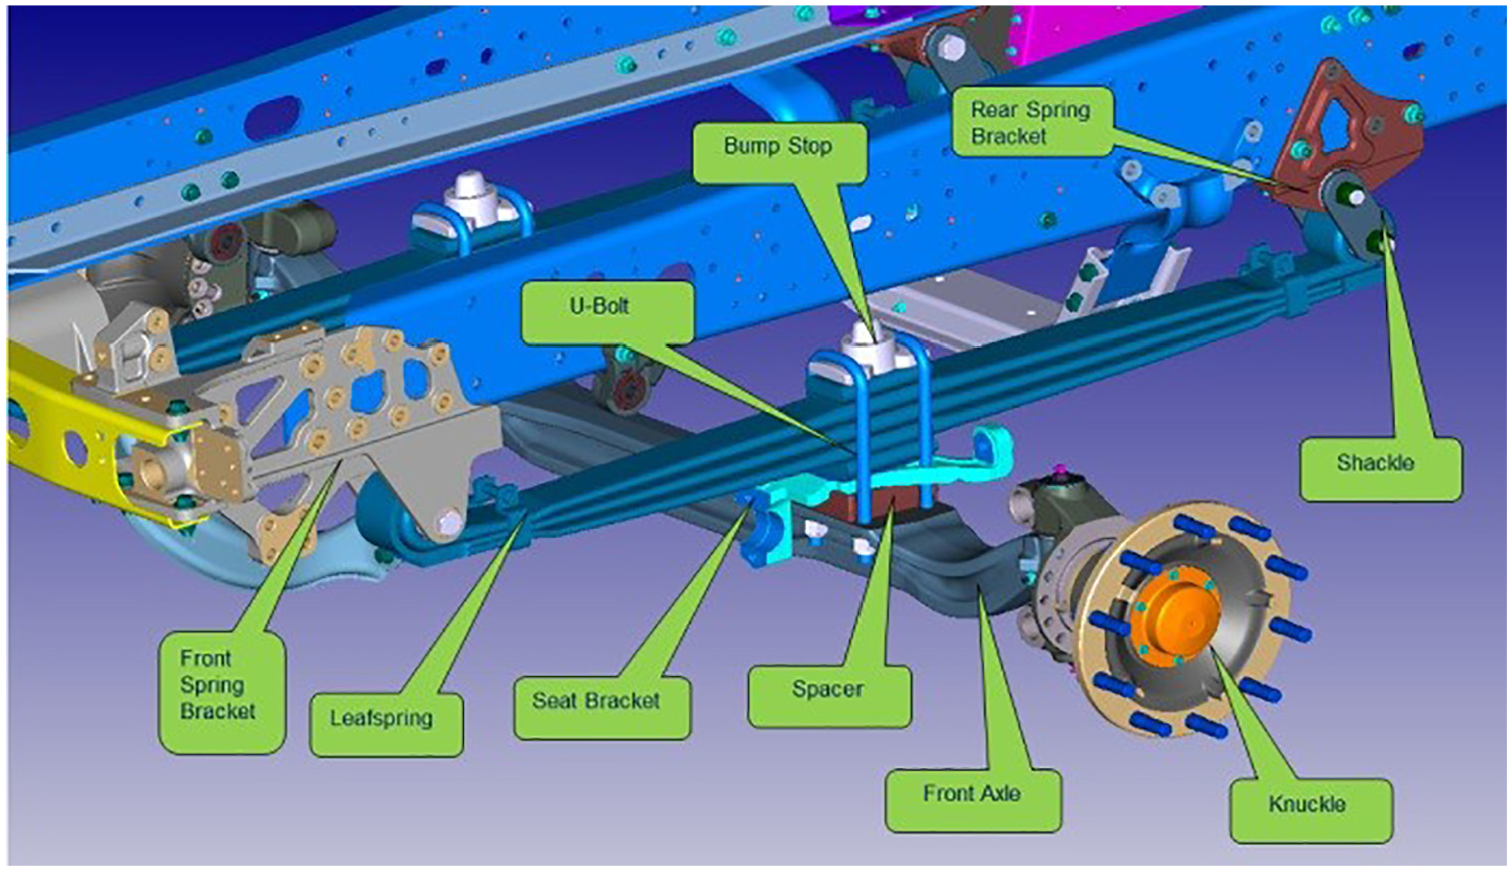
Fatigue behaviour is one of the most important parameters in the design of parabolic leaf springs. Determination of the fatigue behaviour of parabolic leaf springs is crucial for improving the fatigue behaviour during future design. The location of the parabolic leaf springs in a heavy commercial truck is shown in Figure 2.

Location of parabolic leaf springs in a heavy commercial truck.
Parabolic leaf springs are often used in the suspension systems of vehicles and are the parts responsible for driving comfort and safety. These springs are exposed to dynamic forces and need to withstand many cycles without failure during their service life. 1
Particularly in automotive industry, the use of leaf springs is the optimal approach for providing effective suspension in all categories commercial vehicles such as heavy, medium and light vehicle. Their basic advantage compared to the alternative suspension system based on air springs is the combination of guidance and suspension of axles using only one constructional element that leads to low cost. 2
The most appealing type of axle suspension system in heavy-duty motor trucks is the utilization of single- to multi-leaf springs that couples the vertical and longitudinal guidance with the suspension of the axle. 3 The leaf springs system is an advantageous type of suspension systems that requires fewer additional components than other suspension systems, thereby enabling lighter and lower-cost structures. In particular, the vehicle manufacturer sets the requirement of the fatigue life of the leaf springs under specific operating loading conditions referring to the corresponding vehicle. 4
Among the many contributing factors, the load range, number of load cycles and specimen geometry including configuration and size are three most important variables for fatigue failure. Fatigue damage is a type of brittle fracture under cyclic loading. Similar to brittle fracture under monotonous loading, fatigue damage is also a random event that depends on the specimen size. 5 The probabilistic nature of fatigue failure is reflected in the random fatigue life of a set of specimens with nominally identical geometry and dimensions subjected to cyclic loading with nominally identical amplitude and mode. 5
The fatigue phenomenon of metallic structures such as leaf springs presents random behaviour that is influenced by a probabilistic effect of many factors. The suggested probabilistic approach was used to assess the fatigue reliability of a single asymmetric parabolic leaf spring with uncertainties associated with its design parameters. To estimate the fatigue resistance according to the Gerber criterion, the probabilistic approach was developed using the ‘strength-load’ method and Monte Carlo simulations. 6
The influence of the environmental media on fatigue life manifested in the variation of fatigue life with applied stress, grain size, inclusion size and material yield stress was explained. It was concluded that fatigue life decreases with the applied loading and inclusion size, whereas it increases with the material yield stress. The plateau of S-N curve corresponding to the transition from surface crack initiation to subsurface crack initiations was predicted. 7
This article focused on the verification of the methods used to define static strength and fatigue life reliability and the factors affecting the fatigue life behaviour of a three-layer parabolic leaf spring used in a heavy commercial vehicle.
Properties of a parabolic leaf spring
The design of a three-layer parabolic leaf spring of a heavy commercial vehicle must include an investigation of its fatigue behaviour. Assembly of the spring on the suspension system in a virtual environment is shown in Figure 3.
Assembly of the suspension system.
Design parameters and dimensions of the parabolic leaf spring
The following loading conditions that have the most significant influence on the integrity of the front axle’s leaf springs8–12:
Pure vertical loading that occurs due to straight-ahead driving;
Vertical and longitudinal loading that occur simultaneously due to braking.
The maximum values of the above two loading conditions are expressed in relation to the vehicle’s half-payload Fn. They are taken into account for the accurate design and durability of the end product.8–12
The maximum vertical load Fv,max during straight-ahead driving is given by

The maximum vertical and longitudinal forces Fv,max and Fbr,max at full braking are given by


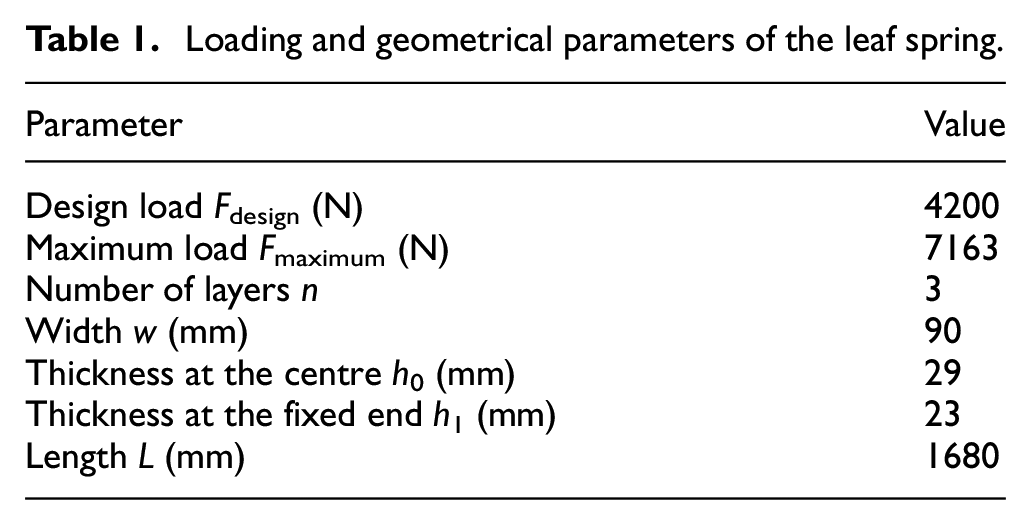
Both the stresses due to the maximum vertical load and due to braking are taken into account in the design. The design parameters and dimensions of the parabolic leaf spring are given in Table 1.
Loading and geometrical parameters of the leaf spring.
Analytical analysis of parabolic leaf spring
The maximum stress and displacement on the three-layer parabolic leaf springs are calculated using equations (4) and (5) 13


where σmax is the maximum stress on the spring (MPa), s is the deflection of the spring (mm), F is the force (N), n is the number of layers of the spring, w is the width of the spring (mm), h0 is the thickness at the centre (mm), h1 is the thickness at the fixed end (mm), L is the length of the spring (mm) and E is the modulus of elasticity of the spring material. The maximum stress and displacement results for design load and maximum load are shown in Table 2.
Maximum stress and displacement.

The theoretical load and displacement diagram of a parabolic leaf spring is shown in Figure 4.
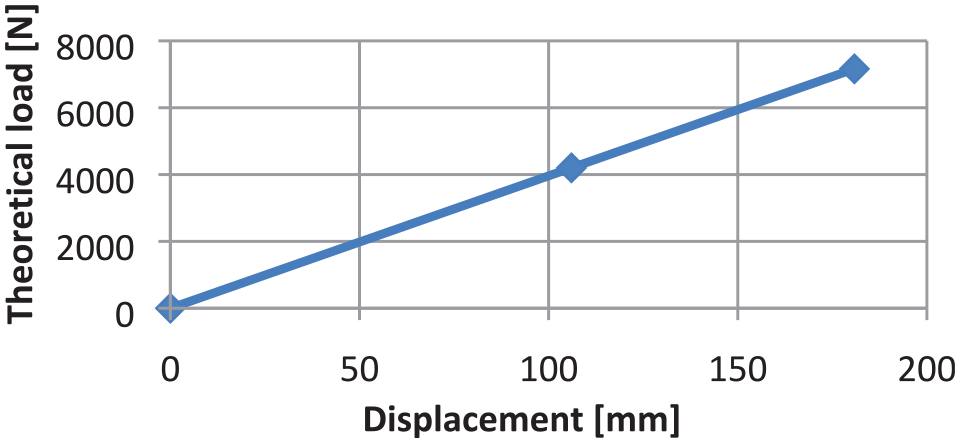
Theoretical load and displacement diagram.
The stiffness of the parabolic leaf spring k was found to be 39.6 using equation (6)

3D computer-aided design modelling
Computer-aided design (CAD) modelling of a parabolic leaf spring was performed using CATIA V5 R20 in Part Design Workbench. It is essential to use the developed CAD model as a physical specimen prior to the production of a prototype. The materials assigned to the computer model and its properties are shown in Figure 5 and Table 3, respectively.
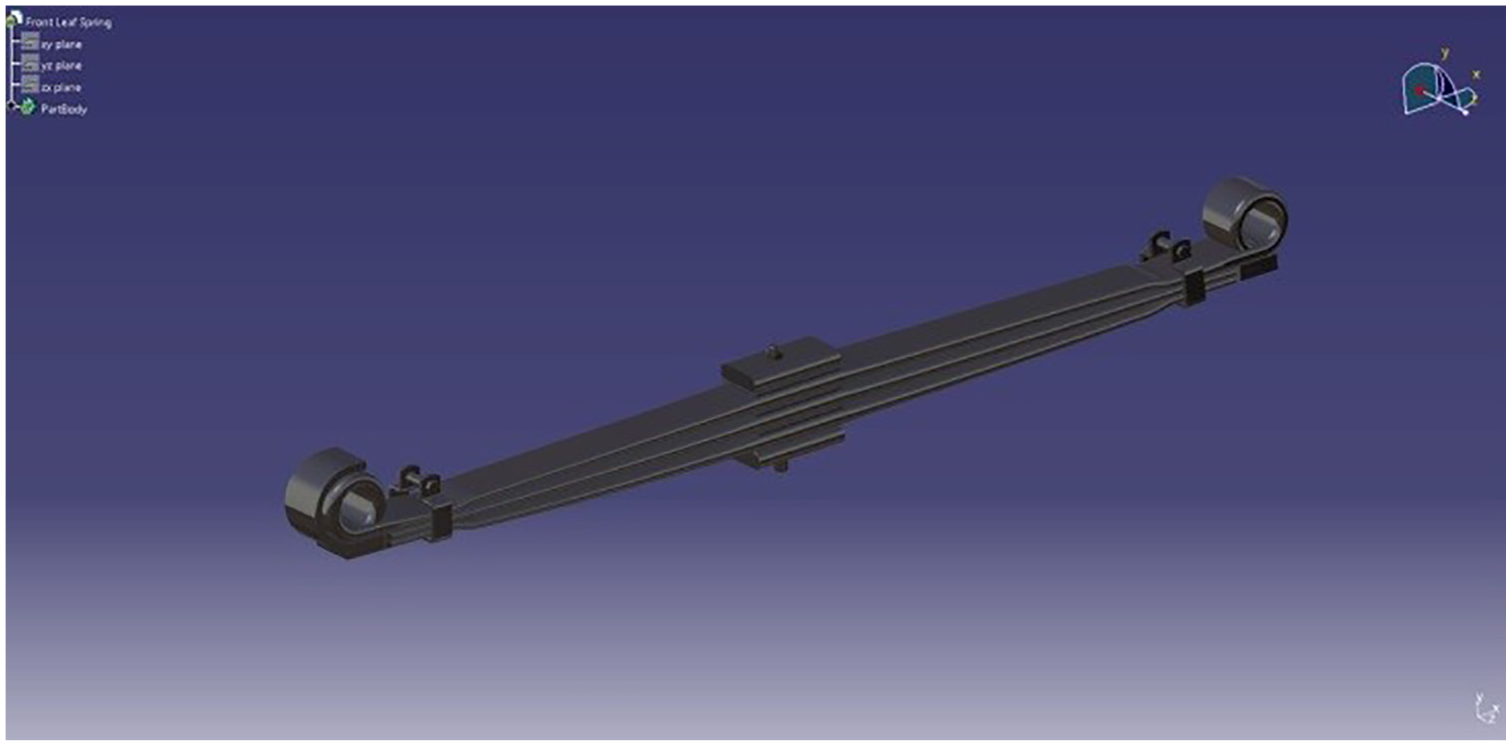
CAD model of the parabolic leaf spring.
Properties of the CAD model.

Finite element analysis
The FEM is a numerical procedure that can be used to obtain solutions for a number of engineering problems involving stress analysis. ANSYS is a comprehensive general-purpose finite-element computer program.14,15 The 3D model of a parabolic leaf spring is created using CATIA V5 loaded into ANSYS for meshing, adjusting boundary conditions and the analysis process.
Mesh model
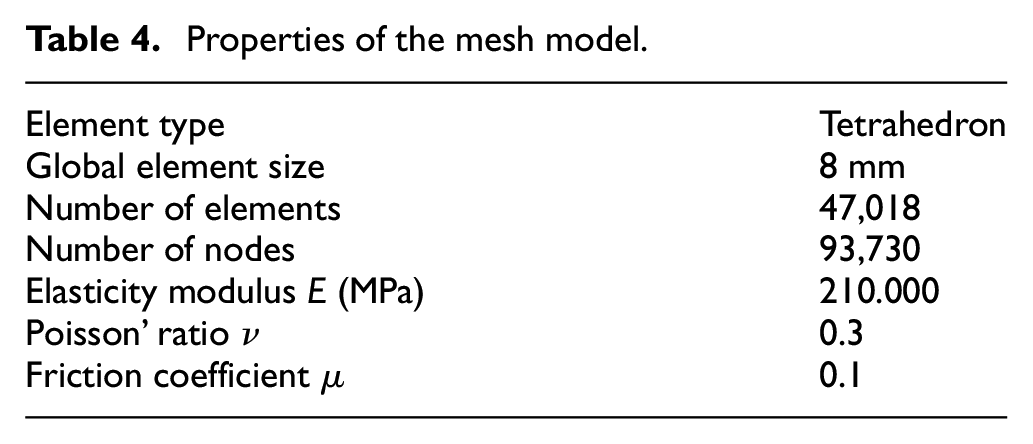
Meshing is simply the process of slicing a 3D model into tiny elements to prepare for the analysis. The finite element mesh model of the parabolic leaf spring has the following properties. The properties of the mesh model are given in Table 4. The mesh model of the parabolic leaf spring is shown in Figure 6.
Properties of the mesh model.
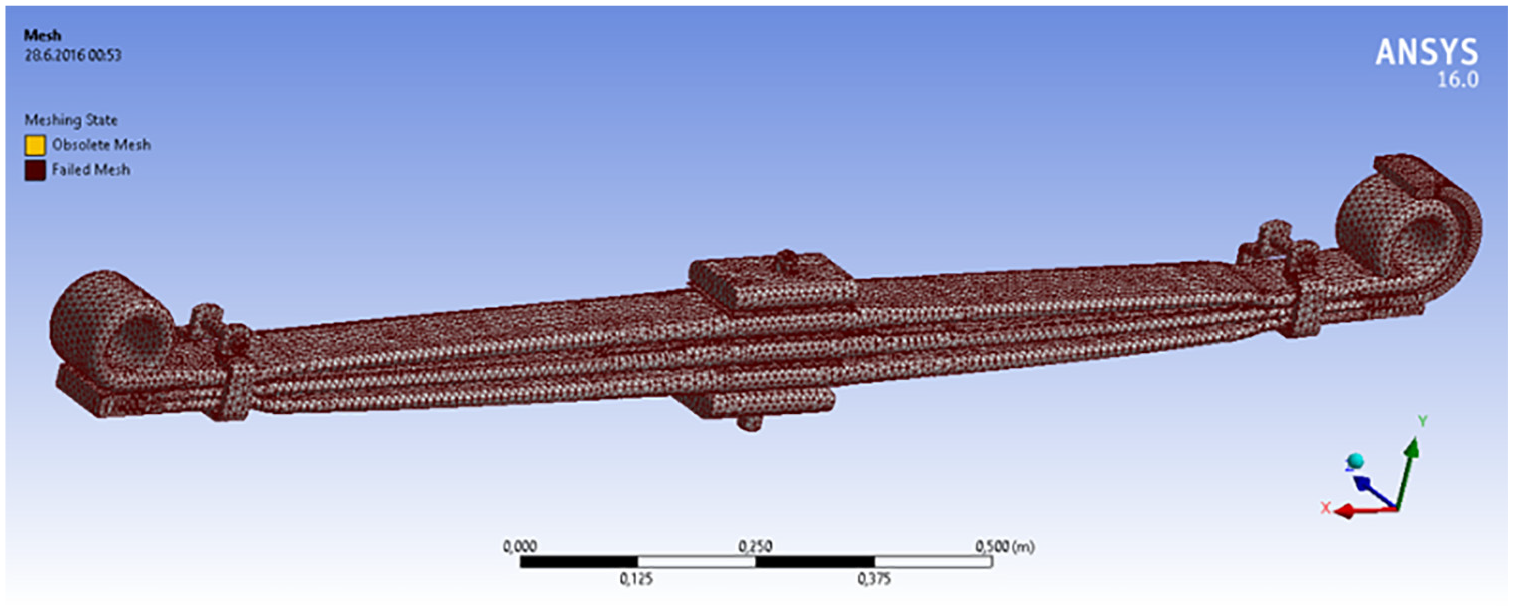
Mesh model of the parabolic leaf spring.
Boundary conditions
To simulate the actual conditions of the assembly for analysis, the boundary conditions were created as described below:
The front eye of the leaf spring was constrained with respect to translation in the x, y and z directions and with respect to rotation in the x and z directions by allowing free rotation in the y direction.
The rear eye of the leaf spring was fixed with respect to translation in the y and z directions and with respect to rotation in the x and z directions by allowing free translation in the x direction and free rotation in the y direction.
The axle load is applied in the vertical direction. The materials of the parts of the parabolic leaf spring are properly assigned.
Static structural analysis
A static structural analysis of the parabolic leaf spring was created for both the design load and the maximum load.
Applied load
The applied load was considered in two stages for the design load and maximum load as follows.
At design load
The analysis results with a 4200-N design load von-Mises stress and maximum displacement are shown in Figures 7 and 8.

Stress analysis of the leaf spring at the design load.
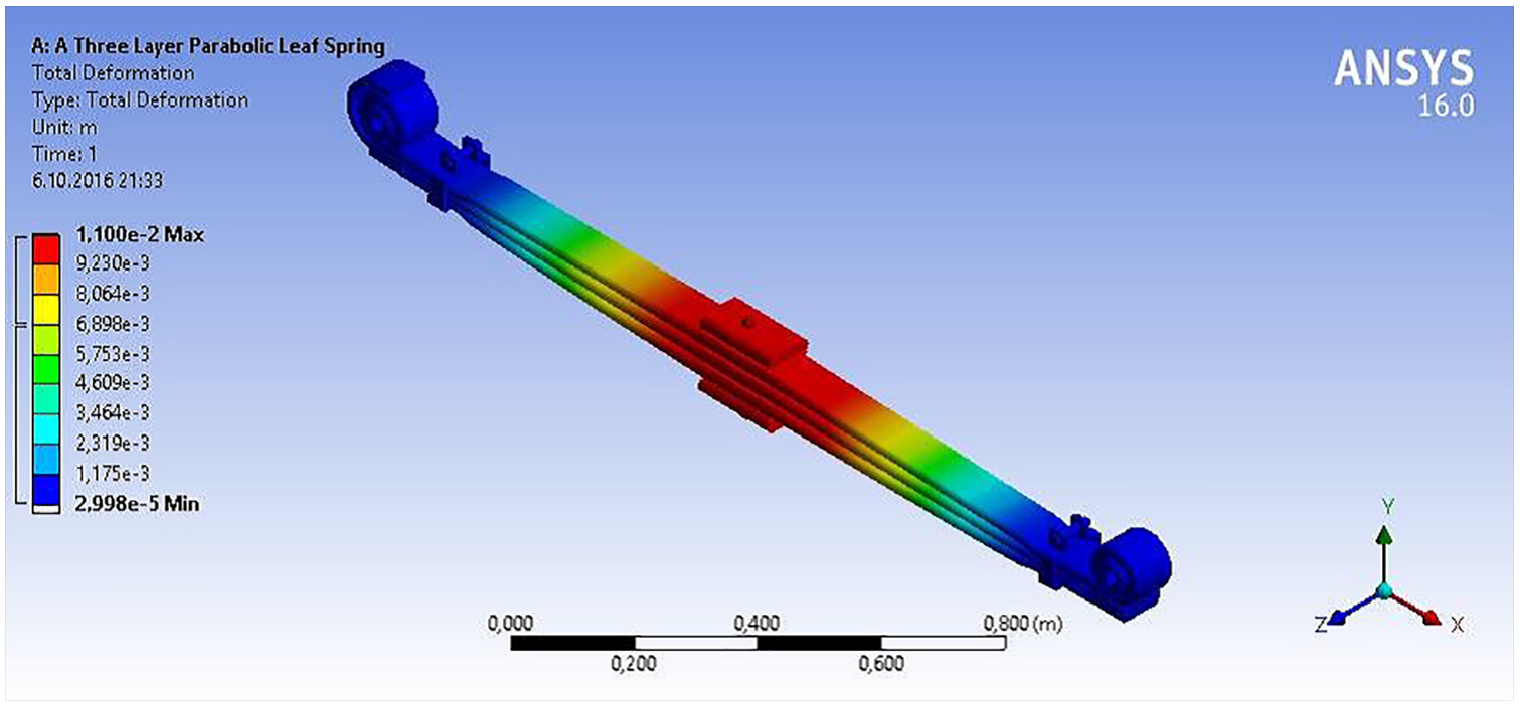
Deformation analysis of the leaf spring at the design load.
Under the design load, while the maximum stress on the spring is 468 MPa, the displacement of the spring is 110 mm.
At maximum load
The analysis results with a 7163-N design load von-Mises stress and maximum displacement are shown in Figures 9 and 10.

Stress analysis of the leaf spring at the maximum load.

Deformation analysis of the leaf spring at the maximum load.
Comparison of the methods for the design load and maximum load is shown in Table 5. Under the maximum load, while the maximum stress on the spring is 779 MPa, the displacement of the spring is 193 mm.
Comparison of the methods for the design load and maximum load.

Fatigue failure analysis
Fatigue failure models consist of the fatigue crack mechanism and fatigue life prediction model. The fatigue crack mechanism and fatigue life prediction models are described as follows.
Fatigue crack mechanism
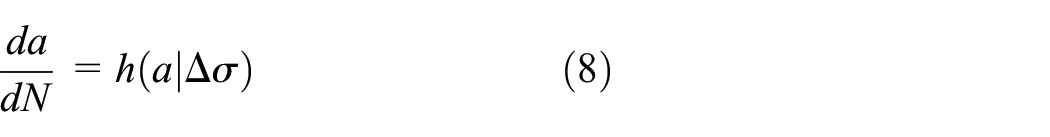
The fatigue process generally involves micro-crack evolution and macro-crack propagation. Micro-crack evolution includes micro-crack initiation and the subsequent stable growth or propagation of micro-cracks. The initiation of micro-cracks may occur directly at the initial flaws in the materials or begin with cyclic loading–induced micro-structural changes leading to permanent damage and then nucleation of the micro-cracks in the materials. 5
These micro-cracks grow with increasing number of loading cycles. Eventually, fatigue fracture occurs when a single micro-crack reaches the critical size and then propagates unstably. The generally accepted physical understanding of micro-crack growth dynamics is that the size of micro-crack (a) increases with the number of loading cycles (N) and applied load (Δσ); alternatively, the general model of the growth rate da/dN as a function of the range of stress intensively factor ΔK is given by Qian and Lei 5

where Δσ = constant, and
where

where Kmax and Kmin are the maximum and the minimum stress intensity factors, respectively.
The conventional Paris’ law for the growth behaviour of a macro-crack under cyclic loading is a power function. It describes the growth rate of a crack with instantaneous size (a) at the Nth loading cycle as a power function of the crack size 5
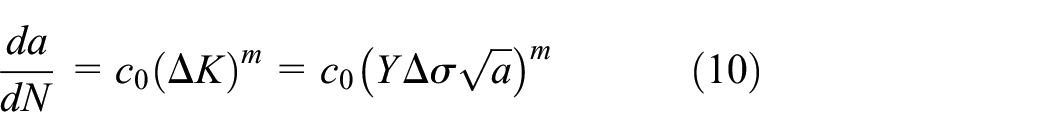
where m and c0 are material constants that are also known as Paris’s parameters.
Fatigue life prediction models
Fatigue life prediction models are classified as either deterministic or probabilistic (statistical) models. Some fatigue life prediction models are summarized as follows.
Deterministic models
The deterministic models of S-N (stress-life) curve have been empirically proposed as fatigue criteria to depict the inverse S-N correlation for a given sized specimen (V is fixed). Some deterministic S-N models adopt the stress and strain ranges (Δσ, Δε) as basic fatigue failure parameters. Some deterministic fatigue failure criteria are presented below. 5
A stress-based deterministic fatigue failure criterion was studied by Wöhler in 1870. The Wöhler fatigue failure criterion is defined as follows

where S (Δσ) is the alternating stress, N is the fatigue life given as the number of cycles to fracture, and A1 and B are constants.
In 1910, Basquin studied a stress-based deterministic fatigue failure criterion defined as follows

where S (Δσ) is the alternating stress, N is the fatigue life given as the number of cycles to fracture, and A1 and B are constants.
Another fatigue failure criterion was presented by Palmgren in 1924. The Palmgren criterion for fatigue failure is defined as follow

where S (Δσ) is the alternating stress, N is the fatigue life given as number of cycles to fracture, A1 and B are constants, and Δσth is the fatigue limit for an infinite number of cycles to fracture, that is, permanent fatigue limit.
Coffin and Manson presented a strain-based deterministic fatigue failure criterion for determining fatigue life in 1954


where Δεp/2 is the plastic strain amplitude,
Probabilistic models
The major efforts on probabilistic (or statistic) modelling of fatigue can be summarized according to the number of variables out of the three variables (S,N,V) being considered in a probabilistic model. Some probabilistic models P = F(S,N,V) are presented below. 5
A fatigue life–based probabilistic fatigue failure model was studied by Zhao and Liu in 2014. The Zhao and Liu model is defined as follows
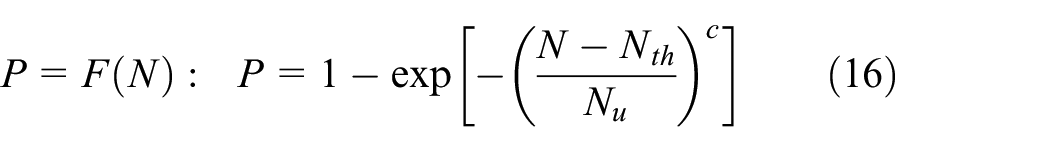
where Nu, Nth and c are functions of S = Δσ.
In 2016, Sandberg and Olsson studied a volume-based probabilistic fatigue failure model defined as follows

where V* is the stressed volume with
Castillo et al. presented a fatigue life and stress based probabilistic fatigue failure model for the determination of fatigue life in 2009

where N0, σ0 are scale parameters. A2, B, C, D and E are functions of σmin/σ0 and σmax/σ0.
Fatigue life analytical analysis
Several different testing techniques are available for the purpose of measuring the response of a material to time-varying stress and strain. The oldest approach was presented by Wöhler in 1870. The Wöhler or S-N curve shown in Figure 11 has become the standard approach for characterizing the behaviour of the materials strength under dynamic loading. 16

Wöhler (S-N) curve.
We note that the fatigue strength S falls steadily and linearly on the log-log coordinates as a function of N until reaching a knee at approximately 106 or 107 cycles. This knee defines the endurance limit

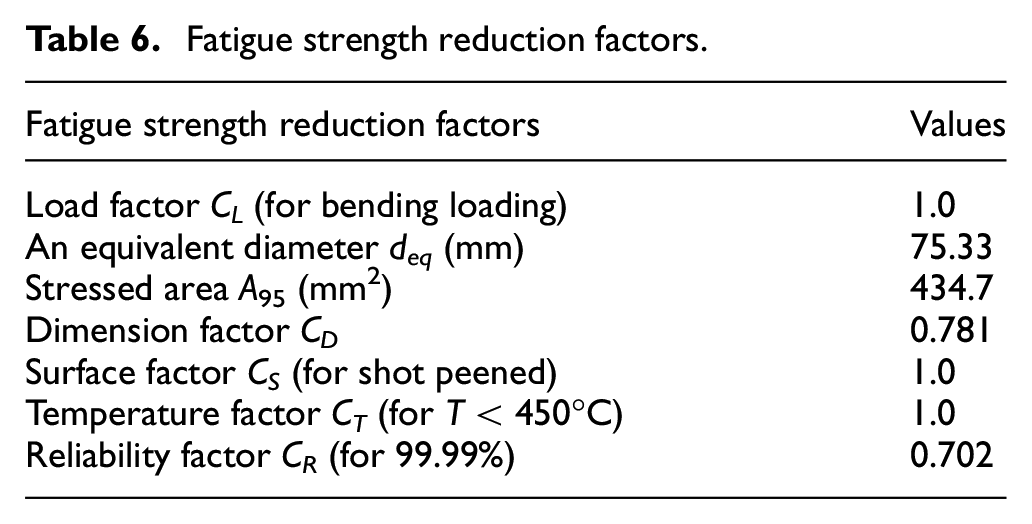
The fatigue strengths or endurance limits obtained from the standard fatigue test specimens must be modified to account for the physical differences between the test specimen and the actual part being designed. These differences are considered using a set of strength reduction factors as follows16,17

where Se is the corrected endurance limit for a material, and CL is the strength reduction load factor and varies between 1 for bending stress and 0.70 for axial loading.
CD is the strength reduction dimension factor that is determined as follows

where deq is the equivalent diameter and is calculated as

where A95 is the 95% stressed area that is calculated depending on the rectangular area dimension b and h according to

A strength reduction surface factor CS is needed to account for these differences. An exponential equation is suggested for the surface reduction factor as follows

The coefficients A and b for various finishes were suggested in the related Diagram and Table. 15
A temperature factor CT can be determined for
The estimated S-N curve can be drawn on the log-log axes as shown in Figure 11. Sm is the material strength at 103 cycles and is defined as

The corrected Se is plotted at 106 cycles, and a straight line is drawn between Sm and Se. The equation of the line from Sm to Se is the Wöhler equation expressed as5,16,17

where S = Sa is Sm alternating stress that is calculated using Sm maximum and minimum stress values as follows

The fatigue life given as the number of cycles for any alternating stress Sa (or σa) can be calculated from the above Wöhler Equation by applying two boundary conditions:

The fatigue strength reduction factors are shown in Table 6. The fatigue strength parameters and analytically calculated fatigue life results are given in Table 7.
Fatigue strength reduction factors.
Fatigue strength and fatigue life.

Manufacturing of the parabolic leaf spring
The manufacturing of the parabolic leaf spring consists of cutting, heating, forming, end-cutting, bending, heat treatments, shot peening, painting and assembly. A flow chart of the manufacturing process of the parabolic leaf spring is shown in Figure 12.

Flow chart of the manufacturing process of a parabolic leaf spring.
Material
The material of the parabolic leaf spring is the high-strength 51CrV4 spring steel. Its chemical and mechanical properties are described in Tables 8 and 9, respectively.
Chemical composition of the parabolic leaf spring material.

Mechanical properties of the parabolic leaf spring material.

The selected 51CrV4 contains 0.51% C and is classified as a medium-carbon steel. Steels are classified as low-carbon, high-carbon and medium-carbon steels. Low-carbon steels contain less than 0.25% C. High-carbon steels contain between 0.6% and 1.4% C. 18
Heat treatment
The mechanical strength of the material can be improved through heat treatments. Quenching and tempering processes were applied to the high-strength leaf spring steel.
After the quenching process, the obtained structure is a martensite structure. The martensite structure is hard and brittle. Therefore, it is necessary to reduce the hardness using heat treatments. Furthermore, the transformation from austenite to martensite give rise to a high residual stress in the hardened parts. Therefore, a tempering process is applied to the hardened steel to reduce the residual stress. 18
During the manufacturing process, the leaf springs were heated to 936°C. The bending process was performed at 955°C. During the heat treatments, the quenching and tempering processes were applied at 955°C for 30 min and at 477°C for 2 h, respectively.
Shot peening
Surface treatment methods providing an enhanced surface strength are gaining increasing importance in many fields of applications. Shot peening is a well-known mechanical surface treatment process that improves the surface strength of engineering components by creating compressive residual stresses in the specimen’s surface. 2 Therefore, a shot peening process is applied to the leaf spring surface after heat treatments.
Experimental static test
By considering the elastic behaviour of the high-strength spring steel, the stresses were approximated from the measured strains using Hooke’s Law according to Karditsas et al. 4

The vertical rig test machine applies an axial load on the leaf spring and measures the deflection and bending stress. The vertical rig test machine that was used to perform the test and the strain gauge measurements is shown in Figure 13.

Vertical fatigue test machine.
Fatigue life test
The fatigue life of a leaf spring depends upon various factors such as geometry, design, material properties, mechanical and/or heat treatment parameters and uncontrolled factors such as the effects of installation and environmental conditions. 17 The experimental testing was carried out by considering the standard values as specified by the vehicle manufacturer.
In addition to the analytical stress analysis and finite-element method stress analysis, fatigue tests of the parabolic leaf spring were performed for validation. All of the fatigue tests of the full-scale parabolic leaf springs were performed in a servo-hydraulic test rig. The actuator applied the load in the middle of the leaf springs. All of the fatigue tests were performed using a sinusoidal force signal at a constant testing frequency.
Prototypes were produced with controlled variation in the parameters that can simulate the actual manufacturing variability. A prototype of the parabolic leaf spring is shown in Figure 14.

Prototype of the parabolic leaf spring.
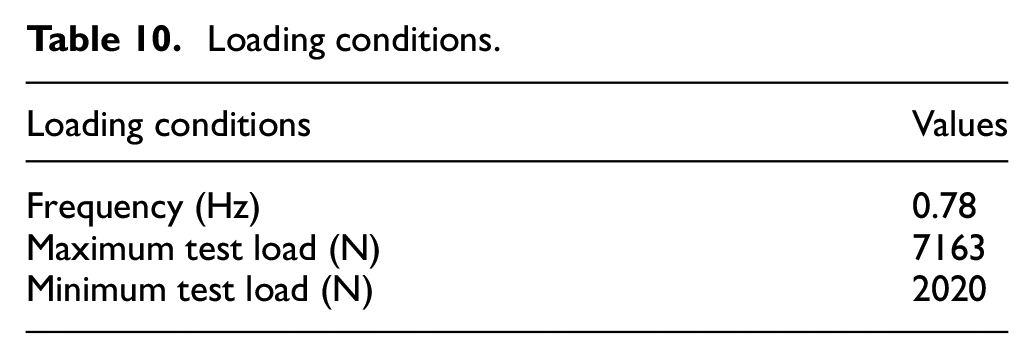
The fatigue test of parabolic leaf springs is carried out by block cycle loading with 100,000 cycles. All of the prototypes passed the required fatigue test. These tests were continued until failure occurred. The physical tests were carried out with the loading conditions specified in Table 10.
Loading conditions.
The fatigue test results are given in Table 11. Sample 6 has the shortest fatigue life with failure after 162,180 cycles.
Fatigue life of the parabolic leaf spring prototype.

The maximum stress and displacement values according to the strain gauges on the sample for the design and maximum load situations are shown in Table 12.
Maximum stress and displacement values of a prototype.

Logarithmic life cycle values.

The results of analytical modelling, finite element analysis and physical tests for the design and maximum load were compared, based on the results shown in Tables 2, 5 and 12, respectively. The comparison of the results proved that finite-element analysis is a suitable and valid method for determining the fatigue behaviour of parabolic leaf springs. The finite element results were verified with a maximum difference of 0.91%.
Investigation of spring breakage
The macroscopic investigation of the leaf spring breakage surfaces showed that fatigue cracks such as the corner crack and surface crack on the tension surfaces of the leaf spring specimens were initiated in the areas of maximum stress. The analysis of the areas of the broken surface is shown in Figure 15, and the broken surface of a parabolic leaf spring is shown in Figures 16.

Analysis areas.

Broken surfaces of a parabolic leaf spring.
One of the broken springs of the samples was used for observation. The area marked by A was used for decarburization analysis, for the area marked by B residual, microstructure and grain-size analyses were performed, and traverse analysis was performed for the area marked by C. Observation of broken surfaces revealed fatigue loops.
Hardness traverse
The distinctive decrease in the hardness near the tension and compression surface of the specimens confirmed that the surface decarburization is mainly due to the heat treatment procedure use in the production of the leaves. 2 It was observed that the hardness values on the edge were distributed uniformly in the range of 425–450 HV. The hardness traverse is shown in Figure 17.
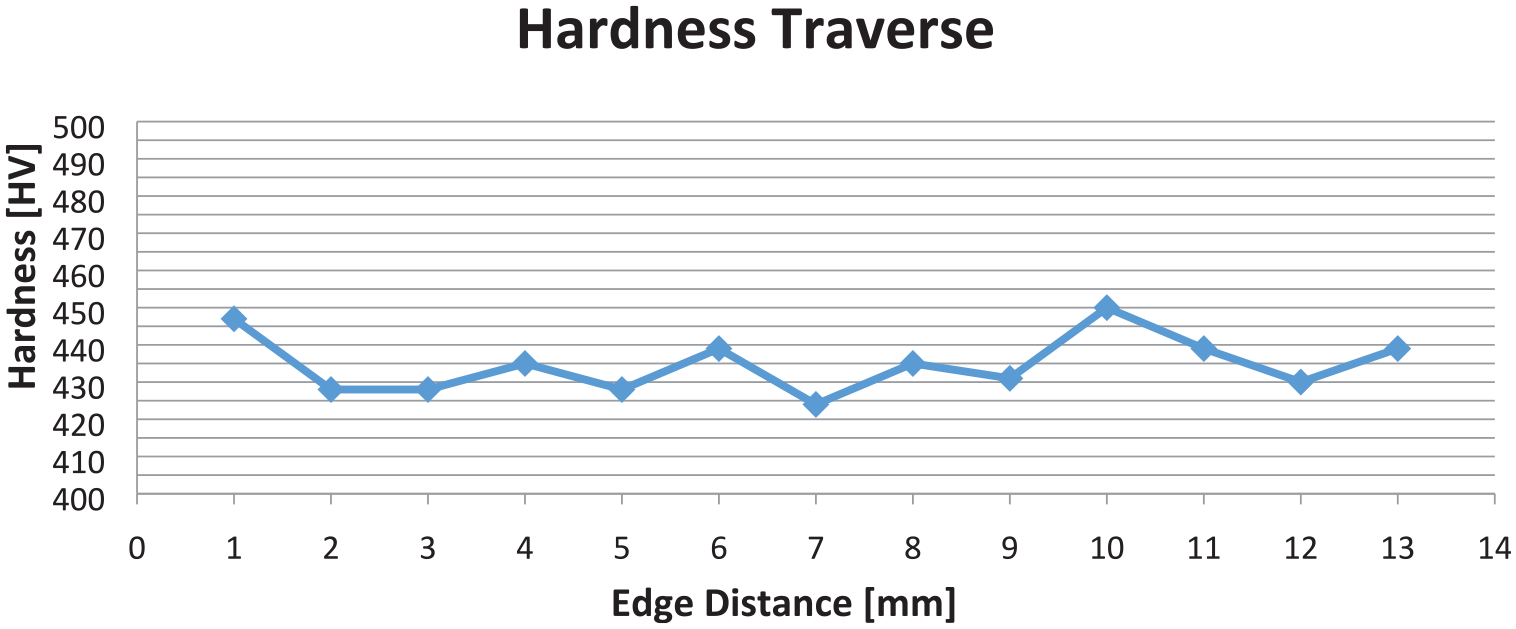
Hardness traverse.
Residual analysis
Residual types were investigated according to ASTM-E45. D-type thin and thick spherical oxide non-metallic particles and C-type thin silicate particles were found by examining the residuals. The results of residual analysis are shown in Figure 18.

Residual analysis.
Decarburisation analysis
Decarburisation of the material may reduce its initial fatigue strength. 2 The permissible maximum decarburization depth is 250 μm. The maximum depth of decarburization was 94.14 μm, and this value is acceptable. The results of decarburisation analysis are shown in Figure 19.

Decarburisation analysis.
Microstructure
The microstructure of the material fitted the expected tempered-martensite structure of the quenched and tempered 51CrV4. During the tempering process, leaf spring samples were heated to 745°. The microstructure is tempered-martensite as shown in Figure 20.

Tempered-martensite microstructure.
Grain size
The acceptable minimum grain size is 5 according to the ASTM standards. The grain size was identified as 8 according to the ASTM standards. The results for the grain size are shown in Figure 21.

Grain size.
Reliability analysis of the leaf spring
According to VDI 4001, reliability is defined as the probability that a product does not fail under given functional and environmental conditions during a defined period of time. Reliability includes the failure behaviour of a product and is therefore an important criterion for product evaluation. According to customer interviews regarding the importance of different product attributes, reliability ranks first as the most important attribute. Only cost is in some cases considered to play a more important role. However, reliability is always either the first or second most important attribute. Therefore, reliability is a highly important property for new products.19,20 For reliability analysis, some statistical terms such as the mean and standard deviation are expressed as described below.
Statistical terms
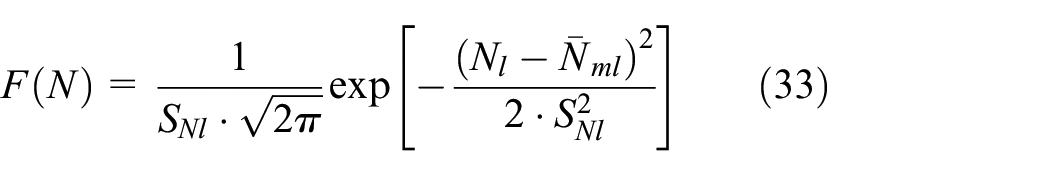
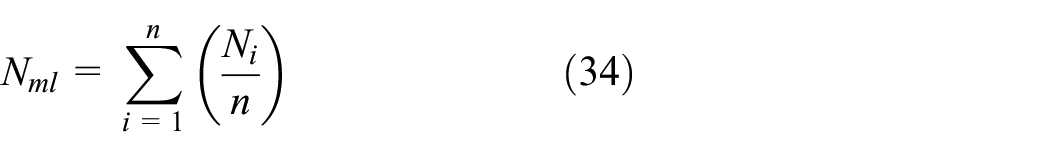
The empirical mathematical mean, commonly called the mean, is calculated for the random variables X1, X2, …, Xn as shown in Figure 2219,20


Mean value and standard deviation.
The empirical variance

The empirical standard deviation Sx is the square root of the variance shown in Figure 22. The advantages of the standard deviation in comparison to the variance is that it has the same dimension as the random variables Xi

To avoid the need for many tables for different values of Xm and Sx, the deviation from the mean is expressed in units of standard deviation by the transform

where z is called the standard variable. The integral of the transform is tabulated. The probability of failure or reliability is determined using this transformation. Positive (+) z means reliability, while negative (−) z means failure.
Logarithmic normal distribution
The logarithmic normal distribution can produce a strongly varying density function. The failure rate of a logarithmic normal distribution increases with increasing fatigue life and then decreases after reaching a maximum. The failure rate approaches zero for very low fatigue lifetimes. Thus, the monotonically increasing failure rate for fatigue failures can only be represented by the logarithmic normal distribution with restrictions. On the other hand, the logarithmic normal distribution provides a good description for failure behaviours that begin with a rapidly increasing failure rate followed by many robust and resistant components that can endure a long loading period. 19
Reliability analysis of the parabolic leaf spring was performed based on the results of 100,000-cycle tests. The logarithms of the fatigue test result values are sorted from low to high, and it is clearly seen from Figure 23 that a logarithmic distribution is applicable to the analysis.

Logarithmic life-cycle value diagram.
The failure distribution function is written as19,20
The logarithmic average of fatigue life is written as19,20
The logarithmic standard deviation of fatigue life is written as19,20

The logarithmic standard variable is written as19,20

The reliability analysis states that the parabolic leaf spring achieves its life cycle with a 99% probability rate without breaking.
Results and discussion
Static analytical analysis results
In Table 2, at the design load case, maximum stress is calculated as 457.25 MPa while maximum deformation is calculated as 106.03 mm. For the maximum load, the maximum stress is calculated as 779.83 MPa, while maximum deformation is calculated as 180.84 mm.
Static finite elements results
In Table 5, for the design load, the maximum stress is calculated as 468 MPa while maximum deformation is calculated as 110 mm. For maximum load, maximum stress is calculated as 779 MPa, while maximum deformation is calculated as 193 mm.
Experimental analysis results
As shown in Table 10, for the design load, the maximum stress is calculated as 465 MPa while maximum deformation is calculated as 109 mm. For maximum load, maximum stress is calculated as 775 MPa, while maximum deformation is calculated as 192 mm.
Fatigue life analysis results
As shown in Table 15, the analytically calculated fatigue life is 181,540 cycles while the experimentally obtained minimum fatigue life is 162,180 cycles and the experimentally obtained mean fatigue life is 176,125 cycles.
For static analytical analysis results, FEM results and experimental results are summarized in Table 14.
Maximum stress and maximum displacement values obtained by three different methods.

FEM: finite element method.
For fatigue life analysis, the analytically calculated results and experimental results are summarized in Table 15.
Comparison of fatigue life analysis results.

Comparison of these three methods, namely, the analytical method, FEM and experimental method shows that the results obtained by these methods are close to each other and these methods can be used as an alternative methods for each other. Furthermore, all of the methods are reliable for the design stage of the leaf spring.
Conclusion
A parabolic leaf spring often used in the suspension system of heavy commercial trucks was modelled and analysed using CATIA Part Design and ANSYS Workbench. The life cycles of parabolic leaf springs were determined by fatigue testing. The following conclusions are drawn:
For static maximum stress, the finite elements analysis result is 2.29% greater than the analytical model result. Furthermore, experimental analysis result is only 1.66% greater than the analytical result.
For static maximum displacement, the finite element analysis result is 6.30% greater than the analytical model result. Moreover, the experimental analysis result is only 2.72% greater than the analytical result.
For fatigue life, the analytically calculated value for the leaf spring is 10.66% greater than the minimum experimentally obtained result. Furthermore, the calculated fatigue life is 2.98% greater than the mean experimentally obtained fatigue life.
A tempered-martensite structure is obtained using the quenching and tempering process of 51CrV4 medium-carbon steel, and 51CrV4 medium-carbon steel is suitable for meeting the fatigue strength requirement of parabolic leaf springs.
The hardness on the edge was distributed uniformly in the range of 425–450 HV, and these values are acceptable hardness values.
The maximum depth of decarburization was 94.14 μm, and this value is acceptable.
The grain size was identified as 8 according to ASTM standards, and this value is acceptable.
Reliability analysis based on the fatigue test results of nine springs showed that the desired lifecycle of 100,000 cycles was obtained at a 99% probability rate without breaking, and such springs can be used safely during the service period in heavy trucks.
The reliability levels of the fatigue life of leaf spring steel satisfy leaf spring costumer requirements. Furthermore, high reliability levels are advantageous for the manufacturer both in local and international markets.
The benefits of this study for the engineering application can be summarized as follows: the closer the design of the desired product is to meeting requirements for application, the less time and reverse engineering is required in the testing phase. Thus, the product cost is reduced by reducing the design time and material loss.
Footnotes
Handling Editor: James Baldwin
Declaration of conflicting interests
The author(s) declared no potential conflicts of interest with respect to the research, authorship and/or publication of this article.
Funding
The author(s) received no financial support for the research, authorship and/or publication of this article.