
Abstract
In vehicle multi-body dynamics (MBD) modeling, the stiffness parameterization of leaf spring (LS) is an unavoidable challenge regardless of the selection of modeling methods. On the contrary, the parameterization of Coil Spring (CS) stiffness is easy to achieve by adjusting the scale factor. Therefore, a novel LS stiffness parameterization method by treating the suspension stiffness as an intermediate variable through a CS stiffness is proposed based on the virtual displacement theory. The proposed method is then implemented in the vehicle-level modeling of a commercial Van with front transverse leaf spring suspensions and rear longitudinal parabolic leaf spring suspensions. The MBD model is validated by natural frequency tests and suspension stiffness simulations. Furthermore, the vertical acceleration of the car body is also verified. Results show that the root mean square (RMS) values of body vertical acceleration in the equivalent CS model are just slightly lower than that in the LS suspensions. The applicability and capability of the proposed method are proven to address the limitation of LS stiffness parameterization in MBD modeling. It lays the groundwork for efficiently simulating the LS suspension in vehicle ride and handling design and optimization.
Keywords
Introduction
Leaf springs (LS) are crucial elastic components in the suspension system of commercial vehicles. The LS has been widely used since it can provide significant high load capacity, good reliability, and cost-effectiveness. Leaf springs used in vehicle suspension systems are primarily categorized into two types: transverse and longitudinal. The transverse leaf spring, a single-leaf spring, boasts a simple structure with excellent damping and anti-body roll performance. 1 Longitudinal leaf springs can be categorized based on quantity, with options including fewer-leaf2,3 and multi-leaf springs. 4 In vehicle design, suspension modeling is one of the most important works in vehicle dynamics. However, the LS model is more complicated than other elastic elements due to its structure complexity and interactions between leaf components. To benefit the vehicle dynamics simulation, developing an accurate, reliable, and fast LS model is the key. At present, the LS models mainly include the Finite Element (FE) model,3,5,6 the discrete beam model,7–9 and the SAE three-link model. 10
To solve the complex solving problem of the FE model, Adams/Car developed the Leaf Toolbox based on the discrete beam theory. Although the toolbox can effectively characterize the mechanical properties of LS, the vertical stiffness is still dependent on the cross-sectional area
Many scholars have done great work on the optimal matching of LS suspension stiffness. The analytical vehicle dynamics models derived by equations of motion usually use static stiffness as the LS suspension stiffness 14 alternatively. The Bouc-Wen model15,16 and the generalized Maxwell-slip damper (GMD) model 17 were used to describe the LS hysteresis characteristics caused by friction. However, those methods can describe the elastic characteristics of LS, but they are not capable of stiffness optimization. The analytical models of LS stiffness have also been studied by researchers. In such models, the LS stiffness is usually dependent on the leaf length, thickness, width, elastic modulus, tensile modulus, compressive modulus, shear modulus, etc.18–20 The analytical models are still limited in the direct parameterization of the LS stiffness, which is a unavoidable trouble in vehicle dynamics simulation and suspensions design.
In Adams/Car MBD models, the LS stiffness cannot be directly parameterized due to its complex modeling, while the coil spring (CS) allows stiffness parameterization by adjusting the scale factor. Thus, this paper proposes a novel method to parameterize the LS stiffness using CS in Adams/Car MBD models. The proposed method takes the suspension stiffness as an intermediate variable to develop an equivalent CS kinematic model based on the virtual displacement method. This is a new stiffness equivalent approach for the MBD modeling of LS. The effectiveness of the proposed method is verified through the parallel wheel travel (PWT) simulation, suspension natural frequency tests, and swept sine excitation tests. Finally, vehicle models with whole suspensions are established to compare the RMS values of the vehicle body vertical acceleration on an A-class road to further verify the applicability of the proposed method. This method resolves the issue of LS stiffness parameterization in the MBD modeling. It contributes to the ride and handling analysis of vehicles with LS suspensions. The rest of the paper consists as follows: suspension description, equivalent model of LS vertical stiffness, multibody dynamic model, road excitation, model verification, model discussions, and conclusion.
Suspensions description
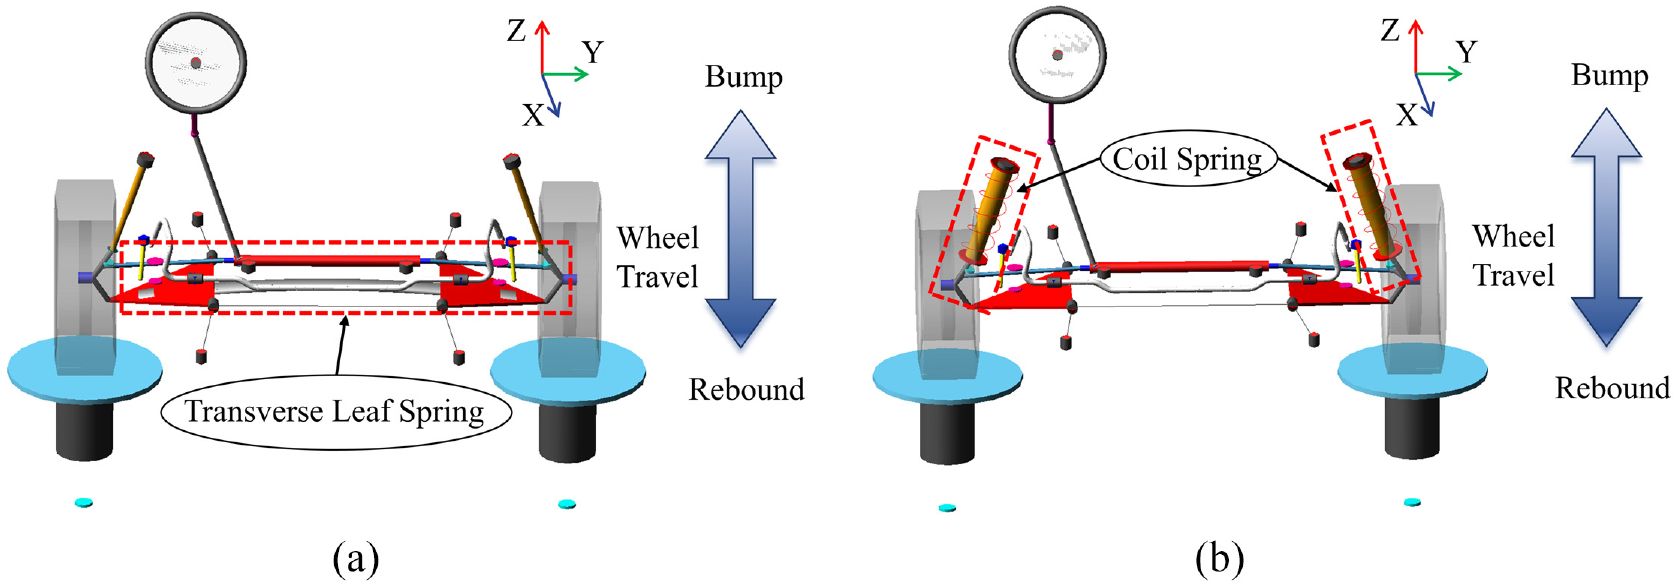
The LS suspensions in this study belong to a light commercial van, which uses the transverse leaf spring (TLS) suspension and the LPLS suspension respectively. The TLS acts as the elastic element of the front suspension, as shown in the green part of Figure 1(a). The middle part of the TLS is installed on the subframe with the upper and lower rubber gasket. The end of the TLS is installed on the lower control arm by the LS end mount. The rear LPLS suspension is shown in Figure 1(b). The end of the LPLS is fixed on the body by rubber bushing and shackle. The middle of the LPLS is fixed on the rear axle by the U bolt.

Typical Van commercial vehicle suspensions: (a) front TLS suspension and (b) rear LPLS suspension.
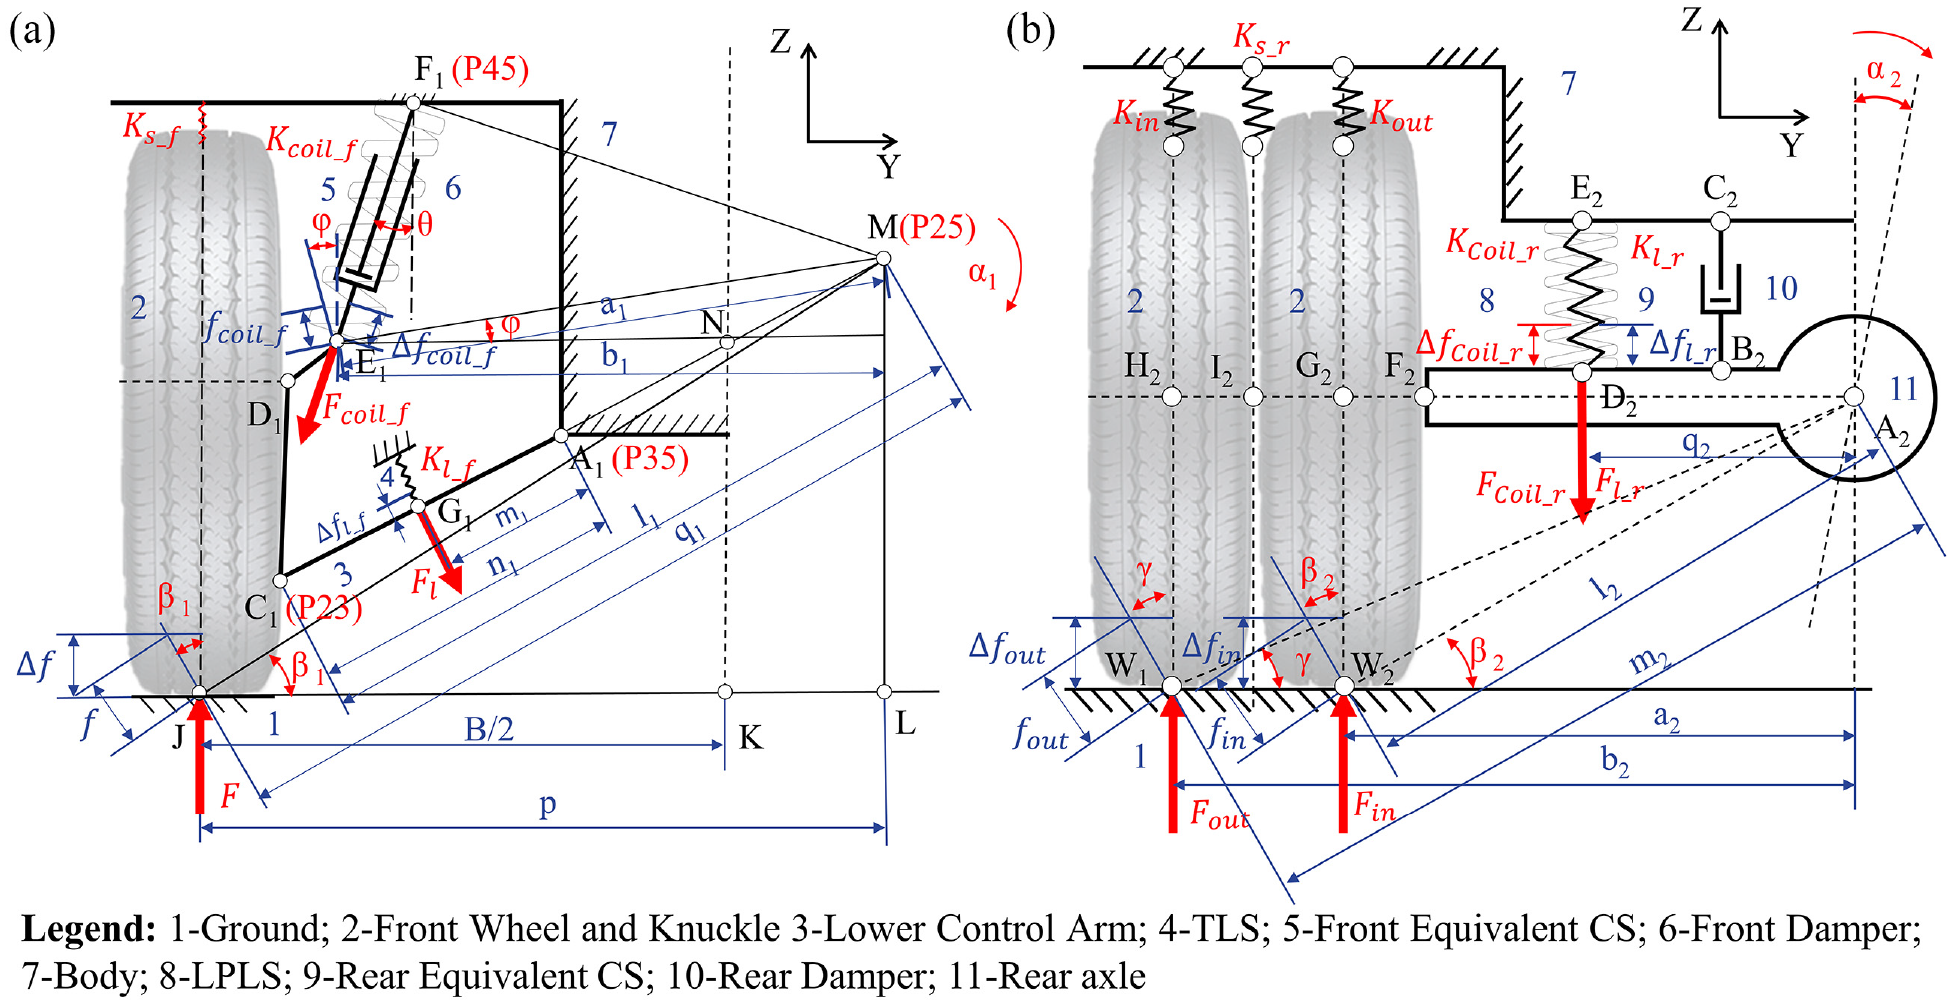
Ignoring the anti-roll bar and the tie rod, the partially simplified diagram of the front TLS suspension is shown in Figure 2(a). A1 and B1 are the endpoints of the lower control arm. C1 is the outer point of the lower control arm. The lower control arm

Simplified Schematic of LS suspension: (a) TLS suspension and (b) LPLS suspension.
Figure 2(b) shows the partially simplified model of the rear LPLS suspension without the anti-roll bar. Since the rear LPLS suspension is non-independent, only half of the rear axle model is shown here. A2 is the midpoint of the rear differential and the roll center of the rear LPLS suspension. B2 and C2 are the installation position of the damper between the rear axle and the body. D2 is the middle position of the U-bolt. E2 is the installation position of the front and rear leaf eyes of the LPLS. F2 is the connection position between the axle and the rear inner wheel hub. G2 and H2 are the middle points of the inside and outside wheel centers.
Equivalent model of LS vertical stiffness
Since the LS stiffness cannot be parameterized during the vehicle ride comfort simulation, a method of equivalently replacing the LS with a CS whose stiffness can be parameterized in Adams is proposed to solve the LS optimal stiffness. For the TLS suspension, the CS is mounted on both ends of the damper to equate the TLS stiffness, as shown in Figure 3(a). For the LPLS suspension, the LPLS is replaced by an equivalent CS, where the installation position is consistent with that in LPLS, as shown in Figure 3(b). In this paper, we introduce the suspension stiffness
The kinematic model of equivalent CS suspensions: (a) the CS equivalent model for TLS suspension and (b) the CS equivalent model for LPLS suspension.
The symbol definitions of the equivalent CS suspensions.

In Figure 3(a), force
For the equivalent model in Figure 3, there are relationships as follows:

where

where

Combining equations (1) and (3), the relationship between

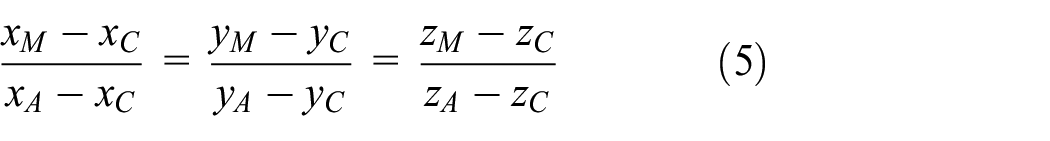
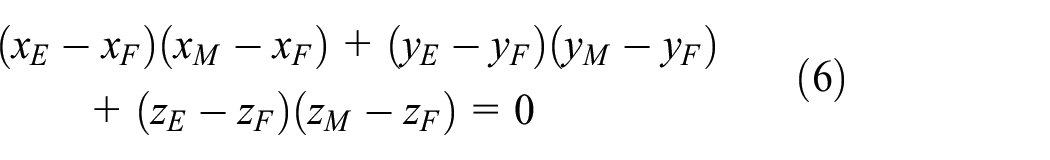
The lengths of l, q, and p depend on the coordinate of the instantaneous center (point M). The coordinates of the M point are obtained through the line equation (5) of straight line MC1 and the plane equation (6), which is a plane passing through the F1 point and perpendicular to the straight line F1E1.
So far, the relationship between

where

Therefore, the relationship between


Since the instantaneous centers M and A2 of the TLS and the LPLS suspension change dynamically during the wheel travel process, the equations (10) and (4) can only represent the instantaneous relationship of
Through the suspension PWT simulation of Adams Car, the wheel travel distance

where

As for the TLS suspension, when
The equivalent CS dynamic stiffness

The spring force of equivalent CS
where

where
The equivalent CS is brought into the suspension model for PWT simulation to obtain the wheel travel

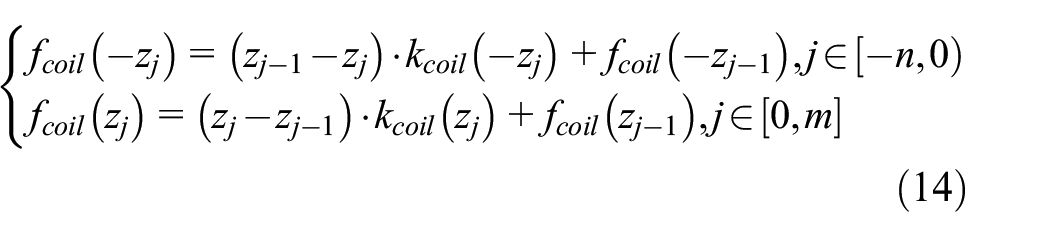
To ensure the stiffness consistency of the CM suspension and the TLS suspension, the CS stiffness

Through equations (14)–(17), the displacement
In summary, the conversion relationship between the LS suspension stiffness

Flow chart of equivalent LS suspension with CS suspension.
Multibody dynamic model
Suspension model
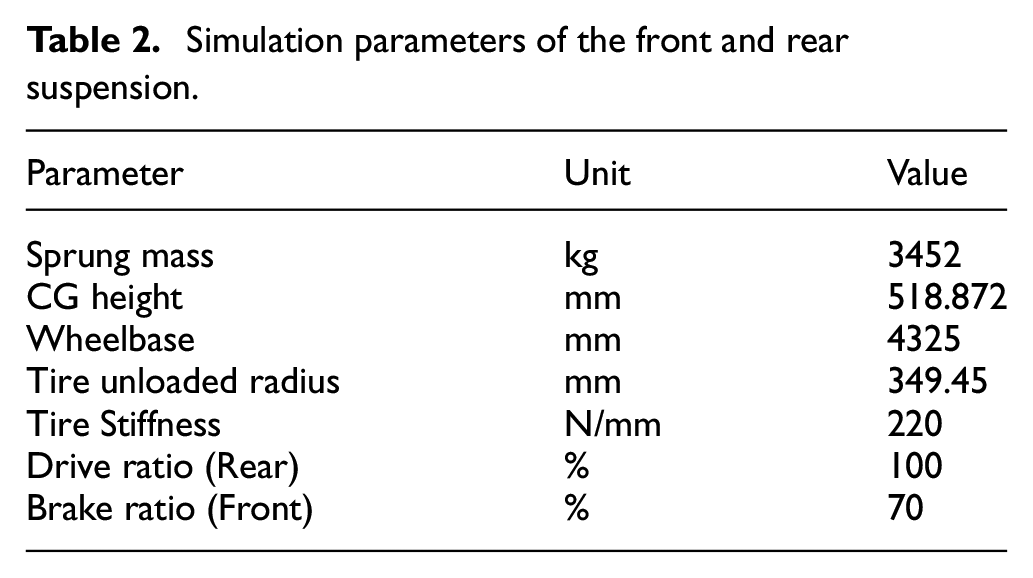
Based on the proposed kinematic model of equivalent CS suspensions in Figure 3, the front TLS suspension MBD model is replaced by an equivalent CS suspension, as shown in Figure 5(a) and (b). The rear LPLS suspension MBD model is replaced by a TLCS suspension, as shown in Figure 6(a) and (b). Since the LPLS plays a guiding rod in the rear suspension model, it is necessary to increase the guiding link in the rear equivalent CS suspension. The two-link structure plays a guiding role in the rear equivalent CS suspension. The bottom of the rear equivalent CS is fixed to the rear axle and the top is fixed to the body. The K&C PWT tests are carried out on the MBD model of the front and rear suspensions. The wheel travel of the front and rear suspensions in the simulation experiments was set to [−50, 50] mm and [−50, 100] mm, respectively, based on the travel limits of the suspension bump-stops. Table 2 shows the suspension MBD model parameters based on the supplier-provided parameters of the experimental test sample vehicle.
The MBD model of front suspension: (a) TLS suspension and (b) equivalent CS suspension.

The MBD model of rear suspension: (a) LPLS suspension and (b) equivalent TLCS suspension.
Simulation parameters of the front and rear suspension.
The TLCS suspension MBD model retains three bushings in the structure model, as shown in Figure 7(a). A, D, and E are the center points of the bushings. B and C are the center points of the U-bolt and the upper LS fixed position. F and G are the connection points of the links and the rear axle. Points I and H are the connection position of the equivalent CS with the body and rear axle.


Equivalent TLCS model: (a) geometry of TLCS suspension model and (b) topology of TLCS suspension model.
The topology of the TLCS suspension is shown in Figure 7(b). The front link AF is connected to the body by a bush at point A and connected to the rear axle by a fixed pair at point F. The rear link GD is connected to the rear axle by a rotating pair at point G and connected to the connecting link ED by a bush at point D. The connecting link DE is connected to the body by a bush at point E. The upper and lower of the CS are built as the general part. The CS upper part is fixed with the body at point I. The CS lower part is fixed with the rear axle at point H.
Vehicle model
The vehicle MBD model with LS suspensions and equivalent CS suspension is shown in Figure 8. The vehicle model is mainly composed of nine parts: front suspension, front-wheel system, rear suspension, rear-wheel system, steering system, body system, powertrain system, front arb system, and rear arb system. A virtual body is used to represent the vehicle body model. Table 3 displays the setting parameters of the vehicle MBD model, which were determined based on the test sample Catia vehicle assembly drawing and the provided sample test parameters from the supplier.

Adams MBD models with LS and CS suspensions: (a) the vehicle MBD model with LS suspensions and (b) the vehicle MBD model with equivalent CS suspensions.
Base vehicle specification parameters.

Road excitation
Road surface excitation has an important impact on vehicle ride comfort research.
21
To verify the accuracy of the MBD model, it is crucial to simulate the suspension’s natural frequency and the vehicle model. According to National Standard GB/T 4783-1984
22
, the suspension’s natural frequency is tested by the roll-off method. A virtual road that corresponds to the test road is built in Adams/Car. The brick-shape obstacle height is 90 mm and the length is 200 mm, as shown in Figure 9(a). Based on Sayers empirical model,
23
the road profile parameters are generated by Adams’s random road generator. The white noise PSD amplitude

where

Road excitation: (a) suspension frequency offset test and (b) road A-class profile.
Model validation
Since the suspension stiffness will increase suddenly after the suspension hits the rubber bump-stop, the change of the suspension stiffness is simulated by the PWT when the bump-stop is not touched, as shown in Figure 10. The limit travel of the front and rear suspensions is set at 50 mm and 100 mm respectively. The suspension stiffness maximum error of the TLS and the LPLS with its equivalent CS suspension is −3.34 and 0.13% respectively. The suspension stiffness at the initial position is listed in Table 4. When the wheel travel is 0 mm, the vertical stiffness error of equivalent front CS suspension and rear TLCS suspension is 0.41% and 0.081% respectively. The vertical stiffness of the equivalent CS suspension is the same as that of the LS suspension, as shown in Figure 10 and Table 4.
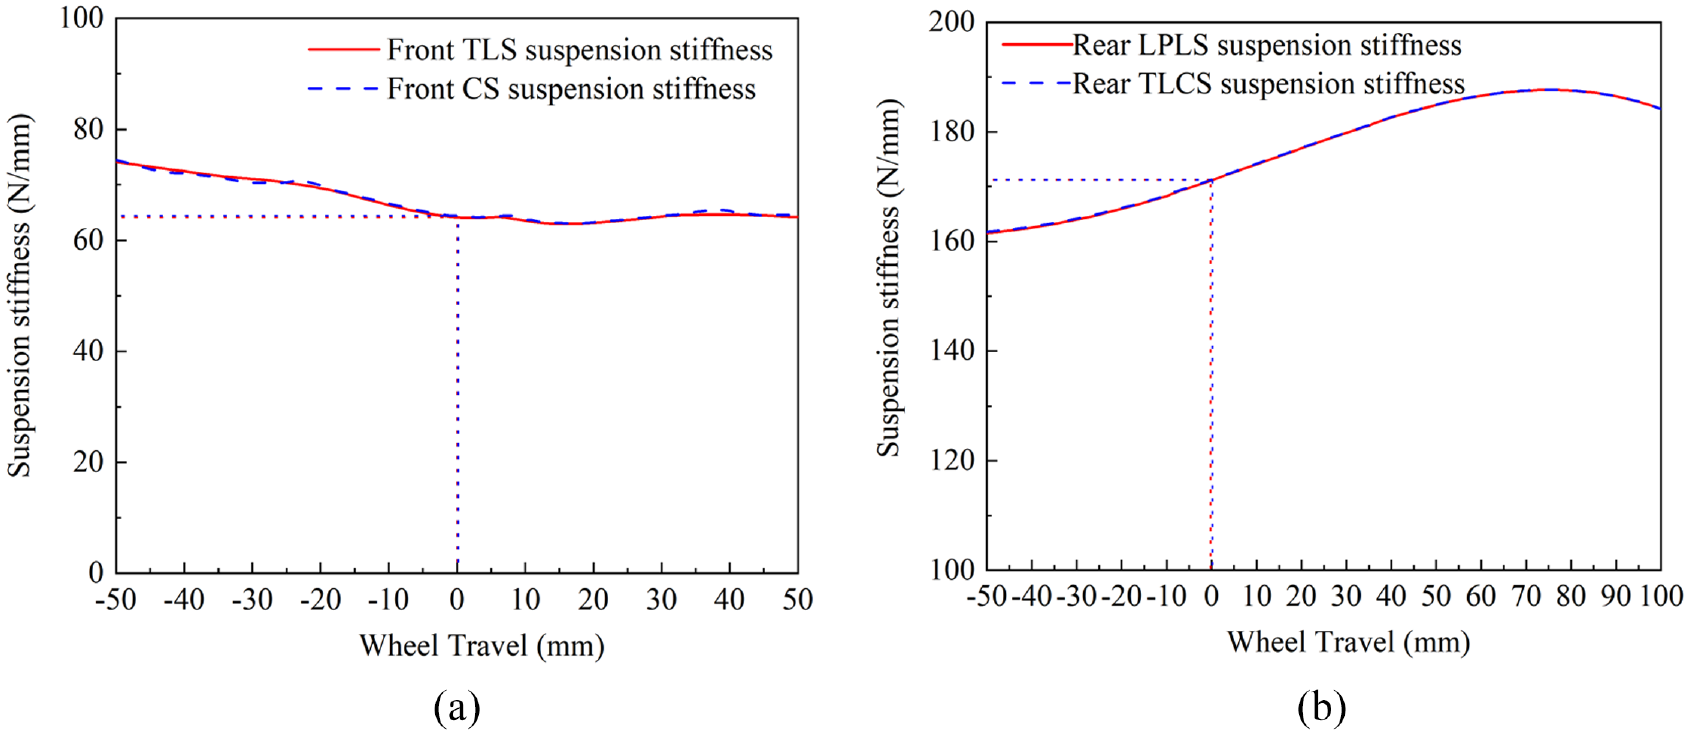
Suspension stiffness of LS and equivalent CS suspensions: (a) front suspension stiffness and (b) rear suspension stiffness.
Suspension stiffness at the initial position of suspensions.

Model discussions
Comparison of suspension natural frequency
To verify the suspension MBD model of the light Van vehicle, a natural frequency test is conducted considering the vehicle’s large mass. The test involves allowing both wheels of the front and rear suspension simultaneously allowed to freely drop from equal-height bumps while the vehicle is in an engine-off state. The choice of suspension natural frequency test for model verification offers the following advantages:
(1) Keeping the engine in a stalled state avoids the influence of engine self-excitation on the body response. This ensures that the obtained vibration responses are free vibrations, which accurately reflect the inherent characteristics of the suspension system.
(2) The vehicle free drop test ensures single and approximate pulse excitation as the test excitation, eliminating other input interferences in the vibration response of the suspension and vehicle body.
In this study, the front and rear suspensions of the vehicle were tested for their natural frequencies using the roll-off method. The vehicle’s front and rear wheels were positioned on a 90 mm brick platform, as depicted in Figure 9. Triaxial accelerometers were installed on the lower control arm and subframe of the front TLS suspension (Figure 11(a) and (b)), as well as on the axle and body of the rear LPLS suspension (Figure 11(c) and (d)).

The layout positions of the triaxial accelerometers for the suspension natural frequency test: (a) lower control arm for front TLS suspension, (b) body for front TLS suspension, (c) axle for rear LPLS suspension, and (d) body for rear LPLS suspension.
Using Siemens LMS Test.Lab software, the body acceleration time signals of the front and rear suspensions were calculated through FFT (Fast Fourier Transform), as depicted in Figure 12. The front and rear suspension natural frequency data, obtained from the suspension natural frequency test, are recorded as “LMS front TLS suspension” and “LMS rear TLS suspension,” respectively. The suspension natural frequency test shows the front and rear suspension natural frequency is 1.56 and 1.95 Hz, respectively. The simulation results validate the accuracy of the LS suspension MBD model and the proposed equivalent CS suspension model by demonstrating their agreement with the experimental data.

Natural frequency of suspensions: (a) front suspension body frequency compared and (b) rear suspension body frequency compared.
Comparison of swept sine excitation
Using sine waves with amplitudes of 5 and 10 mm and a frequency of 20 Hz as the road excitation, frequency sweep simulation experiments are carried out on the front and rear LS suspensions and equivalent coil spring suspensions, respectively. The power spectral densities of the vertical vibration acceleration of the sprung mass of the front and rear suspensions are shown in Figure 13. The body’s vertical frequency remains unchanged after using the equivalent CS. However, the vibration amplitude is reduced. To verify the suitability of the equivalent CS suspension models for vehicle ride comfort analysis, the RMS value of body vertical acceleration on an A-class road is analyzed.

Body vertical acceleration comparison at swept sine excitation: (a) front suspension and (b) rear suspension.
RMS comparison of body vertical acceleration
The PSD of the vehicle body’s vertical acceleration is compared between the LS suspension vehicle and the equivalent CS vehicle driving at 40 km/h on an A-class road, as shown in Figure 14(a). The natural frequency of the equivalent CS suspension is slightly lower than that of the LS suspension. Within the low-frequency range (up to 2 Hz), the vertical acceleration PSD amplitude of the equivalent CS suspension body increases, while the amplitude of other frequencies decreases. This difference is attributed to the discrete beam method used in constructing the LS suspension, which increases the unsprung mass and leads to reduced low-frequency suspension amplitude.

RMS comparison of body vertical acceleration: (a) body vertical acceleration PSD at 40 km/h and (b) RMS of body vertical acceleration.
Figure 14(b) shows the RMS values of the body center vertical acceleration for LS and CS suspensions on an A-class road at speeds ranging from 10 to 90 km/h. The maximum error for the CS suspension compared to LS suspension is −12.06% at 60 km/h, which falls within an acceptable range. The trend of the RMS values of body vertical vibration accelerations is consistent between the two suspensions. Hence, the equivalent CS suspension effectively reflects the ride comfort of the LS suspension vehicle, providing a basis for parameterizing suspension stiffness in vehicle ride comfort optimization.
Conclusion
This paper proposes an equivalent CS suspension method to parameterize LS stiffness using suspension stiffness as an intermediate variable, addressing the non-parameterization issue of LS stiffness in vehicle MBD models. TLS and LPLS suspensions of a Van vehicle are used to establish suspension and vehicle MBD models. Suspension PWT simulation shows that the vertical stiffness error between the equivalent CS and LS suspension is below 0.5% at the initial wheel travel position. Within the maximum travel of the bump-stop, the vertical stiffness error between the equivalent CS suspension and LS suspension is within 4%.
Suspension natural frequency testing showed that the LS suspension and equivalent CS suspension had the same natural frequencies as the experimental values. The equivalent method preserves the suspension’s natural frequency. However, near the suspension’s natural frequency, the body’s vertical acceleration amplitude of the equivalent CS suspension is slightly higher than that of the LS suspension. In other frequency bands, the body’s vertical acceleration amplitude of the equivalent CS suspension is lower than that of the LS suspension. The suspension sweep frequency sine excitation test confirmed the CS equivalent method maintains the body’s vertical frequency while reducing the PSD amplitude of the body’s vertical acceleration, consistent with the suspension’s natural frequency test.
The simulation on the A-class road shows that the RMS of the body vertical acceleration with the equivalent CS suspension matches the trend of the LS suspension. In the low-frequency band (<2 Hz), the PSD amplitude of the equivalent CS suspension’s vertical acceleration is higher than the LS suspension, but lower in other frequency bands. This aligns with the frequency sweep test and is due to the discrete beam modeling of the LS, which includes its mass. These experiments confirm the suitability of the proposed CS parameterization method for studying vehicle ride comfort. It provides a foundation for efficiently matching suspension stiffness in vehicles with LS suspension.
Footnotes
Handling Editor: Chenhui Liang
Declaration of conflicting interests
The author(s) declared no potential conflicts of interest with respect to the research, authorship, and/or publication of this article.
Funding
The author(s) disclosed receipt of the following financial support for the research, authorship, and/or publication of this article: The authors gratefully acknowledge Project 51705357 supported by the National Natural Science Foundation of China, Project 18JCYBJC20000 supported by the Natural Science Foundation of Tianjin and Project 2021T140519 supported by the China Postdoctoral Science Foundation.