
Abstract
Adaptive sparsest narrow-band decomposition is the most sparse solution to search for signals in the over-complete dictionary library containing intrinsic mode functions, which transform the signal decomposition into an optimization problem, but the calculation accuracy must be improved in the case of strong noise interference. Therefore, in combination with the algorithm of the complementary ensemble empirical mode decomposition, a new method of the complementary ensemble adaptive sparsest narrow-band decomposition is obtained. In the complementary ensemble adaptive sparsest narrow-band decomposition, the white noise opposite to the paired symbol is added to the target signal to reduce the reconstruction error and realize the adaptive decomposition of the signal in the process of optimizing the filter parameters. The analysis results of the simulation and experimental data show this method is superior to complementary ensemble empirical mode decomposition and adaptive sparsest narrow-band decomposition in inhibiting the mode confusion, endpoint effect, improving the component orthogonality and accuracy, and effectively identifying the gears fault types.
Keywords
Introduction
With the progress of time, in the field of mechanical fault diagnosis, the analysis and processing of a vibrational signal is always a hot spot.1,2 In recent years, many fault diagnosis methods have emerged in the field of fault diagnosis, such as the sparse decomposition method and empirical mode decomposition (EMD) method, which are widely used in the analysis of mechanical vibration signals.3–11
Recently, a new method was proposed by YF Peng and JS Chen, which is called the adaptive sparsest narrow-band decomposition (ASNBD) method.12–14 The ASNBD method is based on the idea of the sparse method and adaptive and sparsest time-frequency analysis (ASTFA) method, and combined with a filter. The main idea of ASTFA is searching for the sparsest decomposition over a highly redundant dictionary, which consists of intrinsic mode functions (IMF). However, the ASTFA method is less adaptive in handling mode confusion; so for this problem, the ASNBD proposed a fast algorithm based on filter parameter optimization, which uses different approaches from those proposed by TY Hou and ZQ Shi 10 to simplify the calculation. First, by establishing an optimal filter, one obtains the parameters of the filter by solving nonlinear problems. Then, the adjustable differential operator is used as the objective function to constrain each component to the local narrow-band signal. Finally, an inherent narrow-band component (INBC) is obtained by filtering the signal through an optimized filter. This method is called the adaptive sparse narrow-band decomposition (ASNBD) method.
When a mechanical equipment failure occurs, the vibration signal is mostly a multi-component amplitude frequency modulation signal such as a rolling bearing vibration signal. The decomposition by the ASNBD method is actually a demodulation of vibration signals, which can effectively extract the characteristics of the mechanical fault vibration signals. In addition, the rolling bearing vibration signal is a demodulated resonance. To satisfy the need for narrow-band filtering, the traditional methods must set up filter parameters, and the ASNBD method adaptively decomposes the signal into various local narrow-band signals, the sum of which provides the adaptive filter tool. Thus, the method is very suitable for the mechanical fault vibration signal analysis and processing. However, some deficiencies remain in ASNBD. When the frequency of noise is low, the decomposition ability of noise is not good. Thus, based on the optimized complementary ensemble empirical mode decomposition (CEEMD) method under EMD, the complementary ensemble (CE) method was adopted to optimize ASNBD.
The CE method is derived from CEEMD, which is an improvement of the EMD method. It adds positive and negative pairs of white noise to the original EMD method and performs set averaging, which avoids the scale mixing problem and significantly reduces the phenomenon of mode aliasing. However, the introduction of the CE method into the ASNBD method can effectively counter the low-frequency noise to optimize ASNBD method. The accuracy of the new CE-ASNBD was improved compared to the original ASNBD method. In the field of mechanical failure, the measurement results of gear signal during high-speed operation are often interfered by weak noise signal. CE-ASNBD diagnosis can effectively remove fine noise interference and accurately decompose effective fault components.
ASNBD method
Definition of the intrinsic narrow-band component
A signal that can be interpreted as
The components that satisfy the definition of a narrow-band signal are called intrinsic narrow-band components (INBCs).
Definition of the singular local linear operator
Linear operator T is a local linear operator if there exists a neighbour

where

ASNBD method
In the ASNBD method, the signal is decomposed by searching for the optimal sparse decomposition. 12 The iterative process of ASNBD is as follows:
1. Set
2. Solve the nonlinear unconstrained optimization problem

where T is the differential operator defined in the equation. Minimizing
3. Set
4. If
CE-ASNBD
CE
The CE method comes from the CEEMD algorithm, which adds auxiliary white noise to the original signal in the form of positive and negative pairs.15–17 Compared with the CEEMD method, after the addition of a single white noise, a new subtle noise which is not completely decomposed by a single white noise will appear in the decomposed result, and the subtle noise caused by the addition of new white noise can be eliminated as far as possible after the addition of a pair and the overall average. The process is as follows.
First, the intensity of auxiliary white noise is set. The standard deviation function std (s) is used to calculate the standard deviation of the original signal s by MATLAB so that the original signal can be divided by the standard deviation function to obtain a new function sstd. Then, the random function randn is introduced

To make
Then, white noise of a fixed intensity is added to the original signal, and the EMD decomposition is performed to obtain an IMF component. Then, N groups of different white noises are added to decompose the corresponding times, and the obtained component is generally average

In the formula, IMF is the first-order component, N is the number of times that different white noises are added,
CE-ASNBD
The ASNBD method has many advantages in signal processing, but it also has disadvantages. For low-frequency noises, the decomposition effect is relatively poor. Therefore, this article was inspired by the CEEMD method after the ensemble empirical mode decomposition (EEMD) optimization, and the ASNBD was optimized by the CE method to improve the accuracy. The iterative process of the algorithm is as follows:
In the original signal, add N groups of fixed intensity symbols opposite to white noise N and obtain a series of signals as follows

Decompose the signal into solving optimization problem P3


where
Calculate the residual of the first-order INBC component

If
The flowchart of CE-ASNBD is shown in Figure 1. In step 2, all data points in the original signal must be optimized. To reduce the large amount of calculation of data points, the calculation and optimization of data points can be transformed into the calculation and optimization of parameter vectors
Calculate the fast Fourier transformation (FFT) of
Design a filter

Solve the following nonlinear unconstrained optimization problem

Obtain the optimal parameter

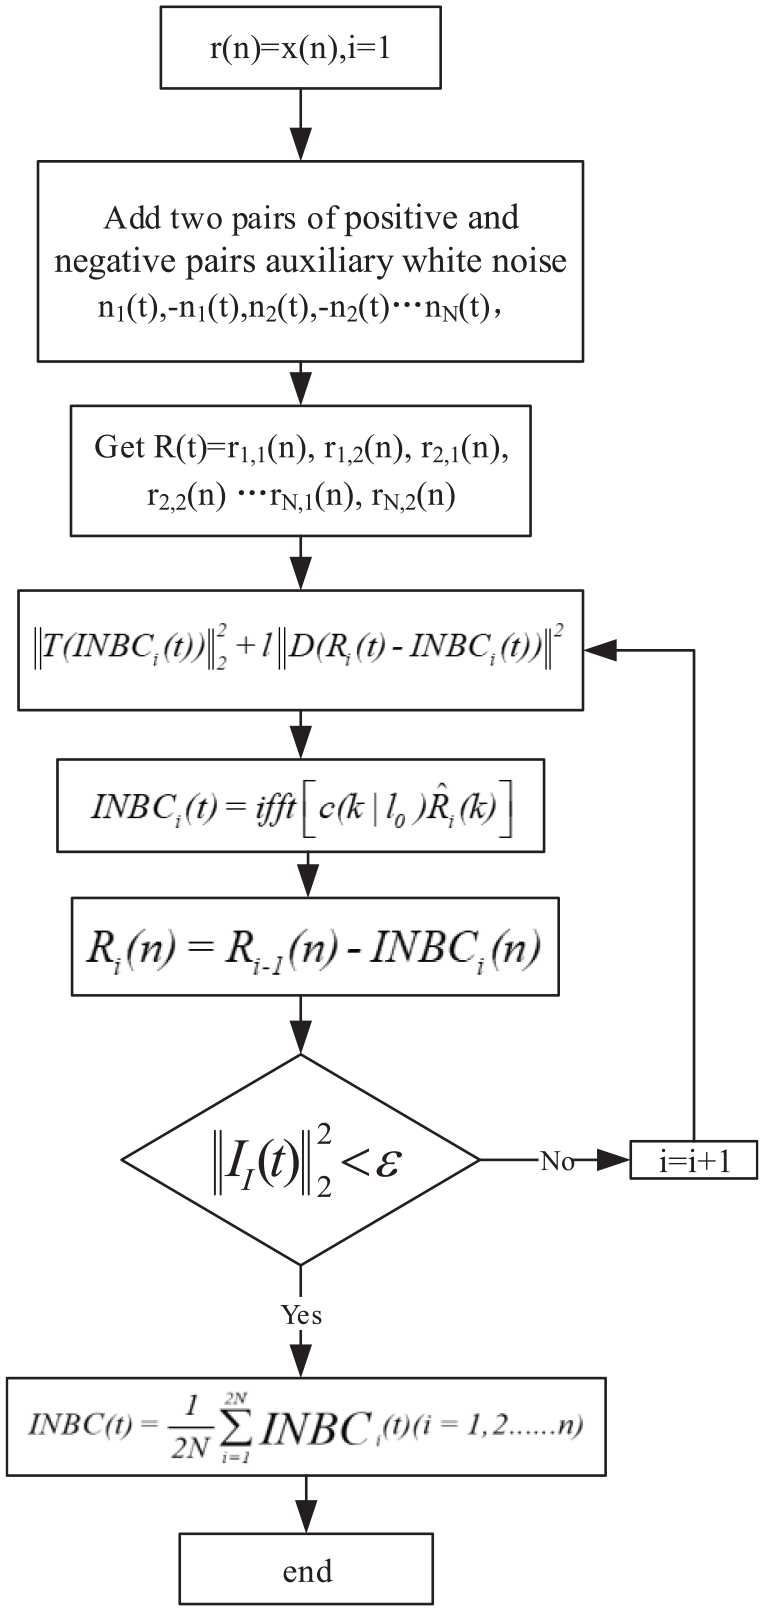
The flowchart of CE-ASNBD.
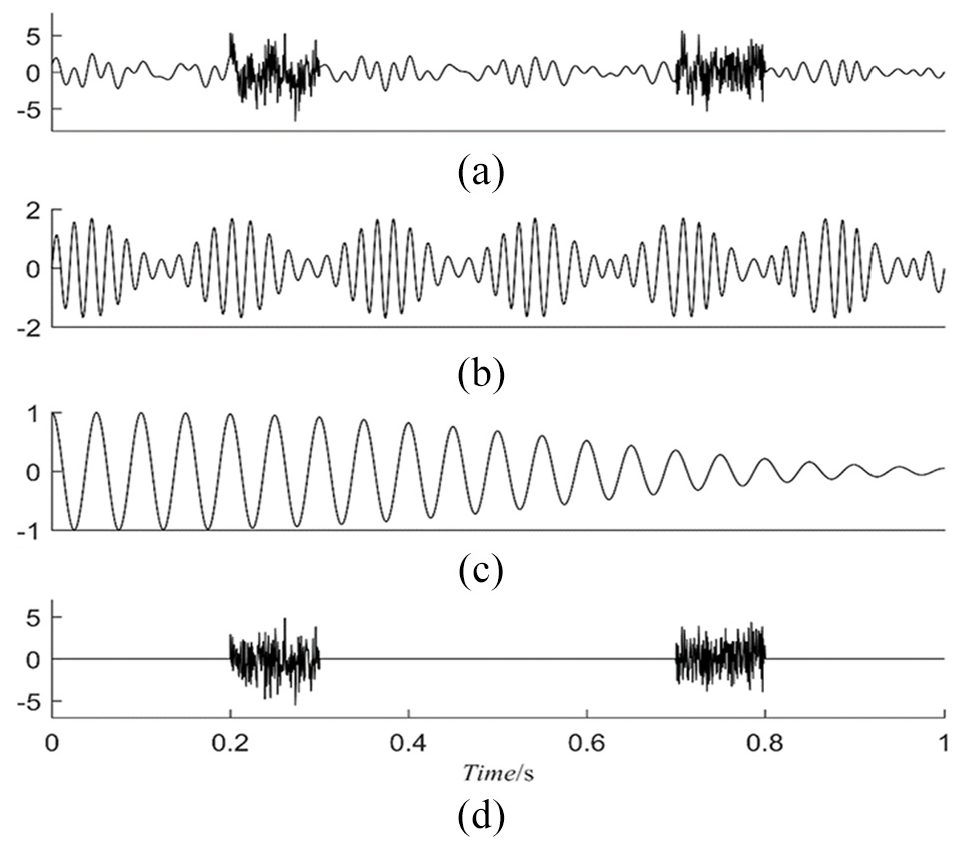
(a–d) Time-domain waveforms of
Like the CEEMD method, the CE-ASNBD method adds auxiliary white noise to the original signal in the form of positive and negative pairs using the zero mean value of the added white noise and uses multiple cycles to calculate the mean value to make the noise in the signal cancel each other. Compared with the original ASNBD method, CE-ASNBD improves the accuracy of the signal even for low-frequency noises. The flowchart of A is shown in Figure 1.
Simulation comparative analysis
To verify the advantages and disadvantages of the CE-ASNBD, ASNBD and CEEMD methods, simulation signals were used for the preliminary verification. Without loss of generality, we use a mixed signal to verify the three methods. The expression of the simulation signal is as follows

The time-domain waveforms of

CE-ASNBD decomposition results: (a) INBC1 component, (b) INBC2 component and (c) residue.

ASNBD decomposition results: (a) INBC1 component, (b) INBC2 component and (c) residue.

CEEMD decomposition results: (a) IMF1 component, (b) IMF2 component and (c) residue.
The INBC components decomposed by CE-ASNBD are highly consistent with the original value, and the INBC components decomposed by ASNBD have a small error compared with the real value, while the IMF components decomposed by CEEMD have significant mixed modes compared with the real value and a huge error.
To more intuitively compare the effects of the three methods, this article uses two methods to verify the practicability of the CE-ASNBD, ASNBD and CEEMD methods.
First, the Hilbert transform was used to calculate the instantaneous amplitude and frequency (IA and IF) of CE-ASNBD, ASNBD and CEEMD for comparison, 16 and the INBC and IMF components generated by each method in Figures 3–5 were transformed and calculated. For convenience, the instantaneous amplitude is named IA, and the instantaneous frequency is named IF. The results are shown in Figure 6, where the true value is the black curve, CE-ASNBD is the blue curve, ASNBD is the red curve and CEEMD is the green curve. In the IA and IF diagrams, CEEMD has obvious fluctuations and errors compared with the real value, while CE-ASNBD has the smallest error among the three methods.
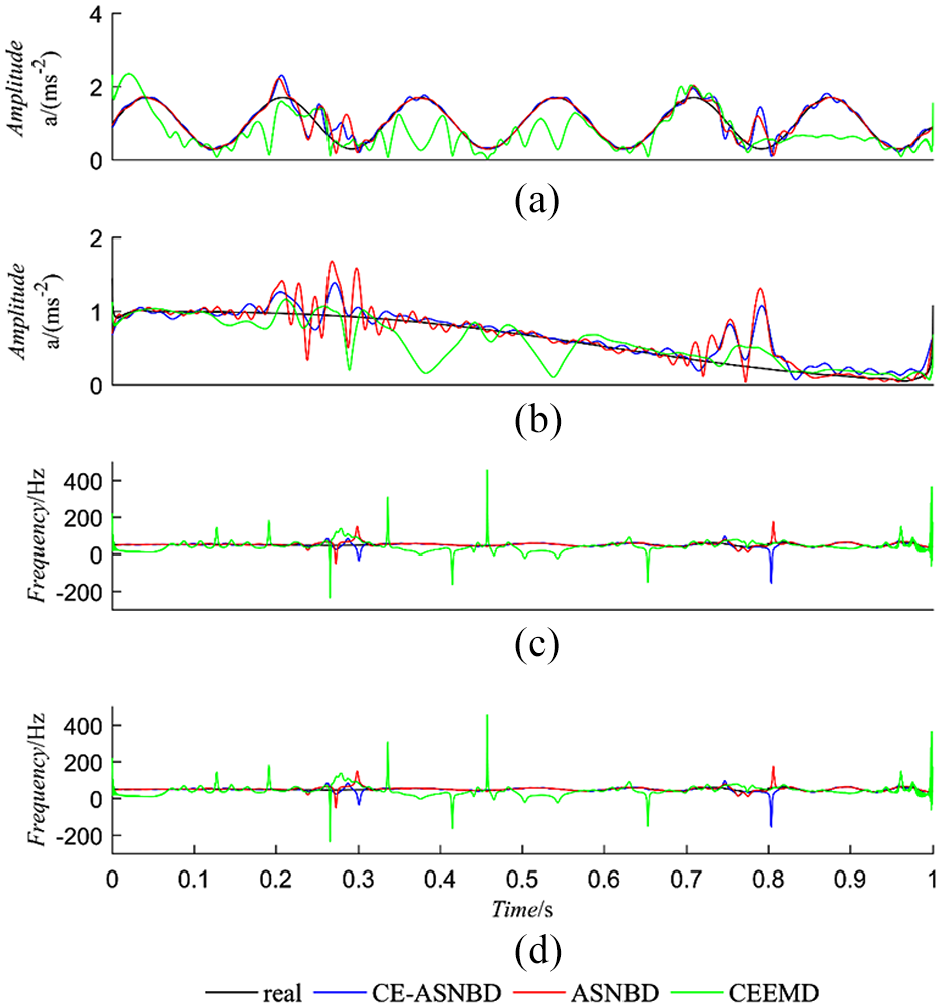
(a, b) IA graph of the two signals; (c, d) IF graph of the two signals. The black line is the original signal diagram and the other colour lines are components of each decomposition – blue: INBC component of the CE-ASNBD decomposition; red: component of the ASNBD decomposition; and green: component of the CEEMD decomposition.
The second comparison is in terms of the energy parameters
The component parameters generated by CE-ASNBD, ASNBD and CEEMD methods for the decomposition of the original signal were evaluated.

CE-ASNBD: complementary ensemble adaptive sparsest narrow-band decomposition; ASNBD: adaptive sparsest narrow-band decomposition; CEEMD: complementary ensemble empirical mode decomposition.
The results of the two comparisons can prove that the CE-ASNBD method has better decomposition effect than the original two methods, but there are obvious modal confusion and other problems in the CEEMD decomposition process. Although there is no obvious modal confusion problem in the ASNBD method, it is less accurate than the optimized CE-ASNBD method.
To further verify the noise resistance of the CE-ASNBD method, this article adds three white Gaussian noises with different signal-to-noise ratios of −3, 0, and 3. The original ASNBD method is compared with the CE-ASNBD method.
The results of CE-ASNBD and ASNBD in the first signal are shown in Figure 7, and the results of the second signal are shown in Figure 8. The results are compared in terms of the energy parameters and correlation coefficient, as shown in Table 2. Table 2 shows that the ASNBD method is obviously inferior to the CE-ASNBD method for each index in the comparison of Gaussian white noise with three signal-to-noise ratios. Thus, the CE-ASNBD method is indeed better than ASNBD method at least for the (−3, 0, 3) Gaussian white noise.

CE-ASNBD and ASNBD component decomposition diagrams for the first signal with added Gaussian white noise: (a1)–(c1) CE-ASNBD components and (a2)–(c2) ASNBD components.

CE-ASNBD and ASNBD component decomposition diagrams for the second signal with added Gaussian white noise: (a3)–(c3) CE-ASNBD components and (a4)–(c4) ASNBD components.
The CE-ASNBD and ASNBD component parameters of three groups of signals decomposed with Gaussian white noise were evaluated.

CE-ASNBD: complementary ensemble adaptive sparsest narrow-band decomposition; SNR: signal-to-noise ratio.
Experimental data analysis
To further verify the practical feasibility of the CE-ASNBD method, a gear vibration signal fault detection was performed. As a commonly used method for mechanical failure detection, an envelope spectrum analysis can verify the feasibility of the CE-ASNBD method. The CEEMD method and ASNBD method were also used for fault detection of gear signals.
The experimental data of a gear are offered by Hunan University. The experiment system and its schematic are shown in Figure 9. The literature review shows that in the fault diagnosis, the mechanical fault data can be divided into three types: diagnosable (Y), undiagnosable (N) and potentially diagnosable (p). By processing the data,20,21 the undiagnosable data can be converted into diagnosable data to prove the advantages of the method. Thus, we used GR435 in the database for the proof. The sampling frequency of GR435 is 1024, its rotational speed is 1200 n/min and the degree of gear failure is 10% (ratio of root crack width to root width). The failure frequency of the data can be calculated. According to the formula of gear failure frequency, the gear failure frequency

Schematic diagram of the gear testbed system.
GR435 gear data working data sheet.

First, GR435 was processed and analysed. The original signal diagram and envelope spectrum are shown in Figure 9. According to the envelope spectrum and calculation in Figure 10, only the double-fault frequency
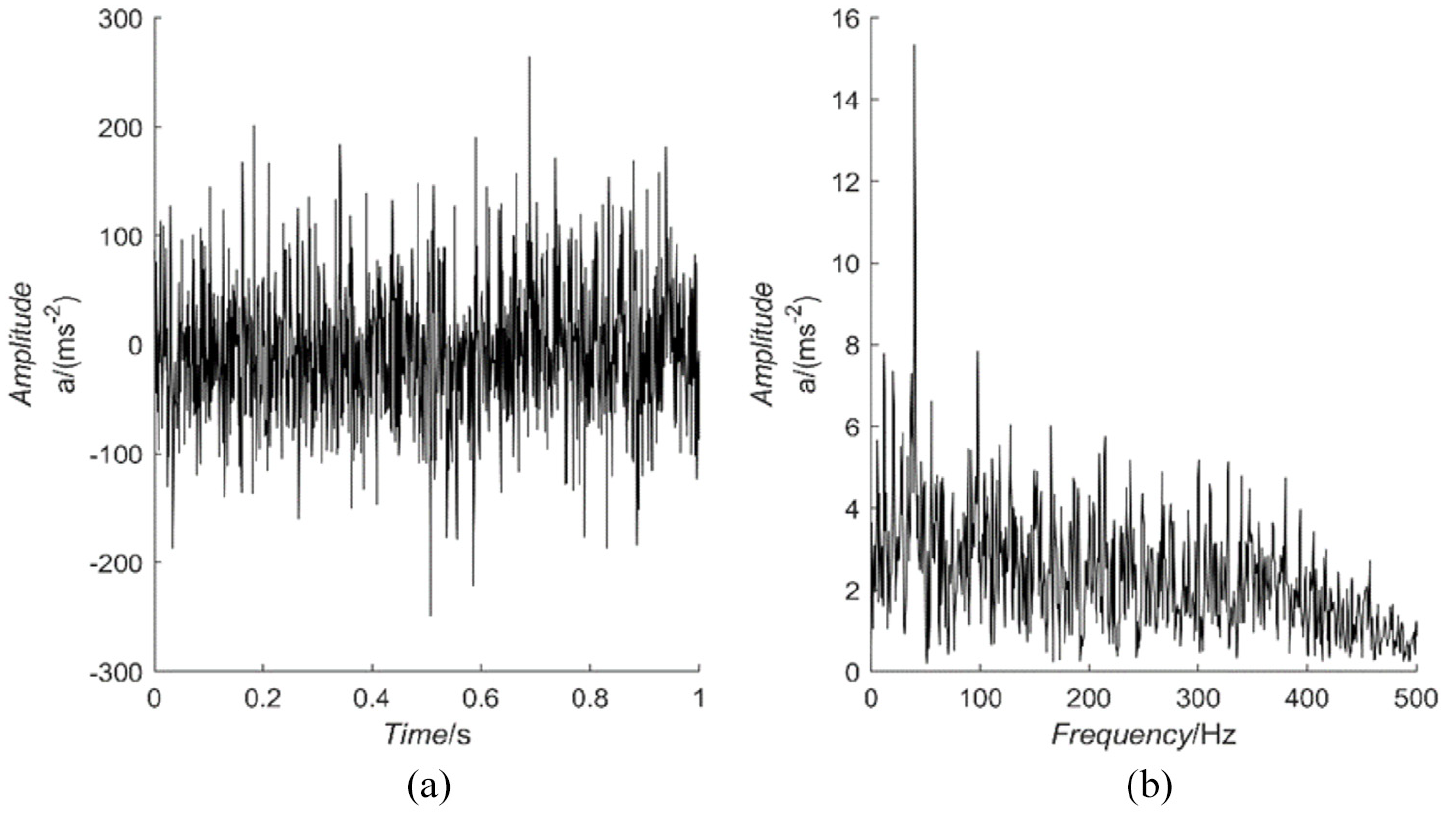
Record GR435: (a) raw time signal and (b) envelope spectrum of the raw signal.

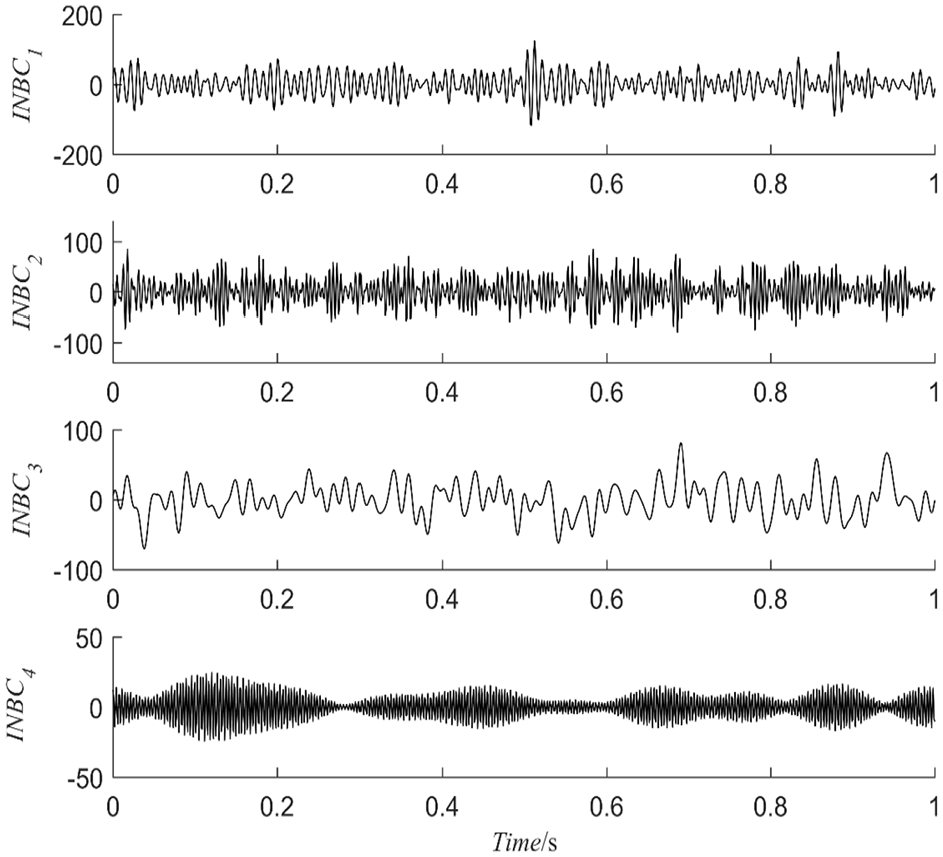
CE-ASNBD decomposition result of the gear fault signal.

Four envelope spectra of CE-ASNBD: INBC1, INBC2, INBC3 and INBC4.
ASNBD decomposition result of the gear fault signal.

Four envelope spectra of ASNBD: INBC1, INBC2, INBC3 and INBC4.
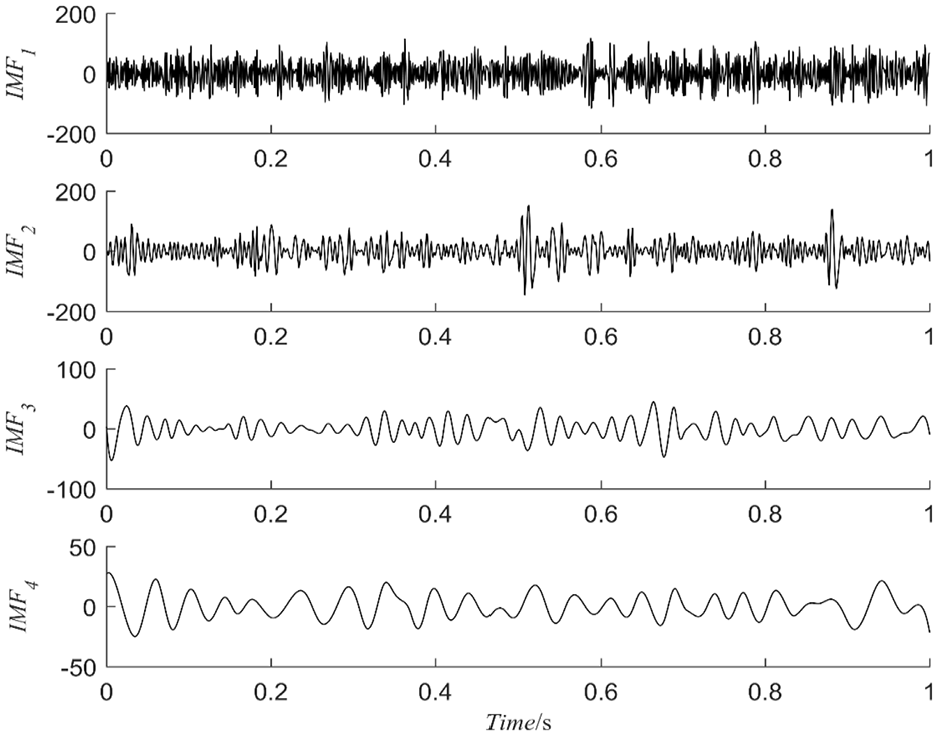
CEEMD decomposition result of the gear fault signal.

Four envelope spectra of CEEMD: IMF1, IMF2, IMF3 and IMF4.
According to the results in Figures 11–16, CE-ASNBD is superior to ASNBD in processing the non-stationary signal generated by the gear fault and can identify the gear surface crack fault that cannot be classified by the original envelope spectrum analysis method or CEEMD method.
The component diagram decomposed by the ASNBD method cannot clearly show the presence of a triple frequency, so its accuracy in the fault diagnosis of this gear signal is lower than that of the CE-ASNBD method, whereas the component diagram of the CEEMD method in this gear signal can only show a part of the fault frequency. These results indicate that the CE-ASNBD method can diagnose data that cannot be diagnosed with the original envelope spectrum or the CEEMD method.
Conclusion
Based on the ASNBD method, this article proposes the CE-ASNBD method. The CE-ASNBD method is better than the original ASNBD method in low-frequency noise resistance and adaptability. Compared with the CEEMD method, it avoids the calculation of extremum and alleviates the problems of modal mixing and end effect in CEEMD. Compared with ASNBD, the decomposition accuracy is improved by adding white noise and set average. The simulation results show that CE-ASNBD is better than ASNBD and CEEMD in terms of element accuracy, noise resistance, instantaneous amplitude and frequency accuracy. CE-ASNBD is also used to analyse the experimental signal of the gear with a tooth surface fault. The results show that CE-ASNBD is effective in mechanical gear fault diagnosis. However, among the three methods, CE-ASNBD takes the longest time to compute, followed by ASNBD, and CEEMD is the fastest. Therefore, the future research direction is to ensure the computational accuracy, improve the computational efficiency and reduce the computational time of CE-ASNBD, and we will study a rapid optimization algorithm of CE-ASNBD.
Footnotes
Handling Editor: Hui Ma
Data availability
Previously reported .mat data were used to support this study and are available at DOI: 10.1016/j.mechmachtheory. 2007.05.007. These prior studies (and data sets) are cited at relevant places within the text as references.
Declaration of conflicting interests
The author(s) declared no potential conflicts of interest with respect to the research, authorship and/or publication of this article.
Funding
The author(s) disclosed receipt of the following financial support for the research, authorship and/or publication of this article: This work was supported by the National Key Research and Development Programme of China (2018YFF0212904 and 2018YFB1308000), National Natural Science Foundation of China (51805161), Hunan Provincial Key Research and Development Programme (2018GK2044), Hunan Provincial Natural Science Foundation of China (2018JJ3187 and 2017JJ1015), and Changsha Science and Technology Programme (KQ1905019).