
Abstract
This article studies an operational problem arising at a container terminal. Klaipeda city port operations were surveilled up close and relevant remarks were made. The time efficiency of the existing container-lowering procedures using the simulation studies with a test-bed and with a real life crane operation was examined. Statistical analysis of the experimental results has showed that non-automated processes have higher time variance for the lowering process. The operations of quay crane for container handling “ship-to-shore” were analyzed, and lowering procedures time variations were determined. Each container is transported at operators own risk and with pre-defined time efficiency; therefore, it is hard to predict the optimal time for each container handling operation, thus, eventually, additional costs arise. Mathematical model was developed, which described dynamical characteristics of the container movement during lowering procedures. The lowering crane operation was modeled using known dynamic values for each separate case, and the complexity of the problem was proven. The results of modeling and experimental results show that it is possible to achieve optimal values with the existing processes.
Keywords
Introduction
Intermodal shipping containers are widely adopted in the global transport chain to deliver various goods to end-users. Despite the obvious advantages, there is still plenty of room for improvements when it comes to time efficiency and quality increase. Global transport market is a network of companies and end-users, who rely on well-managed standards and systems. Recent trends and numbers suggest that about 90% of non-bulk global trade is being managed by shipping containers worldwide.1,2 Europe alone in 2016 managed 0.8 billion tons of cargo. 3 Statistics shows that during the 10-year period between 2007 and 2017, shipping quantities increased by 66% (up to 148 million TEUs), taking into account the global merchandise trade by marine traffic. 4 Many engineers and managers worldwide foresaw such rapid increase. Yet, they could not manage it in an optimal manner. Thus, efficiency is a criterion which needs to be increased in order to adopt new challenges of the future. Cargo loading operations rely on loading and unloading speeds, safety of operation, 5 and energy consumption in the vicinity of the port. 2 These factors tend to make final decisions when adopting new and untested technologies in practice.
The modernization of container terminals through modern ICT (information and communication technology) solutions partly solves the problems concerning the “Green” terminal initiative. 2 Autonomy of operations is adopted in many areas to control stability of container handling, transportation using terminal trucks, autonomous guided vehicle (AGV), 6 and so on. Even now, newly built cranes are using operator on site to manage the loading procedures. 7 Each new operator sees the loading standards as guidelines, but not strict rules. Therefore, crane autonomy 8 is necessary, in order to increase the efficiency of adopted standards and regulations, mechanical systems, and associated port investments. An autonomous quay crane is not an innovation on its own. 9 These complex systems already exist. 10 They are applied in many areas of industry including port operations. 11 However, modernization of existing infrastructure is a priority for most companies, working with container handling. More practical and real solution is to modernize existing systems, rather than purchase all new expensive infrastructure. Overall, there are crane stabilization systems that are already in use, 12 but they mostly lack of quality feedback and operator experience that makes huge impact on the efficiency of these expensive systems. 13
In practice, the realization of complex control solutions is limited by the fluctuations of the spreader with load. Its movements are random in nature, due to external impacts, such as wind or physical contact with other objects. 14 It is difficult to predict such random deviations in practice. The most advanced European ports, such as Rotterdam or Hanover, the handling procedures and IT operations are mostly automated. However, the inclusion of the modern automated quay cranes is still an innovation for smaller ports throughout the world. In the light of the research and progress made in this area,15–19 many ports in the world lack the application of these innovations.
Increasing the time efficiency of the cargo process is a topical issue addressed in the scientific work, for which various solutions are proposed, from management algorithms to cargo planning solutions.2,6,20 The quay cranes are analyzed in the way of increasing loading time,2,21 damping the load swinging during the loading–unloading process 21 using additional feedbacks in control system with the proportional–integral–derivative (PID) or proportional–integral (PI) controllers or using artificial intelligence analysis.22,23
The problem addressed in the port is the crane and the terminal truck synchronization means. The crane operator has to wait for the terminal truck or the terminal truck has to wait for the operator to finish his unloading routine. Due to constant operator faults, there is a delay in the end-of-shipment procedures. Especially, the container loading on terminal truck is managed difficultly. Authors propose to test analyze the lowering end procedure for the future control solution. The solution would use real terminal truck and spreader sensory data. Depending on the actual position of the terminal truck or the crane, 20 decisions are made systematically to slow down the speed of movement so that the target point reached at the same time by all involved bodies. This saves both energy resources and technical resources, 6 and increases crane and, consequently, the entire port efficiency.
Mathematical modeling of container-lowering procedure by quay crane
The mathematical model of the quay crane was developed. The quay crane consists of asynchronous electrical motor, gears, shafts, drum, cables, container, and vehicle. Because the most important part was the end of container loading, the sway of container was not taken into account. The sway of container will be included in the future improved model. The structure of this model is shown in Figure 1.

The overall dynamic model of the drive.
In Figure 1,
In Figure 2(a), H is the cargo height, H1 is the distance between road surface and drum axis, H2 is the distance between road surface and vehicle platform, L is the cable length, and F12 is the contact force. In Figure 2(b),

Container loading system design diagram: (a) dynamic model of spreader and transport, and cable (b) scheme of nonlinear element.
The mechanical system in question (Figure 2) consists of an electric motor (1), gears (2–9), cable, container, and terminal truck. Main parameters of the analyzed system in Figures 1 and 2 are 500 kW power in the main motor used for lowering container, n = 995 r/min, and frequency of f = 50 Hz. The main transmission parameters are given in Table 1.
The main parameters of transmission.

The dynamics of the loading process are described in the equations below. Cargo distance from the axis of rotation of the drum H(t), cable length L(t), distance between the cargo and the terminal truck is H12(t) at any given time t is given in equation (1)

Here, h0 is the height of the cargo. The rigidity coefficient of the cable is given in equation (2)

Here,

Here,

Here, Ek, EP, and D are the kinetic energy of the drive, potential energy, and dissipative function, respectively;

Here,

Here,

where


Here,

Here,
Cargo and vehicle movement equations (13) and (14) are

Here,

Here, m2 is the vehicle mass, and
Thus, the mathematical model of quay crane was constructed and the results of container-lowering were examined for the comparison with the experimental data and giving implication of the possible lowering time reduction.
Experimental investigation
The aim of research was to test the real working conditions of the quay crane, operators work, the spreader efficiency, and unnecessary forces accumulated during container loading. 24 A simulation model was developed and tested. In recent years, researchers work closely with electrically powered terminal trucks and cranes. 25 In order to assess the need for synchronization, authors conducted experimental research in Klaipeda port. During the experimental research, the quay crane carried out loading operations, during which the data were collected. The practical experiment collected data from 204 real cycles of the loading process from ship to the quay and back again. MK2 data logger hardware was used for these experimental measurements (see Figure 3).

DL1-MK2 data logger (Race Technology, UK).
When determining the dynamic parameters of the object under investigation (in this case, the container), data about its acceleration, speed, and position in space were measured and recorded. For this purpose, a DL1-MK2 data logger (Race Technology, UK), a three-way accelerometer (guaranteed 2 g minimum full scale on both axes; resolution of 0.005 g; optional 6 g sensor available as a factory option) vibration measurements (vibration factory tested at 25 g, 50 Hz sinusoid for 5 min), was used to record and store vehicle motion dynamics parameters. For positioning, the meter is connected to a GPS antenna (GPS—outputs position, speed, position accuracy, and speed accuracy every 200 ms with no interpolation; GPS tracking loops optimized for applications up to about 4 g; tracking of all satellites in view). Based on the time course of the vehicle and the acceleration readings, the device measures the speed of the test object with an accuracy of 0.16 km/h, with a measurement error of up to 1%. Longitudinal and transverse accelerometers record accelerations up to 20 m/s2 and measurement error up to 0.05 m/s2.
After processing the data collected during the experimental measurements, the entire loading process was divided into stages to identify which technological loading process takes the longest. The purpose of this experiment was to identify problematic operations in the loading process when scheduling a synchronization task, thereby justifying the need for synchronization. By synchronizing individual port facilities (such as terminal trucks and quay cranes) and by planning cargo operations accordingly, it is possible to minimize the impact of these problem areas on the loading time. These stages and summarized experimental results are given in Table 2.
Statistical data of container loading time.

Experimental measurements were implemented when the cargo was shipped from the ship to the shore. Depending on the loading process, the operations are divided into seven stages: (1) start of lifting (hooking), (2) vertical lifting, (3) diagonal lifting, (4) horizontal transportation, (5) diagonal lowering, (6) vertical lowering, and (7) placing on terminal truck. The overall loading cycle in the ship-to-shore process was also evaluated. The summarized results of experimental studies show that the entire duration of the ship-to-shore cycle of the loading process during the transfer of cargo from the ship to the shore is in accordance with statistical log-normal law.
The number of data n = 102 was measured (from ship to shore). The log-normal law hypothesis was tested by Pearson’s χ2 criterion. The histogram of the experimental loading times determined during experimental measurements is shown in Figure 4.
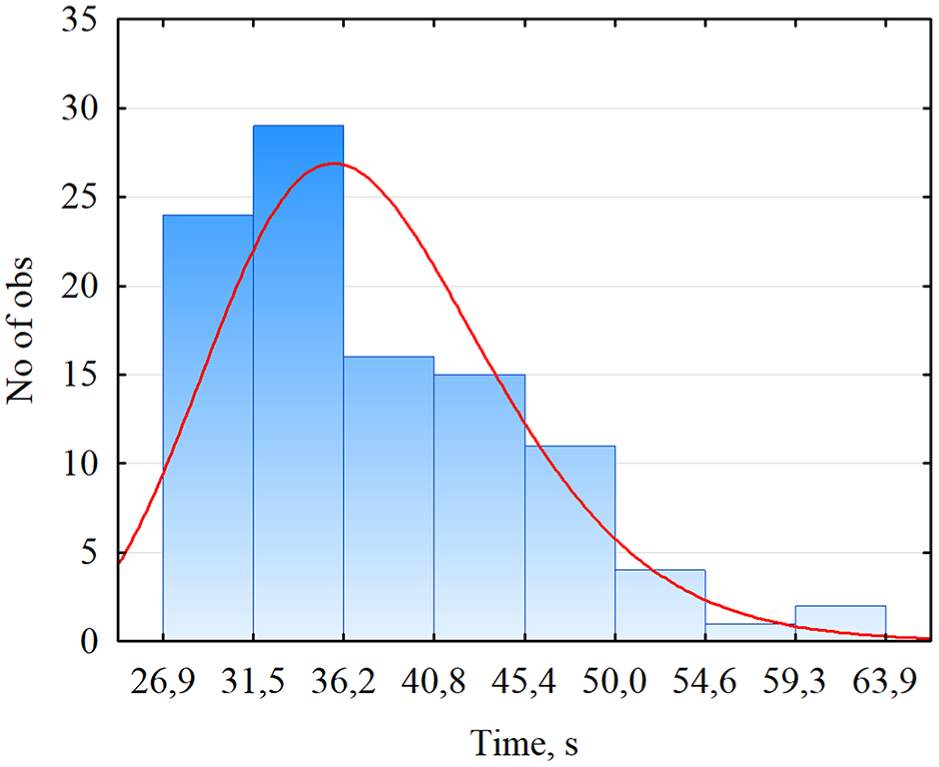
Histogram of experimental load from ship-to-ship on the quay.
After analyzing the loading process measurements in stages, steps 6 and 7 were chosen for further analysis, that is, vertical lowering and positioning on the vehicle. These stages determine the crane-to-vehicle alignment to optimize the loading process and make it continuous. In Figure 5, the distribution of the vertical lowering time is presented.

Histogram of experimental measurements of vertical lowering of container toward vehicle height.
We can see that the vertical lowering mean time of the container t is equal to 7.3 s, and the vertical lowering height mean value is 8.8 m, considering the standard deviation as 4.5 m. Hypothesis of lowering time distribution by Normal law was tested by Pearson’s χ2 criterion. Experimental results show that the average weight of the container load during the experimental measurements is 22.2 ton and the standard deviation is 10.2 ton, and coefficient of variation is 46%. In Figure 6, the distribution of the loading phase duration is presented, when the load is placed on the terminal truck and detached.

Histogram of experimental measurement container placement on terminal vehicle.
As we can see shorter intervals predominate, they represent about 50% of the total (n = 102) measurement result. Average is about 5.43 s; however, container placement can take up to 20 s. Duration of this step could be optimized by automation of loading process, and this process could be about 2 s, as show experimental results. The purpose of the synchronization task is to make the vehicle arrive when the load lowered during the loading process. Therefore, experimental measurements carried out when the equipment mounted on a container transport. Experimental research measured the trajectory of the terminal truck in the port area and its waiting time at the crane (see Figure 7).

Histogram of experimental measurements of vehicle waiting time.
The results show that the waiting time of the vehicle at the container crane varies from 4 s to 34 min (2096 s). The average waiting time is 229 s and standard deviation 346 s. The process is extremely unstable with a coefficient of variation of more than 150%. During the experimental measurements, the cargo was also evaluated (when mounting the equipment on the gripper—the closest point to the container). During these experimental measurements, the velocities and accelerations of the moving load were measured. After processing the results, we selected the best result—the experimental result of the fastest lowering of the load (see Figure 8).
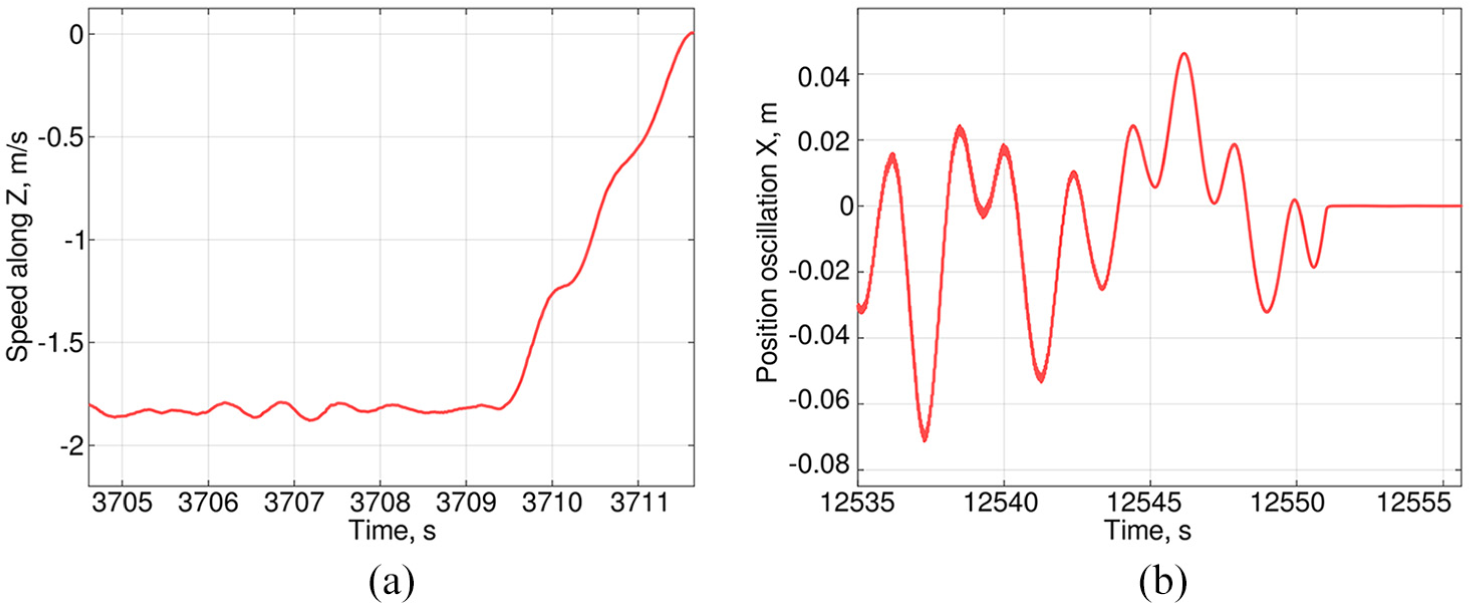
Experimentally measured data: (a) the speed of the vehicle in the z-direction when the load lowered vertically and (b) container sway in horizontal plane during lowering.
The results show that investigated case of load lowering vertically was done in 1.9 s. The lowering speed of this situation is given in Figure 8(a). As a result, speed values are negative because the load is lowered. We also watched the fluctuations of the load that influence the full automation of the process. The load fluctuations in the horizontal plane during lowering are shown in Figure 8(b). As one can notice, container sways in a 10 cm boundary. This value suggests that the cargo lowered in a stable manner and no outer forces affect the sway (wind gusts or operator mistakes).
The experimental results show the need of more sophisticated control of the crane–container terminal truck system, but to work in real situation and to improve the performance are difficult due to the intervention into the port operation. Therefore, the mathematical model for lowering the container was developed to make adequate modeling and producing the tool for control system development.
Results and discussion
During the numerical simulation, the cargo lowering process was analyzed, which corresponds to the loading stage 6 of the experimental investigations. Simulation of the lowering process was completed by evaluating the force during contact placing the load on the vehicle. The results of numerical simulation are presented in Figure 9.

The result of numerical simulation: (a) variation of the vertical distance H of the load to the vehicle and (b) variation of impact force during loading.
During numerical simulation, the load was lowered vertically down (see in Figure 9(a)). Due to the high weight of the load and the elasticity of the cable, the damping occurs. Figure 10 shows the situation when the load is placed on a vehicle with a dynamic force F12 of ∼180 kN (see Figure 9(b)).

Numerical simulation result: torques during load lowering.
Changes of torque moment of the gear wheels during lowering presented in Figure 10.
During the modeling phase, the gap between the gear teeth was estimated. As we see during the lowering of the load, it has a negative effect; it excites the vibrations of the gears. This affects the lowering process; the vibrations pass to the cable and consequently worsen the loading conditions. Figure 11 shows the acceleration during horizontal lowering, and in Figure 11(a), the numerical simulations show that the acceleration values increase significantly when cargo has a contact with terminal truck. This is consistent with experimental measurements (Figure 11(b) (point 7)), with a significant increase in acceleration values and excitation of the terminal truck when the load is applied. On comparison, the results with the best experimental data that was achieved during the lowering (b) – was 2.4 s, but modeling results show that it is – in ideal conditions – possible to make the operation in 0.5 s (a). And, the results are comparable in time and amplitude, thus approving the model adequacy. So, the mean time of last stage of lowering of container could be moved toward the range of 0.5–2.5 s.
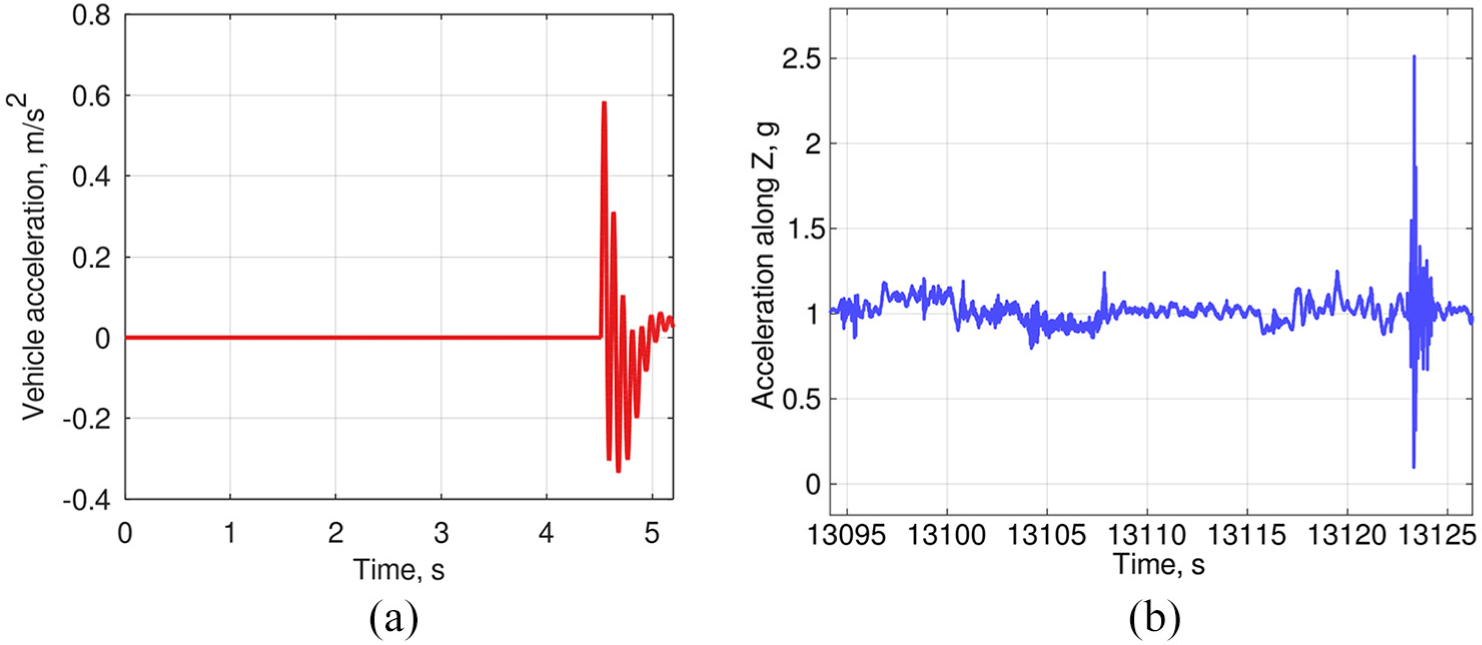
Numerical modeling (a) and experiment (b) results comparison.
Figures above demonstrate that when the container is placed on the terminal truck, additional dynamic force is added, which at sometimes can be twice as large as the levering container weight. This is a known effect in classical mechanics. Such regularity is confirmed by the results of numerical simulation and experimental acceleration measurements (see Figure 11). Experimental measurements show a very similar tendency during container loading procedures.
Conclusion
In this article, as a result, we demonstrate the generalization of the measurements with real quay crane and terminal vehicle and propose a mathematical model describing the dynamic properties of both. Experimental measurements “in situ” of container-lowering to terminal truck have been investigated in detail and statistical analysis of the new experimental results carried out. Experimental measurements showed that variance coefficient reached up to 150% on final handling operation. These operation durations varied between 2.36 and 20.43 s, with a mean value of 5.43 s. The entire lowering cycle variation coefficient reached 55.16%. Shorter time boundary shows that the handling process is optimizable up to two times by scheduling the operations between quay crane and terminal truck operators and using specialized algorithms for lowering process control for each individual case. This in fact could provide stability to port operations and make processes and procedures more agile for long-term planning. According to these new experimental data and research findings, further plans will be prepared to develop a methodology for crane and terminal truck, AGV synchronization in real time and will be used to bridge the scheduling mechanisms into a single real-time synchronization system.
Footnotes
Acknowledgements
The authors thank other project (No. 01.2.2-LMT-K-718-01-0081) members: Dr R Didziokas, Dr E Guseinoviene, Dr M Kurmis, Dr D Drugnilas, and Z Lukosius for valuable insights and collection of data on site.
Handling Editor: James Baldwin
Declaration of conflicting interests
The author(s) declared no potential conflicts of interest with respect to the research, authorship, and/or publication of this article.
Funding
The author(s) disclosed receipt of the following financial support for the research, authorship, and/or publication of this article: This research was funded by the European Regional Development Fund according to the supported activity “Research Projects Implemented by World-class Researcher Groups” under Measure No. 01.2.2-LMT-K-718-01-0081.