
Abstract
This article introduces novel blade tip geometric modification to improve the aerodynamic performance of horizontal-axis wind turbine by adding auxiliary cascading blades toward the tip region. This study focuses on the new turbine shape and how it enhances the turbine performance in comparison with the classical turbine. This study is performed numerically for National Renewable Energy Laboratory Phase II (non-optimized wind turbine) taking into consideration the effect of adding different cascade configurations on the turbine performance using ANSYS FLUENT program. The analysis of single-auxiliary and double-auxiliary cascade blades has shown an impact on increasing the turbine power of 28% and 76%, respectively, at 72 r/min and 12.85 m/s of wind speed. Knowing that the performance of cascaded wind turbine depends on the geometry, solidity and operating conditions of the original blade; therefore, these results are not authorized for other cases.
Keywords
Introduction
It is evident from general design trends of horizontal-axis wind turbines (HAWTs) that relatively low solidity produces the best performance for high rotational speed designs.1,2 Moreover, analyzing the power contribution along with the wind turbine blade length indicates that most of the power is produced by the blade tip region.
Cascades are used in turbo machines to guide the flow over the blade surface in order to improve the resultant performance. In wind turbines, using this technique is recommended for more flow guidance and more surface of power extraction especially at low values of tip speed ratio (TSR). Partial cascades are used in vertical axis wind turbine (VAWT) for power augmentation, such as straight blade cascade,3,4 or use slate as double-element airfoil.5,6
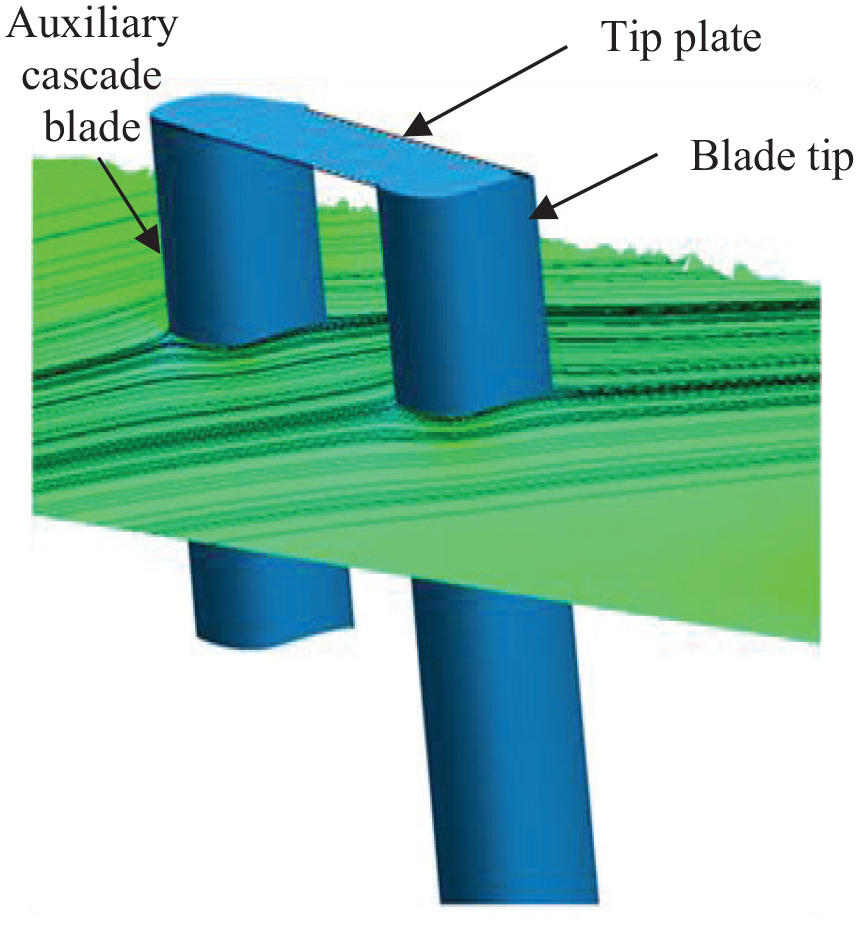
This work introduces a novel blade tip modification in HAWT. Since the solidity is very low toward blade tip, partial cascading of the wind turbine blade tip is introduced, as shown in Figure 1. This article seeks to explore the potential of this new concept in HAWT for power enhancement at different operating regimes.
Cascade attached with original WT.
Modifications at tip region can be used to reduce the radial momentum loss, such as winglets,7–9 Mie-type tip vane, 10 and tip plates. 11 The tip plates can be used to connect the auxiliary cascade blades.
A sample of results of two cascading S809 airfoils is illustrated in Figure 2. Figure 2 indicates that the delayed separation of the back airfoil is due to the guidance produced by the front airfoil.

Effect of cascade on separation.
Original HAWT—validation case
The numerical solution is validated to simulate the flow around wind turbine. An original WT blade of NREL phase II is designed by the National Renewable Energy Laboratory. 12
The numerical model used to simulate the flow solves steady Reynolds-averaged Navier–Stokes (RANS) governing equations using the ANSYS FLUENT program, and the results are validated with experimental data. The comparison is achieved at constant rotational speed of 72 r/min and changing the wind speed to plot the power–velocity curve.
NREL II WT configuration
The experimental data for NREL Phase II are obtained from the IEA Annex XIV database. 12 The wind turbine is three-bladed HAWT and the blades are un-tapered and un-twisted. The S809 airfoil is used throughout the span of the blades. The airfoil is pitched down by 12° throughout the blade span, as shown in Figure 3. The general data for this wind turbine design are included in Table 1.

Geometry of S809 airfoil and pitch angle.
NREL Phase II blade description.

NREL: National Renewable Energy Laboratory; RPM: revolutions per minute.
Computational domain and boundary conditions
The domain extends eight blade height (H) in the upstream and 10 H in the downstream direction. The domain radius is 10 H. The boundary condition for the domain inlet is velocity inlet in the axial direction, while outlet and upper planes are assigned to be pressure outlet and symmetry boundary condition, respectively. Figure 4 shows the computational domain sizing and boundary conditions.
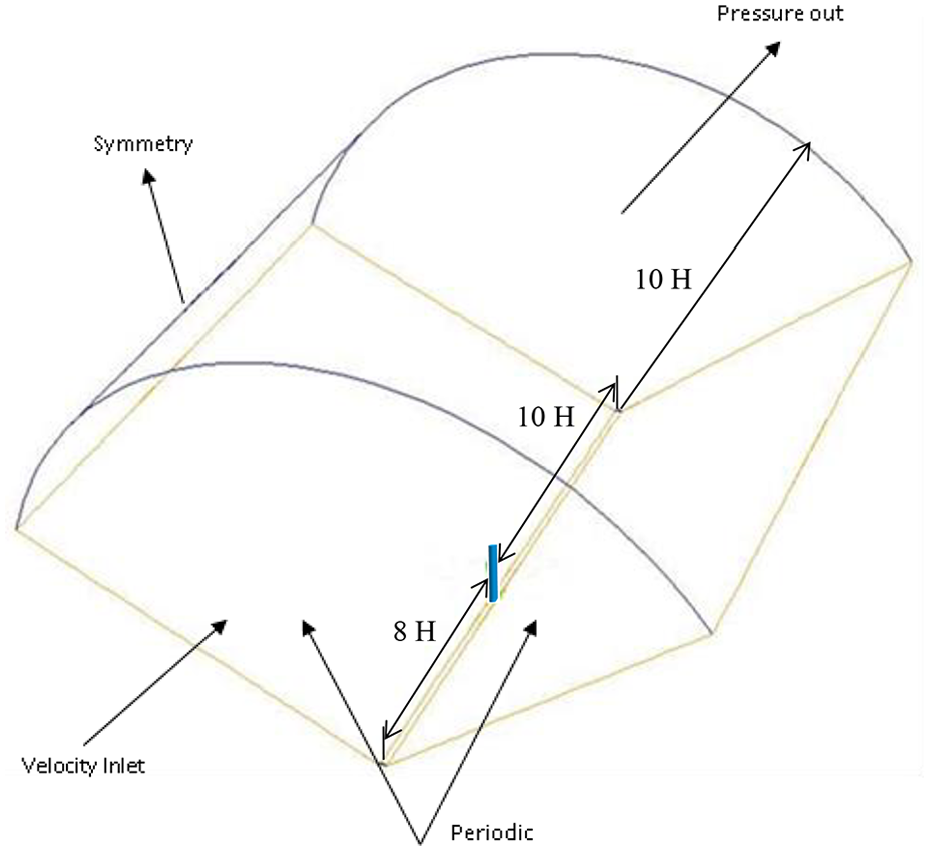
Computational domain sizing and boundary conditions.
Meshing
The mesh was generated by ANSYS V15 mesh generator for a single blade with imposing the periodic condition to account for the other two blades. The number of cells on the entire mesh of the original case is about 5.25 million cells. The grid points are clustered around the blade to obtain accurate resolution of flow field gradient, as shown in Figure 5.

Resolution on the blade surface, boundary layer and domain meshing: (a) grid resolution around blade section, (b) boundary layer mesh resolution, (c) blade surface meshing and (d) domain meshing.
A structured mesh used inside the boundary layer is normal to the blade surface, where sharp variations of the flow variables exist to ensure precise boundary layer (BL) computations. The grid quality, measured by cell skewness, is good for elements below 0.5. The average skewness here is 0.25, which is good for computational fluid dynamics (CFD) calculations. 13 Table 2 shows the construction and statistical data of the grid.
Grid sizing and examination.
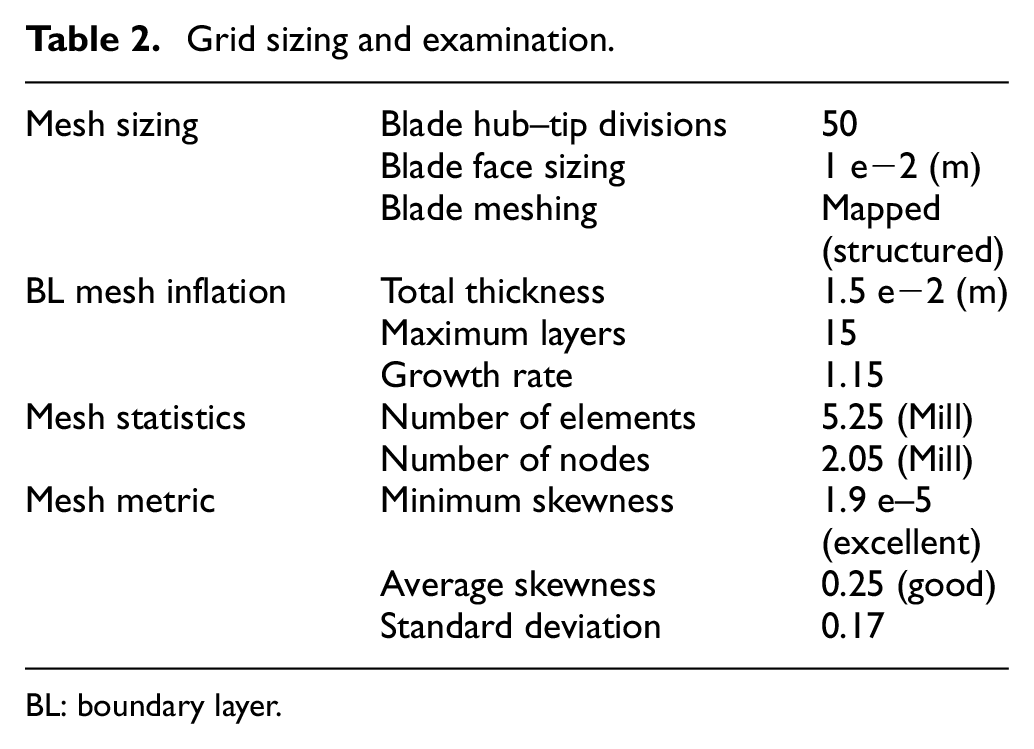
BL: boundary layer.
Modelling and problem setup
An incompressible pressure-based solver with a viscous turbulent flow equation is introduced. The pressure–velocity scheme is coupled. The spatial discretization for pressure is standard, for momentum is second-order upwind and for modified turbulent viscosity is first-order upwind. The flow Courant number is 20 with an explicit relaxation factor of 0.5 for both momentum and pressure and 0.7 for modified turbulent viscosity.
The standard Spalart–Allmaras simple model is used to compute for the turbulent viscosity; it gives good results for BLs subjected to adverse pressure gradient. 14
Validation results
The variation of the turbine power with the wind speed is accurately predicted as indicated in Figure 6, which presents a power comparison between numerical and experimental results of the original (un-cascaded) NREL II WT.7,12
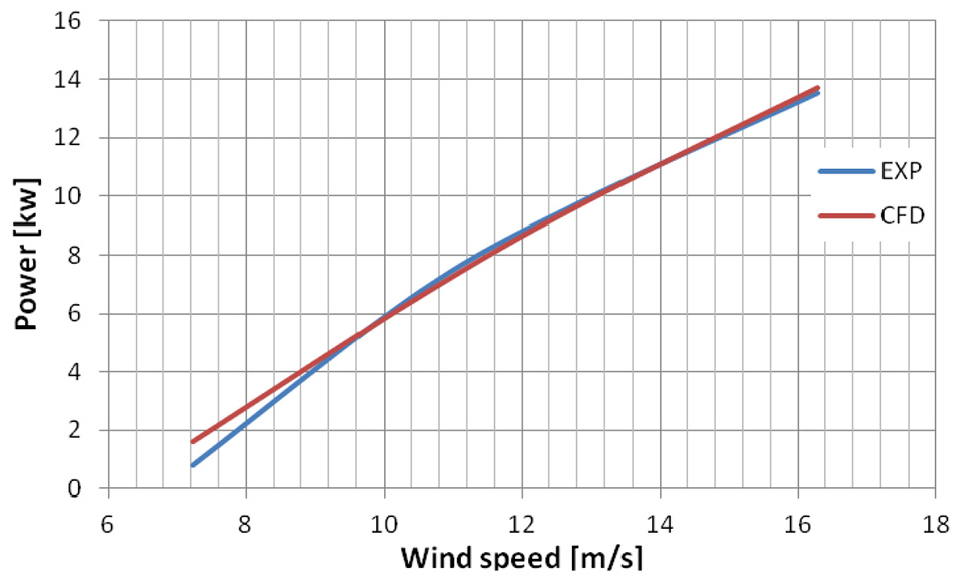
Comparison between CFD and Exp. for NREL II at different wind speeds.
Figure 7 shows the solution convergence history of the torque and thrust at 12.85 m/s wind speed, and stop calculations after the results settle with iterations. The results indicate that convergence has been reached after 600 iterations.

Convergence histories of the turbine torque and thrust for NREL Phase II at 12.85 m/s.
The Reynolds number values for NREL II blade at this condition are illustrated in Table 3; the values ensure that the flow is turbulent over the WT blade.
Reynolds number values for NREL II blade at 12.58 m/s and 72 r/min.
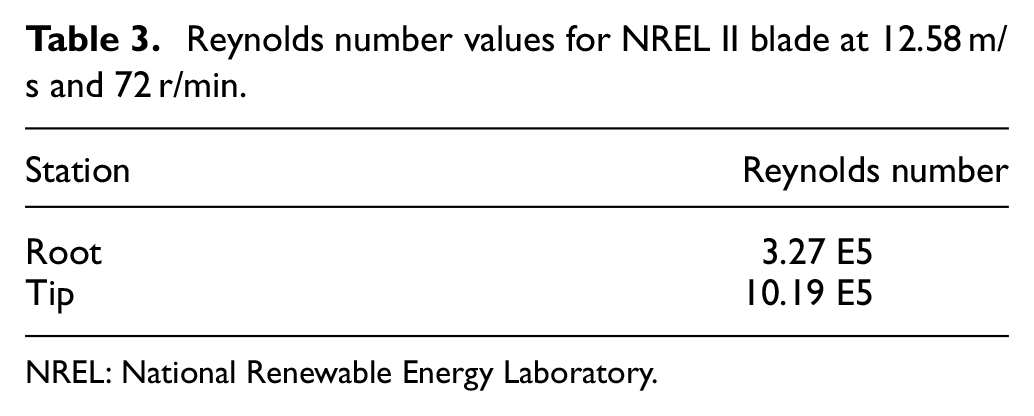
NREL: National Renewable Energy Laboratory.
Figure 8 shows the pressure distribution at different spanwise sections on NREL II at 12.85 m/s. It is clear that the computed results are in good agreement with the experimental data. Little bias is noticed between the computed and experimental pressure distribution at 30% span, at which separation has occurred and the resulted vorticity is stronger close to the root.

Comparison of CFD with Exp. NREL II at 12.85 m/s and 72 r/min at different stations: (a) r/H = 30%, (b) r/H = 47% and (c) r/H = 80%.
Cascading in wind turbines
To emphasize the effect of partial tip cascading on wind turbine performance, several cascade parameters can be introduced.
Cascading parameters
Cascading parameters are listed as follows: the tangential space-to-chord ratio

Schematic drawing shows different cascade parameters.
Cascading configurations
Several tip cascading configurations are studied including the effect of front and/or back cascades, as shown in Figure 10, including the following:
Front cascade compounding (MF).
Back cascade compounding (MB).
Both front and back cascade compounding (MFB).

The main turbine with both front and back cascades.
The layout of the cascade spacing applied to NREL Phase II of cases (a), (b) and (c) is illustrated in Figure 10. A sample calculation of the 3D cascade spacing with a representative cascade height of 1.5 m

Meshing of the main turbine with both front and back cascades.
Cascading results and discussions
The NREL II wind turbine is studied numerically after adding auxiliary blades as partial tip cascading to show the effect of this new configuration on the turbine performance. The reference condition is taken to be 12.85 m/s of wind speed and the rotational speed is 72 r/min.
Front auxiliary cascade arrangement
The results of the added front cascade configuration to that wind turbine at different wind speeds show that the power gain of the cascaded WT increases with the wind speed due to the phenomena of stalling delay, as shown in Figure 12 and Table 4.

Performance of original and cascaded WT at different wind speeds.
Performance comparison between cascaded and original WT at different wind speeds.

WT: wind turbine; MF: front cascade compounding.
Figure 13 shows a comparison of tangential force distribution along the blade height between front cascaded WT and the original WT at different wind speeds.

Tangential force distribution for original blade and front cascaded blade.
The figure indicates that the gain of cascade increases with increasing the wind speed (high angles of attack), whereas parts of the WT blade at low angles of attack may encounter small gains, other parts that operate at high angles of attack (that may produce separation of the original blade) may encounter remarkable gains.
Also, the gain of increasing in local solidity is proportional to the increase in wind speed (decrease TSR), so adding cascades has a large impact at high wind speed or low rotational speed because of increasing the surface of power extraction. In general, there is an optimum cascade solidity for each application.
Different auxiliary cascade arrangements
The effect of adding different cascade arrangements on the torque and power coefficient is presented in Table 5. The results indicate that when adding only front or back cascade, the gain of turbine power output increases by about 28%; furthermore, when adding both front and back cascading blades, the gain of power output exceeds 75% with respect to the original WT at the same operating conditions. Figure 14(a) and (b) shows the effect of different cascade arrangements on the tangential and normal force distributions at reference condition, and Figure 14(a) indicates that adding either front or back auxiliary cascade blade increases the tangential force distribution through the cascade region by approximately equal percentage, while adding both front and back auxiliary blades the tangential force increases rapidly.
Results of adding cascades on NREL Phase II at 12.85 m/s and 72 r/min.

NREL: National Renewable Energy Laboratory; MF: front cascade compounding; MB: back cascade compounding; MFB: both front and back cascade compounding.

Effect of cascade configuration on tangential and normal forces at 12.85 m/s and 72 r/min: (a) tangential force distribution and (b) normal force distribution.
Figure 14(b) indicates that cascades have a negative effect of increasing the normal (thrust) force due to increasing the turbine solidity, so more tower fixation force is required.
The effect of adding different cascade arrangements on the torque and power coefficient is presented in Table 5. The results indicate that when adding only front or back cascade, the gain of turbine power output increases by about 28%; furthermore, when adding both front and back cascading blades, the gain of power output exceeds 75% with respect to the original WT at the same operating conditions.
Figures 15–17 illustrate a comparison between pressure distribution after mounting front auxiliary cascade blade only, back auxiliary cascade blade only, and mounting both (front and back) auxiliary cascade blades, respectively.

Comparison between pressure distribution for NREL II at 12.85 m/s and 72 r/min with front cascading: (a) r/H = 75%, (b) r/H = 85% and (c) r/H = 95%.
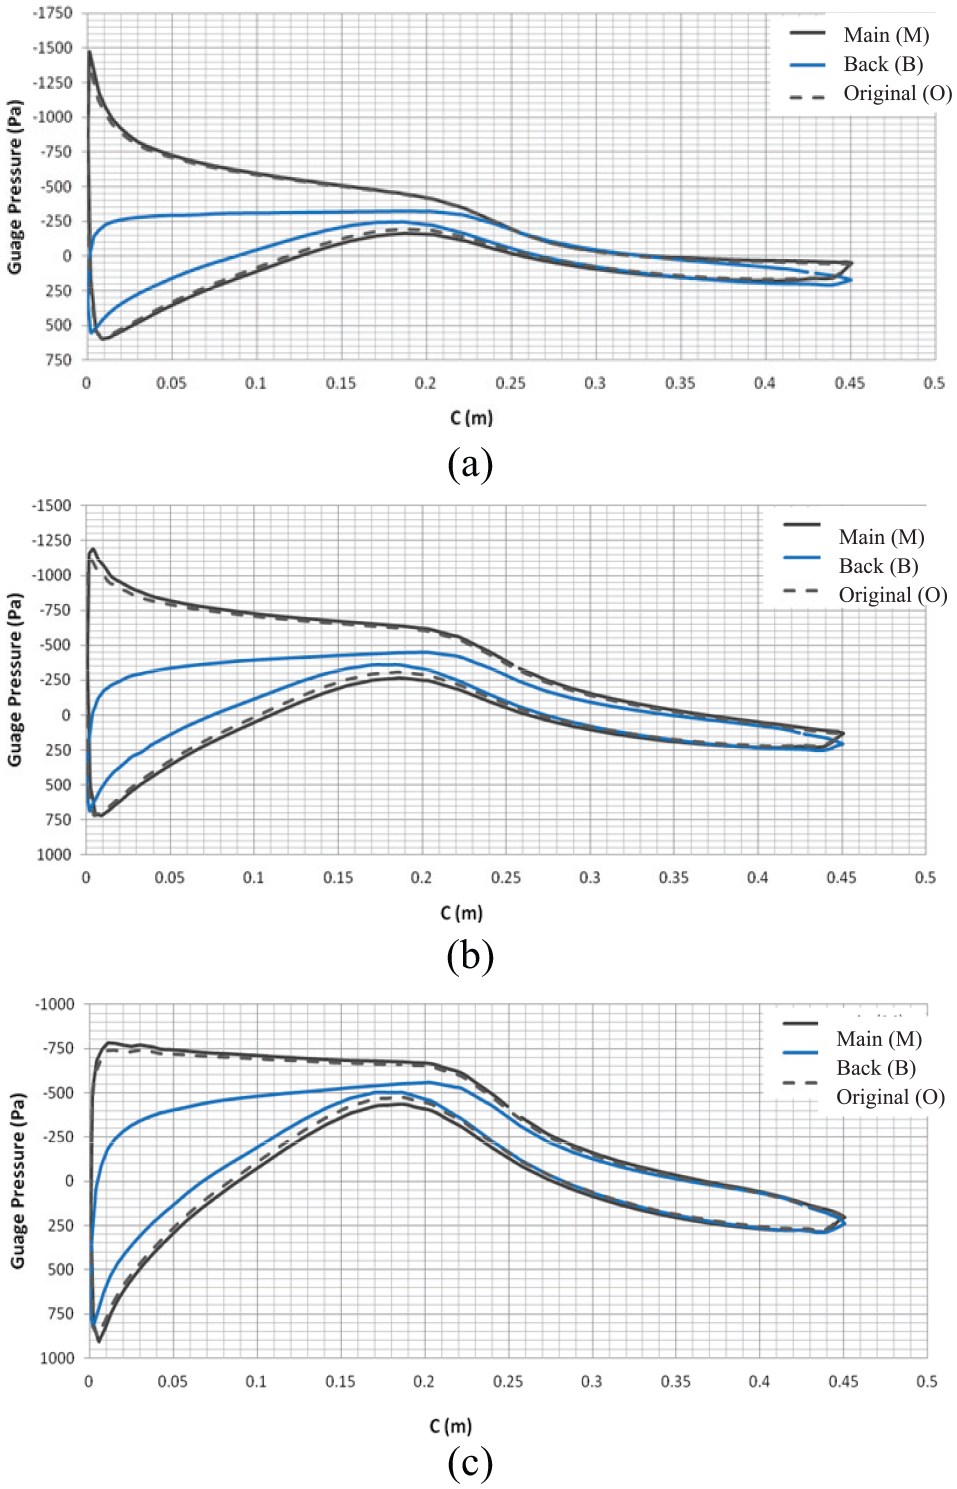
Comparison between pressure distribution for NREL II at 12.85 m/s and 72 r/min with back cascading: (a) r/H = 75%, (b) r/H = 85% and (c) r/H = 95%.
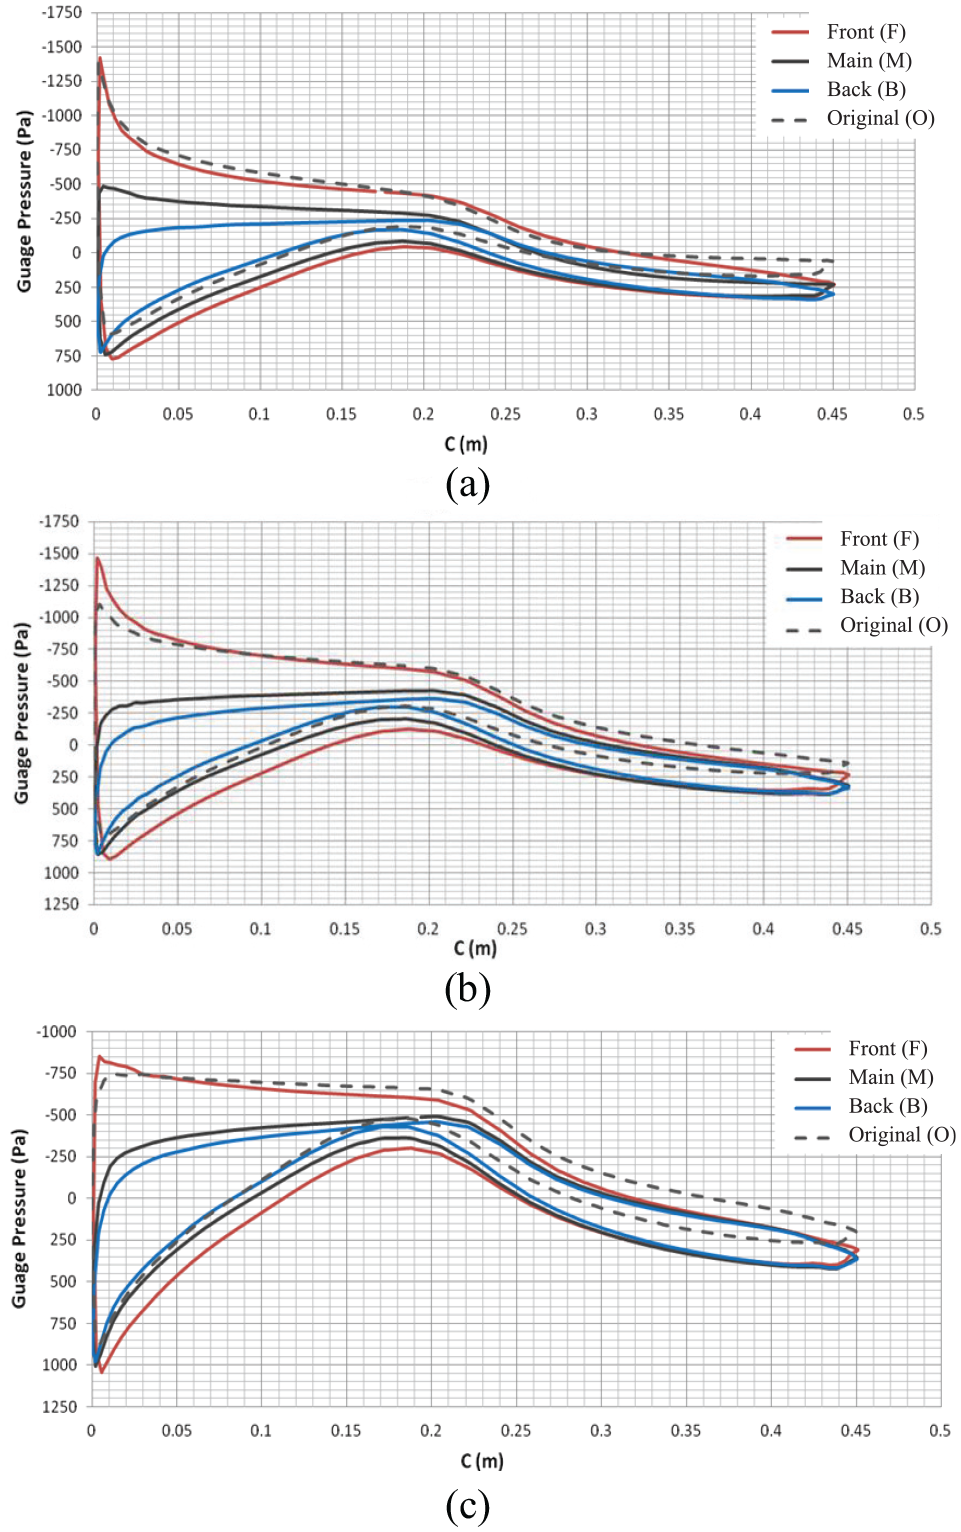
Comparison between pressure distribution for NREL II at 12.85 m/s and 72 r/min with both front and back cascading: (a) r/H = 75%, (b) r/H = 85% and (c) r/H = 95%.
Figure 15 shows that at all stations, the superposition for pressure coefficient of the main blade combined with front auxiliary cascade blade (the solid black and red lines) is larger than the original (un-cascaded) blade (the gray dashed line). Figure 16 shows that at all stations, the superposition for pressure coefficient of the main blade combined with back auxiliary cascade blade (the solid black and blue lines) is larger than the original (un-cascaded) blade (the gray dashed line). Figure 17 shows that at all stations, the superposition for pressure coefficient of the main blade with both front and back auxiliary cascade blades (the solid black, red and blue lines) is larger than the original (un-cascaded) blade (the dash gray line). The increase of the pressure coefficient for the last case is much more than the previous two cases.
The increase in pressure coefficient explains the increase in the tangential and normal force distributions along the cascade compounding. By adding cascades, the extracted power increase as the wind kinetic energy increase due to increasing the surface of power extraction. However, at low wind kinetic energy, excessive increase of cascade solidity may cause adverse effect due to increase the flow resistance leading the flow to bypassing the turbine area. An illustration of velocity contours and streamlines for original, single- and double-auxiliary cascade blades at 80% of the blade height is presented in Figure 18.

The velocity contours and streamlines of original-, single- and double-auxiliary cascade blades at 80% blade height, operating at 12.85 m/s and 72 r/min: (a) original blade, (b) original with single-auxiliary blade and (c) original with double auxiliary blades.
Conclusion
The gain of cascade can be observed at conditions of low TSR, which can be satisfied at high wind speed or low rotational speeds, and the gain increases due to the effect of stalling delay at cascade region. Moreover, the effect of increasing the surface area is dominant; thus, the increase in solidity at this condition means increase in the surface of power extraction.
The stations toward the blade tip can affect a high-power contribution, so that adding partial cascading blades toward the blade tip is preferable. Using a single-auxiliary cascade blade, the upstream blade suffers the impact of separation, while the second suffers partially. Using double-auxiliary cascade blades, the forward suffers the impact of separation, while the next two blades are better.
When cascades applied to NREL Phase II (non-optimized) HAWT, the results indicate that adding a single-auxiliary blade either on the front side or on the rear side of the blade increases the power by an approximately equal percentage of 28%. Moreover, attaching both front and back cascades to the main blade, the power can increase to 76% with respect to the original WT at the same operating conditions of 72 r/min and 12.85 m/s wind speed.
Noting that results trend can be altered when the original blade is optimized, or it has different geometry, these results are not authorized for other cases. When the original blade solidity is designed optimally, then an excessive increase in WT solidity using double or more cascading blades insights high flow resistance as the flow bypasses the WT (physical sense) and consequently reduces the extracted power very much.
Footnotes
Appendix 1
Handling Editor: James Baldwin
Declaration of conflicting interests
The author(s) declared no potential conflicts of interest with respect to the research, authorship and/or publication of this article.
Funding
The author(s) received no financial support for the research, authorship and/or publication of this article.