
Abstract
Small-scale wind turbines with innovative design are introduced for small applications, providing clean renewable energy to rural homes, street lighting, and hybrid systems. Energy ball wind turbine, known as Venturi wind turbine, has untraditional blades’ shape and special aerodynamic behavior that creates a venturi effect on the air stream passing through its aspherical shape. This article represents an integration of computational fluid dynamics and wind tunnel experimentation to study the aerodynamic performance of a manufactured model of energy ball wind turbine. Physical models with different twist angles were fabricated and tested in a small wind test section. In these experiments, dynamic torque, angular velocity, and coefficient of performance values were measured at different speeds. The experimental power coefficient results were discussed showing the best-tested twist angle. Fluid flow simulation has been developed in ANSYS FLUENT software. The findings of these numerical simulations have provided pressure contour, velocity contour, and torque values which help to study the solidity effect on turbine’s power coefficient. Nevertheless, the velocity contours provided from the computational analysis ensure the Venturi effect of the energy ball wind turbine design.
Keywords
Introduction
A new generation of small wind turbines appeared after the oil crisis. Wind turbine technologies, recently, have significantly improved the increase in turbine size, efficiency, and ease of installation. In addition, turbine efficiency has increased due to new blade designs and modern innovative shapes and techniques. Small-scale wind turbines (SSWTs) operate with relatively high rotational speed due to the small radius so that there is no need for a gearbox. This approach reduces the cost, maintenance, and improves the reliability and efficiency at low wind speed operation.
Small wind turbines have less generating capacity than the huge commercial turbines found on wind farms. However, their reduced costs and added versatility allow wind power to be used in a wider set of applications instead of working 80% of the time due to its low cut-in wind speed velocity. These small turbines are used primarily for distributed generation—generating electricity for use on-site—rather than transmitting energy over the electric grid from central power plants or wind farms.
Small turbines’ technology is considered a small-scale alternative to solar panels, providing clean renewable energy to rural homes, street lighting, and hybrid systems. Small wind turbines can have a generating capacity in the range of 0.3–100 kW, though the amount of power they generate depends on the wind speed. A small turbine typically needs a wind speed of 3 m/s at the height of the turbine, which makes them ideal for many applications. 1
SSWTs installed within the urban environment are classified as microgeneration technology and are classified into horizontal axis wind turbines (HAWTs) and vertical axis wind turbines (VAWTs). 2 Since there is a unique relationship between the tip speed ratio (TSR) and the power coefficient for each blade type and a unique optimal TSR corresponding to the achievable maximum power coefficient, the blade and the rotor should be designed to perform the near optimal TSR at wind speeds, which it is likely to encounter. Based on this concept, researches are performed to define optimum values suitable for different turbines’ types. A case study on three-bladed wind turbine of rotor diameter 2.1 m was tested in a wind tunnel up to a wind speed of 13 m/s. In this case study, the blade characteristics were calculated as a function of wind speed and yaw angle, with and without a nose cone. At various wind speeds, the values of the TSR varied from 2 to 0.8 and the maximum Cp of 0.2 occurred at 6 TSR. 3
In 2009, fundamental research has been conducted by Timmer and Toet 4 to examine the potential and optimal power output of the Archimedes spiral small wind turbine. The highest efficiency measured in the study was 12%. Singh et al. examined a two-bladed rotor (AF300 airfoil) wind turbine with a diameter of 1.26 m at different pitch angles of 15°, 18°, and 20°. It was observed that the rotor achieved Cp values of 0.l, 0.217, and 0.255 at the wind speeds of 4, 5, and 6 m/s respectively, while the baseline three-bladed rotor achieved 0.052, 0.112, and 0.15 at the same wind speeds. 5 A combination of two common VAWTs was tested for optimal performance at low wind speeds.
The Darrieus rotor is not self-starting rotor, but it has much higher efficiency than the Savonious rotor. The Savonious rotor has relatively low efficiency, but it creates high torque and is self-starting even at low wind speeds, that is why the Savonious rotor is used to start the straight bladed Darrieus rotor. The combination of rotors increases the maximum power coefficient (Cp) to be in the range of 0.18–0.20 in lower wind speeds. 6 A study was conducted on the energy ball wind turbine (EBWT), known as Venturi wind turbine, which is a new HAWT concept with a special design. This study indicates that the power coefficient of the EBWT of diameter 1 m is 0.18, while it is 0.24 for EBWT with 2 m diameter. 7
One of the main advantages of this type is that the turbine is designed to get benefit from the Venturi effect, which is a measurement of pressure created by channeling an incompressible liquid through a restricted section of pipe. This spherical energy ball takes this principle and uses it to channel air through the blades and around its generator, which develops the efficiency of the turbine to operate at very low wind speed. Although the wind direction in the urban environment changes constantly, the EBWT follows the wind direction automatically because the yaw is passively controlled due to its innovative design. Another advantage of this turbine is the spherical blade design connected from both sides to the hub, without blade tips, causing it to be noiseless. The EBWT manufacturing company claims that the turbine’s efficiency is 40% more than traditional wind turbines with the same area, 8 but there are no reports on the aerodynamic characteristics of the EBWT.
In this study, a theoretical approach was introduced and applied to the EBWT design based on the Venturi effect. The performance of the wind turbine was evaluated using an experimental setup for three different twist angles for six and three blades. A computational fluid dynamics (CFD) method was used to test some parameters including the number of blades, solidity effect, and the velocity and pressure contours at different TSRs.
Energy ball geometry
The Home Energy company has developed two versions of the EBWT. The two versions are V100 and V200 EBWT. The V100 EBWT is a small spherical wind turbine with a diameter of 1 m and has six blades. The V200 has a bigger diameter of approximately 2 m and has five rotor blades. The EBWT parts are the shaft in which the generator is included with two hubs, blades, yawing system, and a free-standing pole to be automatically directed with the wind direction as shown in Figure 1.

V100 energy ball wind turbine. 9
Wind energy ball blades have an unusual and exceptional design. We can split the blades into four sections. The four sections and their dimensions are shown in Figure 2.

Sections on energy ball blade.
Sections 2 and 3 have two up and down curves with their equations shown in Figure 3.

Up- and down-blade curve equations: (a) the estimated up-blade curve equation and (b) the estimated down-blade curve equation.
The up-curve equation and the down-curve equation are shown in Figure 3(a) and (b), respectively.
Sections 1 and 4 of the blades were considered as a rectangular-shaped flat plate but with different dimensions. The blades are connected to a hub with a twist angle, and this angle was not defined by the manufacturing company, so three different hub angles were manufactured at (20°, –25°, and 30°). The angle values were chosen by estimating the blade angle of the turbine made by the original manufacturer. The blades start with the biggest twist angle near the hub connection and decrease till it reaches zero twist angle at the middle of the blade and then returns to the same twist angle at the end of the blade but with an opposite direction.
The twist angle can be defined to be the angle between the incoming velocity in the x-direction (v) and the chord line in the blade element in the z-direction (c). The twist angle changes along the four regions of the blade, as shown in Figure 4.

Energy ball blade’s twist angle.
Theoretical study
Assume a stream-tube of the air stream is flowing through the EBWT as shown in Figure 5. The turbine has an upstream wind speed (V1) and a cross-sectional area (A1). The EBWT Venturi effect 10 (pressure difference resulted from a smaller area caused by the blade’s geometry) causes the wind to speed up as the blades constrict the flow.

Velocity distribution around the energy ball.
Let the mass flow rate of the wind flow through the turbine is equal to

where

The inside energy ball diameter is assumed to be 0.8 of the upstream diameter, where the solidity percentage of the six-bladed EBWT is 23.4% (calculated in solidity ratio calculations)

where D1 is the upstream diameter and D2 is the inside ball diameter

Substituting in equations (2) and (3)


This relation indicates that the wind velocity increases inside the EBWT, which results in an increase in the rotational speed of blades.
Experimental methodology
Test section manufacturing
A small blow-down type wind tunnel with a fan to change the wind speed is considered to produce wind velocity. The wind test section is manufactured with 2.8 m long consisting of fan section, circular section, and converging exit section as shown in Figure 6. The air flow was generated from the fan inside the test section to induce flow through the wind tunnel and the air velocity is controlled using a variable resistance switch.

Manufactured test section: (a) test section geometry and design and (b) manufactured test section.
Tested model specifications
The Wind Energy Ball V200 and V100 dimensions were scaled down to get the dimensions shown in Table 1.
Scaling down calculations.

The V50 and V25 models are not manufactured but are scaled down models of V200 and V100. The dimensions of V50 and V25 are based on the trend developed from the change in the diameter between the V200 and the V100 models and then the radius, circumference, area, and the blade length were calculated accordingly.
The V25 is the target model that is manufactured and studied in this thesis by simulating the energy ball turbine design especially for the blade’s geometry and hub design as shown in Figure 7.

Wind energy ball model.
Experimental procedure
Figure 8 illustrates the experimental structure for dynamic torque and rotational speed measurements for a 1/4 scaled down model from EBWT with 1 m diameter. The experiments were carried out at different wind speeds V = 3, 4, 5, 6, and 7 m/s. Wind speed was measured by a handheld anemometer and a high-resolution wind speed meter with a thermal probe to verify and validate the measurements at the outlet of the wind tunnel around the rotor. The rotational speed of the rotor (N) was measured by non-contact and contact digital laser tachometer. The blades were painted in black with a silver strip on one blade to help tachometer read accurate measurements with small acceptable fluctuations. Finally, the torque is calculated after measuring the force by spring scale using the Prony brake technique, which is a simple device to measure the torque produced by the rotating shaft.

Experimental setup.
The measurement is made by wrapping a cord or belt around the output shaft of the turbine and measuring the force transferred to the belt through friction. The friction is increased by tightening the belt or increasing weights on the belt’s other side until the frequency of rotation of the shaft is reduced as shown in Figure 9. 6

Prony break torque measurement technique.
After measuring the force for different weights at the same wind speed, we can get the resultant force using the following equation

where FNet is the measured force, Fspring is the readings of spiral spring in Newton with 10% error, and Fweight is the applied weight in Newton.
Weights of 50 g are used in measuring dynamic torque for each wind speed. The following relation was used to calculate the produced power

where Tdyn. is the measured dynamic torque in N m and r is the distance from the center line of the shaft to the point of measurement = 0.025 m

where PNet is the total available power, d is the distance from the center line of the shaft to the point of measurement in meters, N is the rotational speed in revolutions per minute, and F is the measured force in Newtons
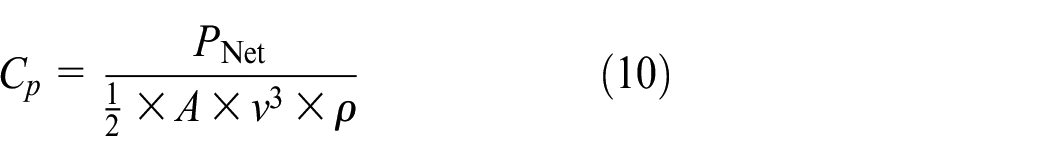

where PNet is the total available power,
Three different models of 20°, –25°, and −30° were tested. The other experimental variable was the number of blades, where six- and three-bladed turbines were tested for each angle.
CFD methodology
The three-dimensional (3D) models were created by Solid works program with an overall diameter of 0.33 m and the area of 0.85 m2, and a different number of blades are examined to study the effect of solidity ratio on the performance of the turbine at different TSRs for 20° twist angle. k-epsilon and k-omega solutions were used to predict and compare between the resultant torque for each case as shown in Table 2.
Comparison between experimental and computational torque with the k-epsilon and k-omega solutions.

Standard wall functions realizable k-epsilon model was applied for the flow simulation as it gives approximately better results for the examined cases; it is one of the most widely used turbulence models and it provides robustness, economy, and reasonable accuracy for a wide range of turbulent flows. The realizable model is the most recently developed of the three k-epsilon variations and features which makes the realizable model more precise than the other two models at predicting flows such as separated flows and flows with complex secondary flow features. 11 This model is based on the transport equations for the turbulence kinetic energy (k) and its dissipation rate (ε). The right side of the domain was assigned as an inlet, where the air is flowing in a single direction. The air hits the EBWT and then goes away from the left side, which is the main outlet. Rotating domain is considered as the moving wall and the environment where the air flowed around the rotor was assumed turbulent. The momentum, turbulent kinetic energy, and dissipation rate were calculated using the second-order upwind method. Numerical simulation provides the pressure and velocity values at all nodal points of the flow domain around the rotating blades. For all models’ continuity, X and Y velocity, kinetic energy (k), and the dissipation rate (ε) had the same convergence criteria. For steady solution, the case is solved for 5000 iterations where all the models showed a straight line for the convergence (10−6), for the transient solution, after few time-steps, the residuals show the same pattern. A comparative view of EBWT and air domain around energy ball is shown in Figure 10.

A comparative view of EBWT and air domain around energy ball: (a) a comparative view of wind energy ball and (b) a comparative view of the air domain around energy ball.
Assumptions
The following assumptions were made prior to conducting the simulation:
Incompressible flow;
Steady flow;
The fluid moves to the control volume parallel to the turbine’s shaft;
The quantities of mass flow at the outlet boundaries were the same as each other.
CFD solution validation
Figures 11 and 12 show the comparison between the moving frame and sliding mesh computational results of power coefficient values for the six-bladed and three-bladed EBWT. It compares the computational power coefficient of 20° EBWT with the same inlet velocity at different TSRs with the moving frame and sliding mesh computational results which shows that both gives almost the same solution in small TSR and a small difference in high TSRs.

Moving frame and sliding mesh computational power coefficient versus TSR for six-bladed EBWT.

Moving frame and sliding mesh computational power coefficient versus TSR for three-bladed EBWT.
Another validation test was applied to the torque coefficient (Cm) variation of one blade and six combined blades with the change in blade angle (θ). The results were displayed for a plot time of one cycle from 0° to 360° and are shown in Figure 13.

Blade Cm-blade angle for 1 cycle for six-bladed EBWT.
The same validation test was done for the three-bladed wind turbine. The torque coefficient (Cm) of each blade and total combined blades variation against the change in blade angle (θ) for three-bladed EBWT are shown in Figure 14.

Blade Cm-blade angle for 1 cycle for three-bladed EBWT.
It can be concluded from the shown figures that the effect of the blades on each other is small. This means that the torque coefficient produced is not significantly affected by the interaction effect of blades on each other.
Mesh refinement study
For 3D analysis, a mesh was generated around the EBWT using ANSYS mesh. The rotating domain is drawn as a cylinder just around the wind turbine with a diameter of 0.5 m. The fixed domain was drawn based on changing the radius of the cylinder and the distance before and after the rotating domain as shown in Table 3 and Figure 15.
Domain refinement cases.


Domain refinement cases.
Mesh refinement is done on the fourth case of fixed domain refinement to reach finally 2,524,791 elements in the domain, and the refinement steps are shown in Table 4 and Figure 16.
Fine meshing refinement cases.


Fine meshing refinement cases.
The final mesh around the EBWT is shown in Figure 17.
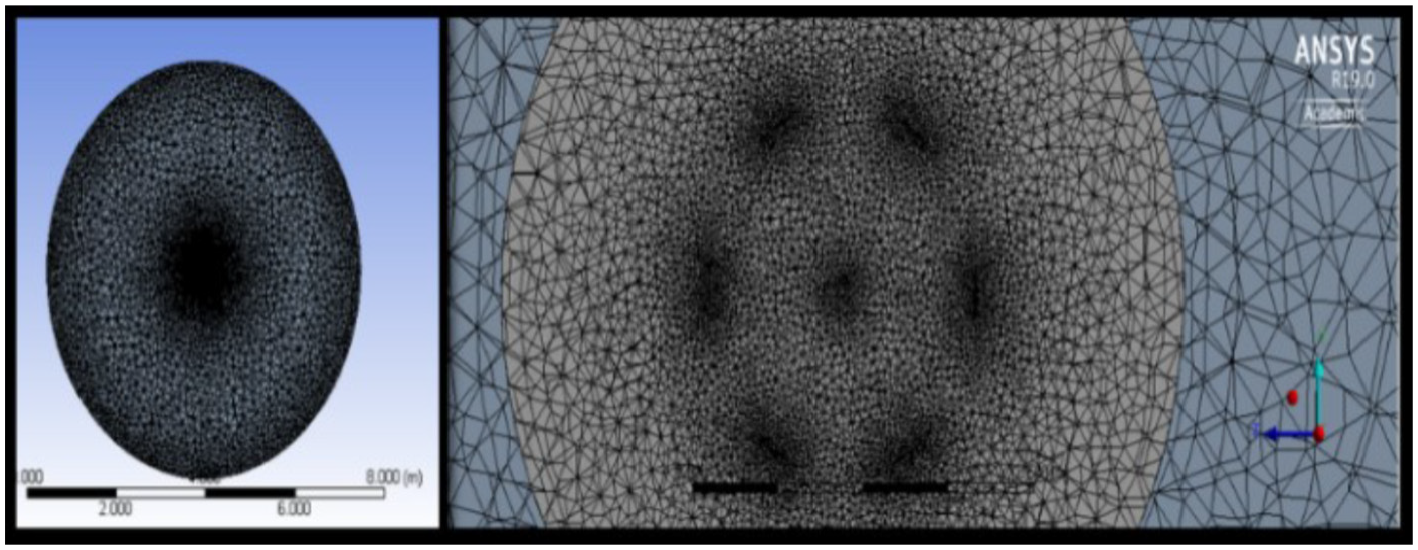
Energy ball meshing process—mesh around the turbine using ANSYS.
Solidity ratio calculations
One of the purposes of the computational study is to study the solidity effect, solidity is the percentage of material rather than air in the circumference of the rotor, and given by

for identical uniform blades and circular frontal area, where n is the number of blades,
A is the blade’s area, and
The two variables that influence the solidity are chord length and number of blades. There is a very large variation in the optimal solidity depending on the size of SSWTs. 12
In EBWT case, uniform blades and the air flows across its 3D spherical shape, the solidity was calculated by the following steps:
Calculate total sphere surface area A = 4πr2 = 0.34211 m2.
Get the blade area (Ab) from solid works b = 0.013339 m2.
Solidity percentage for (n) number of blades is calculated using the following equation.
The following formula is used to calculate the EBWT solidity percentage

where Ab is the EBWT blade’s area, n is the number of blades, and
Results and discussion
Experimental results
The experimental work aims to calculate torque values with different loads at different speed values and then calculating the torque and power coefficient values to study the performance of the turbine in different cases. These steps were done for six- and three-bladed EBWT. Graphs in Figures 18–20 show the power coefficient variation with the change in TSR for the different three twist angles.

Power coefficient versus TSR at 4–7 m/s for 6 blades at 20° twist angle.

Power coefficient versus TSR at 4–7 m/s for 6 blades at 25° twist angle.

Power coefficient versus TSR at 4–7 m/s for 6 blades at 30°twist angle.
The 20° twist angle shows the best performance among the two other twist angles while the 30° has the lowest power coefficient.
The maximum power coefficient for the 20° twist angle is 0.15 at TSR 1 with an applied load of 250 g with error 10% up and down. The maximum Cp for the 25° twist angle is 0.10 around TSR 1 with an applied load of 150 g with error 10% up and down. While the maximum Cp for the 30° twist angle is 0.07 at TSR 0.8 with an applied load of 150 g with error 10% up and down.
The power coefficient shown in JJH Paulides et al. for the EBWT was achieved at 12 m/s and with different diameter values. The calculated Reynolds number is 8.12154 × 10⁵ for 1 m diameter and 12 m/s, 16.33 × 10⁵ for the 2 m diameter and 12 m/s, and 1.58 × 10⁵ for the 0.335 m diameter and 7 m/s.
Figure 21 shows a comparison between measured power coefficient for the three twist angle cases studied in this work. The figure confirms that the 20° twist angle produces the best power coefficient for the examined range of TSRs.

Power coefficient versus TSR at 7 m/s for different twist angles.
By repeating the same experiments for the three-bladed Energy Ball wind turbine; which is the only case with symmetric distance between blades for the used prototype, it was found that the 25° and 30° twist angle turbines start to rotate at 6 m/s while the 20° rotates at 5 m/s with a small torque. The resulted power coefficient does not exceed 0.3%, and results are shown in Figure 22.

Power coefficient versus TSR at 4–7 m/s for 3 blades at 20° twist angle.
Figure 23 shows the comparison of power coefficient (Cp) at different TSRs for six- and three-bladed EBWT at 7 m/s. As shown in the figure, the power coefficient for six-bladed EBWT gives better performance than that of the three-bladed EBWT. The experimental results confirm that the two main important factors to increase the EBWT efficiency are the blade’s twist angle and the number of blades.

Power coefficient versus TSR at different TSRs for 20° three-bladed EBWT at 7 m/s.
Numerical results
Getting to the numerical results indicates that the turbine’s geometry highly affects the pressure difference produced, which is shown by extracting torque values when shifting the blade’s rotation point along the X-axis. The model shown in Figure 24 is the nearest geometry to the real manufactured one.

Nearest 3D geometry to manufactured model.
Torque prediction
Studying power coefficient at different wind speeds for 20° twist angle turbine, starting speed 2.5 m/s, 4 m/s, and 6 m/s in the range from 29 to 500 r/min, shows positive correlation between rotational speed and torque that causes the increase in power coefficient until the maximum torque occurs and then the moment of the blade starts gradually to decline when the angular speed is rising for all different velocities of air. In addition, if the speed of air increased the tendency of a force to rotate the blade would be increased which lead to revolving the blade faster with a higher power. Figure 25 shows that by increasing the airspeed, the resultant force acting on the blades tends to increase the rotational speed of blades with a higher power. Declining of torque curve for each inlet wind speed indicated the decrease in blade’s moment after a certain number of rotations.

Computational torque versus angular speed at different inlet speed velocities for six-bladed 20° EBWT.
Solidity effect
The numerical study of solidity effect was tested for the EBWT with a twist angle of 20° at 4 m/s, with different TSRs. In all cases, torque coefficient values are calculated for 5000 iterations and became constant in the last 1000 iterations. The solidity percentage for a different number of blades was calculated by substituting in equation (13) and the results values are shown in Table 5.
Solidity percentage for the different number of blades.
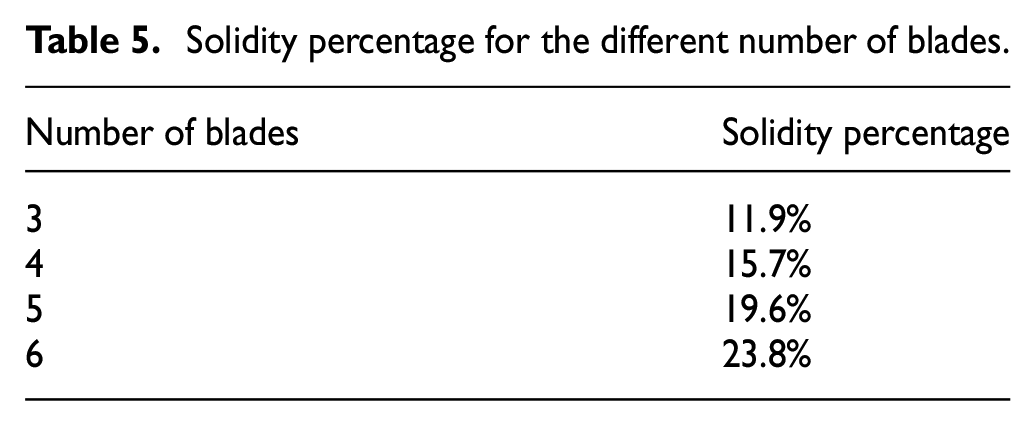
The torque and power coefficient values for a different number of blades are calculated and presented in Figure 26, which shows that the four-bladed EBWT with 15.5% solidity gives higher efficiency at 1.8 TSR while the six-bladed EBWT gives relatively high efficiency (13.3%) at unity TSR. These values can help in choosing the better number of blades according to the application used.

Power coefficient versus tip speed ratio for the different number of blades.
It can be concluded that increasing the number of blades, the solidity ratio gives 30% higher torque coefficient for the same twist angle. However, the highest torque coefficient value is plotted around unity TSR for the six-bladed turbine, and it is achieved at 40% higher TSR to be reached at 2.2 TSR for the three-bladed turbine.
Reynolds number effect
The power coefficient curve for the 20° twist angle model gives the same profile tendency for different inlet wind speeds. Some turbines generate high efficiency in case of high wind speed, so it gives high rotor efficiency at high TSR range like modern urban usage three-blade and Darrieus blade type wind turbines, 4 the EBWT shows relatively high rotor efficiency and aerodynamic performance compared to the other blades in lower TSR range. Figure 27 also indicates that Reynolds number has a small effect on EBWT performance.

Cp–tip speed ratio with respect to the wind velocity for 20° six-bladed EBWT.
Pressure contours
The pressure contours in Figure 28 show the formation of the stagnation point at the front nose of the turbine and the formation of a negative pressure region inside the energy ball, especially in the region behind the cone. The size of the negative pressure region inside the ball increases with the increase in TSR from 0.2 to 0.8 and decreases for λ = 1.0.

Pressure contours around six-bladed 20° EBWT at (a) 0.2, (b) 0.8, and (c) 1 TSR with inlet velocity of 4 m/s.
The negative pressure contributes to sucking more air mass to flow into the ball and hence increases the power generated. It was shown in the previous section that the peak power coefficient for this configuration occurs at unity λ, after which power coefficient drops again.
Velocity contours
The velocity magnitude contours in Figure 29 show the formation of high-velocity regions especially behind the turbines’ blades and the formation of the low-velocity region behind the turbine’s nose. The figure also shows that the low-velocity region becomes wider with the increase in the TSR and the increased velocity region is concentrated behind the turbines’ blades at high TSRs. At higher TSRs, the blades blockage effect increases, and a larger wake is formed that can affect air flowing through the turbine. The contours also show that the air velocity increases behind the turbines’ blades and decreases in the region behind the cone and parallel to the shaft until it reaches zero value.

Velocity contours around six-bladed 20° EBWT at (a) 0.2, (b) 0.8, and (c)1 TSR.
The following observations are made on contour figures:
The formation of stagnation points in front of the turbine’s cone.
Formation of a negative pressure region behind the turbine’s cone (inside the spherical shape).
Formation of a low-velocity region parallels to the turbine’s shaft.
Formation of the high-velocity region behind the blade’s curvature.
To illustrate the pressure and velocity distribution and the interaction between the upstream and inside the sphere region velocities due to the venturi effect caused by the turbine’s design, a line was drawn across the EBWT in the upper half of the turbine with the shown coordinates in Table 6.
Pressure and velocity line coordinates.

The examined case is with an inlet velocity 4 m/s, 55 r/min mesh motion solution. The pressure and velocity distributions are shown for the drawn line. The line is drawn in the XY plane without any rotation in the Z direction and the point (0,0) is the center of the shaft as shown in Figure 30.

Illustration line for pressure and velocity distribution.
The pressure and velocity distribution across the illustration line are shown in Figure 31 with an inlet velocity 4 m/s and 55 r/min. The biggest value of the pressure represents the stagnation point in front of the turbine’s nose. This point has the maximum pressure value and minimum velocity value. This figure shows the pressure and velocity values up and downstream the turbine.

Pressure and velocity distribution across the distribution line with inlet velocity 4 m/s: (a) pressure distribution across the illustration line and (b) velocity distribution across the illustration line.
The pressure curve shows that the maximum value appears in front of the turbine and then it drops to its minimum negative value behind the blades. On the other hand, the velocity curve shows that velocity upstream the turbine is 3.5 m/s and then it increases till it reaches 4.7 m/s behind the blades.
Conclusion
After studying and analyzing all the yielded and calculated data, the main conclusions drawn from this study are summarized as follows:
EBWT with 20° twist angle and six blades provides better torque coefficient than the other tested twist angles.
The experimental power coefficient for 20° twist angle is 14% and occurs at a TSR close to 1.0. The lowest peak power coefficient is produced by 30° twist angle and occurs at unity TSR.
The experimental torque coefficient curves are high at low rotational speeds and decrease monotonically as the rotational speed increases.
The computational study shows that the four-bladed EBWT with 15.5% solidity produce better torque values than the other studied number of blades for 20° EBWT at 1.8 TSR.
The EBWT shows relatively high rotor efficiency and aerodynamic performance compared to the other blades at lower TSR range.
Energy ball blade’s effect on each other for the studied cases is very small.
From the experimental and numerical study, 30° blade twist angle and three-bladed EBWT give small torque values and a lower coefficient of performance than all studied cases.
From the experimental and computational study, it was concluded that the geometry deformation happens in real life from the effect of wind on the blades and highly affects the resultant values.
The velocity contours indicate the reality of proved theoretical approach and that EBWT has a Venturi effect on the flowing wind through the turbine.
The computational investigation of the obtained results determined the interaction between the upstream and inside the sphere region velocities due to the Venturi effect caused by the turbine’s blades.
Footnotes
Appendix 1
Acknowledgements
We express our appreciation to Prof. Ahmed El-Baz who provided us with many valuable consultations in both experimental and computational studies that greatly assisted the research.
Handling Editor: Dean Vučinić
Author contributions
E.E. prepared this manuscript. This study was carried out under the supervision of N.E., A.A.A.F., and T.A.E.-S. All authors carried out data analysis, discussed the results, and contributed to writing the paper.
Declaration of conflicting interests
The author(s) declared no potential conflicts of interest with respect to the research, authorship, and/or publication of this article.
Funding
The author(s) disclosed receipt of the following financial support for the research, authorship, and/or publication of this article: This study was supported by the British University in Egypt and the Center for Renewable Energy.