
Abstract
Pressure and vibration displacement value are relatively measured by 14 pressure sensors and 2 vibration sensors distributing inside the tank-type model axial flow pump device under different flow rates. By comparison, it is found that the pressure pulsation on the inlet of the impeller is the main cause of hydraulic induced vibration of the pump device, and it is found to have similar amplitude trend with the vertical vibration as the flow rates increases and large correlation coefficient with the horizontal vibration under high flow rates through time-domain analysis. By frequency-domain analysis, it is found that the main frequency of pressure pulsation is three multiplies of the shaft frequency, but it is one multiplies of vertical vibration, and it changes from one multiplies to three multiplies of horizontal vibration. Combining with the analysis of phase-flow rates characteristics of both pressure pulsation and vibration, it is concluded that, for the horizontal vibration, the frequency ingredient of one multiplies ranging from low to high flow rates and three multiplies removing from unstable and high flow rates zone are possibly induced by pressure pulsation on the inlet of impeller, while for the vertical vibration, the frequency ingredient of one multiplies under design flow rates and high flow rates are possibly induced by pressure pulsation on the inlet of impeller. Both the horizontal and vertical vibrations with frequency of two multiplies have little relationship with the pressure pulsation on the inlet of impeller.
Keywords
Introduction
The application of axial flow pump is extremely extensive and it plays a very important role in the national economy. The vibration of the axial pump device will affect the operational stability and even lead to major safety accidents in severe cases. C Brennen 1 divides pump vibration into three types of oscillations, global flow oscillation, local flow oscillation, and radial force and rotor dynamic force induced oscillation, and lists the typical frequency range of pump vibration problems. Shi et al. 2 and Chen et al. 3 consider that the axial flow pump device itself is a complex fluid-solid coupling vibration system, and point out that hydraulic excitation is an important factor in inducing device vibration. Research4–9 on pressure pulsation and unit vibration in centrifugal pump and turbine shows that the internal pressure pulsation of the pump is the main reason for inducing hydraulic excitation. Based on the large eddy simulation method, Wang et al. 10 analyzed the distribution of pressure pulsation in the axial flow pump under different working conditions, and the relationship between the pressure pulsation frequency and the shaft frequency of the impeller. Research11–13 shows that the rotator and static interference (RSI) between the impeller and the vane induces the pressure pulsation of the flow field at the outlet of the impeller, and the large pressure pulsation will be generated when the axial gap between the impeller and the vane is small. The flow-induced pulsation and vibration in hydraulic machinery are discussed in detail by P Drfler et al. 14 It is believed that the main causes of RSI are the potential flow and the wake. The non-viscous flow caused by the relative motion between the rotating impeller and the stationary vane would cause the potential flow, while the wake, which comes from the impeller, will generate the convection and impact during the process of entering into the vane. The vibration acceleration signals of the axial flow pump model device under different working conditions are dynamically measured and analyzed by Li et al., 15 and the variation of the root mean square (RMS) value of the vibration acceleration with the flow in a specific frequency domain is obtained. The intrinsic correlation between the pressure pulsation and vibration characteristics of the hydraulic model of the axial flow pump is studied through experiments by Zhang et al. 16 The research shows that, under different speed conditions, the main frequency domain of the pressure pulsation inside the axial flow pump is from 0 Hz to 8 multiplies of the shaft frequency, and the vibration frequency range of the axial flow pump is concentrated in the area from 0 Hz to 2 multiplies of the shaft frequency, and the main frequency are 1 and 2 multiplies of the shaft frequency. The frequency-domain trend of both vibration and pressure pulsation are basically the same in the range of 0 to 2 multiplies of shaft frequency, and the change of rotate speed has similar effects on both of them, indicating that pressure pulsation is an important excitation source for the vibration of the axial flow pump. Chen et al. 17 shows that the main frequency of pressure pulsation in the axial flow pump is one multiplies of the blade frequency on the condition of different blade numbers. The fluid excitation force is mainly concentrated in the blade passage portion. When the number of blades is reduced, the pressure pulsation of the fluid in the pump becomes stronger and enhanced the vibration induced by the flow. Zhao et al. 18 simulates the structural vibration response induced by the fluid pressure pulsation in the vertical axial flow pump by using the finite element analysis software, and the results show that the calculation method can be used to predict the vibration acceleration with blade frequency if the pressure pulsation is known, which also points out that if the number of sampling points is increased, then the sampling frequency is increased, and the recognition ability of the high frequency can be improved. Yuan 19 studies the fluid-solid coupling vibration characteristics of the blade of axial flow pump and indicates that the maximum equivalent stress in the blade appears on the water inlet side of the blade root, and the gradient of stress changes is large at this location, which is prone to fatigue damage. Meanwhile, there is also a certain equivalent stress on the outlet edge of the blade, so that this area becomes the most deformed part of the blade, which means that this area is the sensitive part of the blade vibration. It can be inferred that the blade vibration is the main reason of hydraulic excitation of axial flow pump.
However, due to the complex spatial shape of the axial flow pump blade, the force condition is particularly complicated under changing working conditions. It is difficult to directly measure the force fluctuations on the blade and displacements of the blade. And also, it is difficult to establish a mathematical model that can be analyzed and calculated, and accurately identify the vibration induced by the hydraulic excitation in all excitation sources. In this article, the pressure pulsation at different positions under different flow rates as well as the horizontal vibration displacement and vertical vibration displacement on the pump device are measured by the experimental method, and the main occurrence of pressure pulsation is found, followed by time-domain analysis and frequency-domain analysis. The correlation between pressure pulsation and vibration is obtained. The research results of the article have guiding significance for the further establishment of pressure pulsation and vibration-related mathematical models.
Experiment platform and analysis of pressure on different detection points
The model test was carried out in the high-precision hydraulic mechanical test system of the Key Laboratory of Hydraulic Power Engineering of Jiangsu Province in Yangzhou University. The test system is a closed circulation system. The diameter of the impeller is 0.3 m, the total length of the system is 60 m, the diameter of the pipeline is 0.5 m, and the system test accuracy is 0.39%. The flow rate is changed by controlling the valve opening degree to achieve measurement under different working conditions. The flow rate of the pump unit model was measured directly by using a DN400 electromagnetic flowmeter. As shown in Figure 1, the whole pump device discussed by this article is composed by (A) tank-type model axial flow pump device, (B) pressure detection device, and (C) vibration detection device. The tank-type model axial flow pump device, which is optimized by Shi et al. 20 through design of experiments (DOE) orthogonal test in order to precisely predict the performance of Jiepai Pumping Station, is composed of (a) inlet passage, (b) impeller, (c) guide vane, (d) outlet passage, (e) Shaft, and (f) flange. The pressure detection device is composed of 14 pressure sensors of CYG505, whose sampling frequency is 100 kHz, and the collector of SQQCP-USB-16. The rotation speed of the pump device referred in this article is 1150 r/min, so the axial frequency is 19.17 Hz. First of all, the general fault frequency analysis of rotating machinery should exceed eight times of the axial frequency, so the sampling frequency should be greater than 153.36 Hz. Second, according to the sampling theorem, when the highest frequency in the signal is less than the Nyquist frequency, which is half of the sampling frequency, the digital signal can completely retain the information in the original signal after sampling. Frequency components above or at the Nyquist frequency can cause aliasing. The research results of Yang 21 show that the highest frequency in the pressure pulsation and vibration signal of the research object does not exceed 600 Hz. Therefore, the 100 kHz pressure detecting device can guarantee that the signals are not distorted. The speed of horizontal vibration and vertical vibration are relatively measured by sensor VS068 and VS069, be collected by fault diagnosis instrument EN900, and at last be translated into displacement of vibration in each by once integral calculation. The distribution of 14 pressure sensors and 2 vibration sensors are expressed by yellow points, which are also shown in Figure 1. In this article, there are 14 pressure pulsation points, which are generally arranged according to the flow direction of the fluid. The purpose is to study the spatial distribution of the frequency components of the pressure pulsation along the flow direction and under different flow rates, so that the main pulsating frequency components and its appearance position can be found so as to screen the pressure pulsation excitation component in the vibration signal conveniently. The pressure pulsation measuring points on inlet horn tube, impeller chamber, and outlet horn tube are evenly arranged circumferentially, in order to detect the circumferential distribution uniformity of the pressure pulsation, and to investigate whether there is circumferential uneven flow. The axial flow pump device is a complex multi-degree of freedom system, and the vibration signal at any point on the device is a vector having amplitude, frequency, and phase angle. The vibration signal can be decomposed into three directions of X, Y, and Z in Cartesian coordinate system. In the previous model pump test, it was found that the connection of the pump device to the motor shaft often broke at the junction of the pump shaft and the motor shaft, indicating that the vibration amplitude is large here. In order to facilitate the installation of the vibration sensor, two vibration sensors are arranged at 90° in the flange near the junction to test the horizontal and vertical deformation of the device. The direction of water flow in the pump device is mainly in X direction and Z direction, but the hydraulic excitation factor in the Y direction is relatively small, so it can be ignored. Therefore, the acquisition signals from the two vibration measuring points can represent the vibration signals of the entire pump device.

Pump device and its pressure and vibration detection device: (A) tank-type model axial flow pump device ((a) inlet passage, (b) impeller, (c) guide vane, (d) outlet passage, (e) Shaft, and (f) flange), (B) pressure detection device, (C) vibration detection device, (D) bottom view of the position of pressure detection point, and (E) top view of the position of pressure detection point.
According to Shi et al.,
20
the design flow
Maximum peak to peek value on different test point under different flow rates.

As shown in Table 1, the maximum peak-to-peak value of pressure on point 5 and point 6 are much bigger than on any other pressure test points. This is due to the sensors malfunction, which has been verified by test. It is clear from the table that the pressure on the inlet of the impeller is dramatically improved and keep high around the impeller, and the peak-to-peak value significantly decreased as the flow rates increased, which is the same as the trend of vertical vibration on point 16. But the horizontal vibration on point 15 is almost the same under different flow, which is much smaller than vertical vibration. By comparing the pressure pulsation peak-to-peak value of 14 pressure pulsation measuring points under different flow rates, it is found that the pressure pulsating peak-to-peak value along the flow direction starts to rise sharply at the inlet of the impeller, so it is inferred that the turbulent pulsation is strongest in the impeller chamber, which is the main reason for the hydraulic excitation of the pump unit. Theoretically, the alternating positive and negative pressure generated by the blade during the rotation process will inevitably cause a large pressure pulsation, and the pressure pulse action of the impeller chamber is used for the blade and other easily vibrating flow parts, which will inevitably cause forced vibration. In addition, Yang 21 and Shi et al. 22 demonstrate the above conclusions by numerical simulation and experimental measurement analysis respectively. Therefore, the pressure pulsation measurement signals from point 7 and point 8, which are on the inlet of the impeller, can be used to study the correlation between pressure pulsation and vibration.
In order to find out the correlation between pressure pulsation and vibration of the pump device, this article puts the emphasis on the analysis of the pressure pulsation on the inlet of impeller, which are tested on point 7 and point 8, and vibration of the pump device, which are tested on point 15 and point 16.
Time-domain characteristic analysis of pressure and vibration displacement
The signals of pressure tested on point 7 and point 8 and the signals of displacement tested on point 15 and point 16 are shown in Figure 2. All the four signals are extracted from the same time period after the pump device operating stably, and the length of time period is four rotation cycles. It is clear from Figure 1 that the signals of displacement are smoother than them of pressure because they have been filtered inside the collector EN900, but the collector SQQCP-USB-16 outputs the data actually collected by sensor CYG505 at the sampling frequency of 100 kHz, which brings high-frequency acquisition noise into the signals.

Time-domain distributions of pressure and displacement under different flow at four points: (a) point 8, (b) point 7, (c) point 15, and (d) point 16.
Figure 2 shows that all the signals have obvious periodicity, although there are slight differences between different cycles. So, they can be treated as approximate stationary signal. By comparing (a) with (b), it is clear that both pressure amplitudes on point 7 and point 8 decrease as the flow rates increase, and during each circle of the two points there are three main fluctuations, the wavelength of which are almost the same, but the phases under different flow are quite different from each other.
On the contrary, (c) and (d) are very different from each other. Firstly, (d) shows that the displacement amplitude on point 16 decrease as the flow rates increase, which looks the same as the pressure amplitude on point 7 and point 8. However, the amplitude on point 16 changes slightly under different flow rates. Secondly, the number of the main fluctuation on point 15 changes from 1 to 3 as the flow rates increase. But it remains 1 on point 16 under most of the flow rates, and it only appears to be multiple fluctuations under the
By processing the data from Figure 1, the statistic of peak-to-peak value of the pressure on point 7 and point 8 and the displacement on point 15 and point 16 under confidence degree of 95% is shown in Figure 3(a), and the correlation coefficient between them is shown in Figure 3(b).

Feature comparing of four points based on time-domain distributions under different multiplies of rated flow: (a) peak-peak value under confidence degree of 95% and (b) correlation coefficient of pressure and vibration.
As shown in Figure 3(a), the peak-peak value of pressure on point 7 and point 8 are almost the same except for 200 Pa difference under the flow rates of

where
Figure 3(b) shows that the pressure on point 7 and point 8 have tiny difference on the correlation coefficient with vertical vibration displacement on point 16 under the same flow rates, with the maximum difference less than 0.1 under
By the time-domain analysis, we can infer from the pressure amplitude difference between point 7 and point 8 that there is uneven flow on the inlet of impeller. From the trend of amplitude with flow rates, the pressure on the inlet of impeller has obvious relationship with vertical vibration, and it has strong correlation in phase under the flow rates around
Frequency-domain characteristic analysis of pressure pulsation and vibration
The pulsation

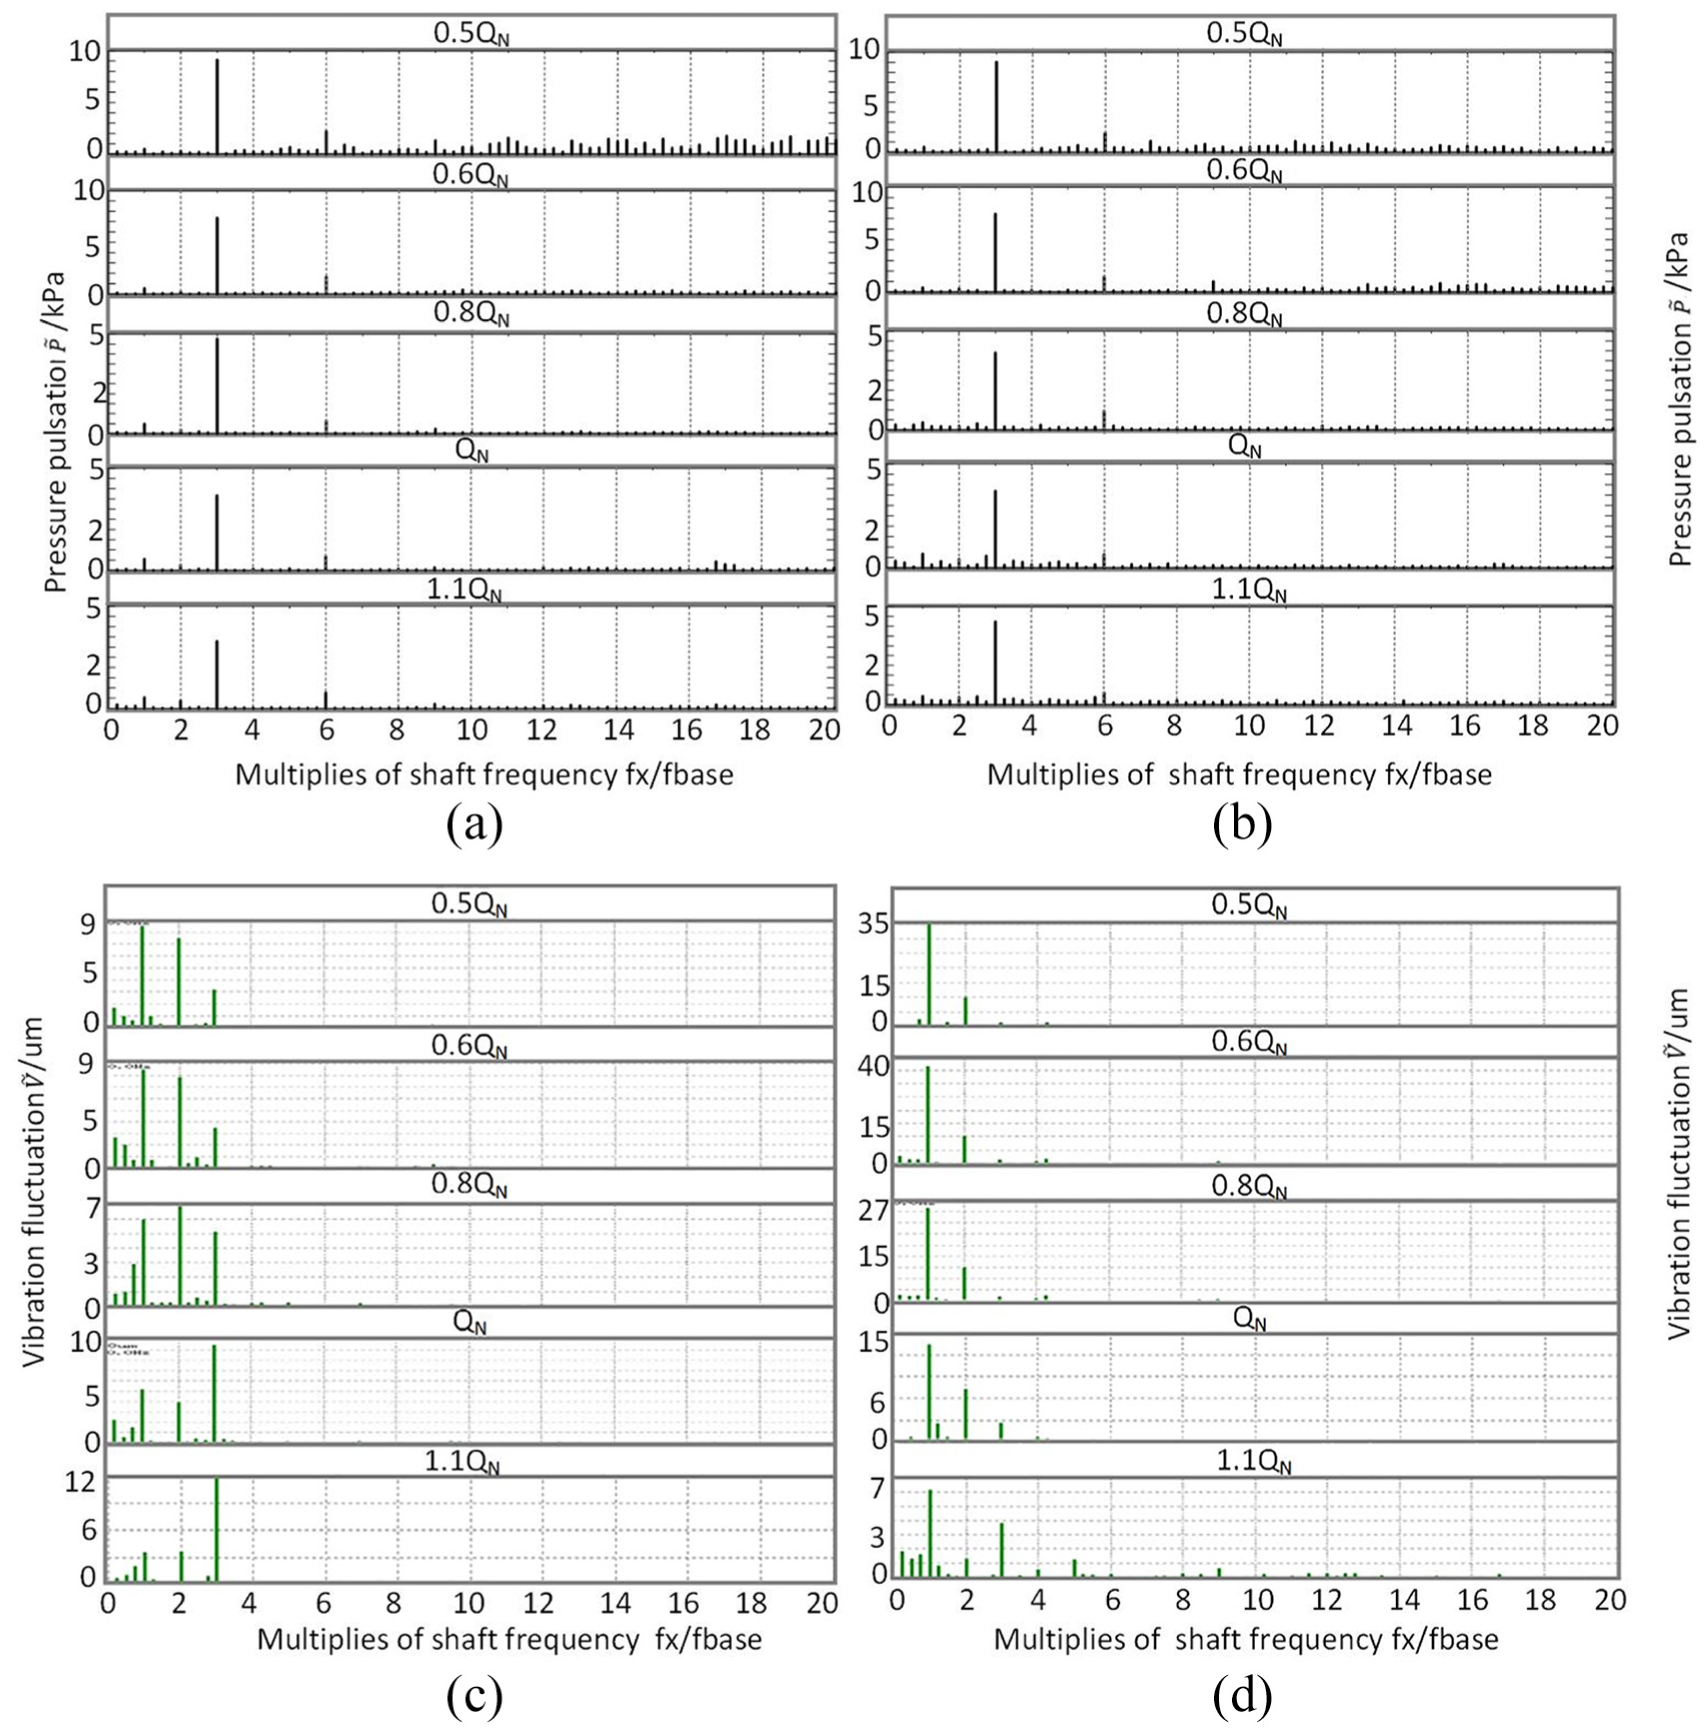
Frequency-domain distributions of pressure and vibration under different multiplies of QN at four monitoring points: (a) point 8, (b) point 7, (c) point 15, and (d) point 16.
The scales of the abscissa

The resolution of the frequency

By comparing (a) with (b) in Figure 4, it is clear that the main frequency, whose magnitude is the biggest, of both the pressure pulsation on point 7 and point 8 are
When moving to (c) and (d) in Figure 4, we could find that the main frequency of horizontal vibration on point 15 changes from
According to Figure 4,
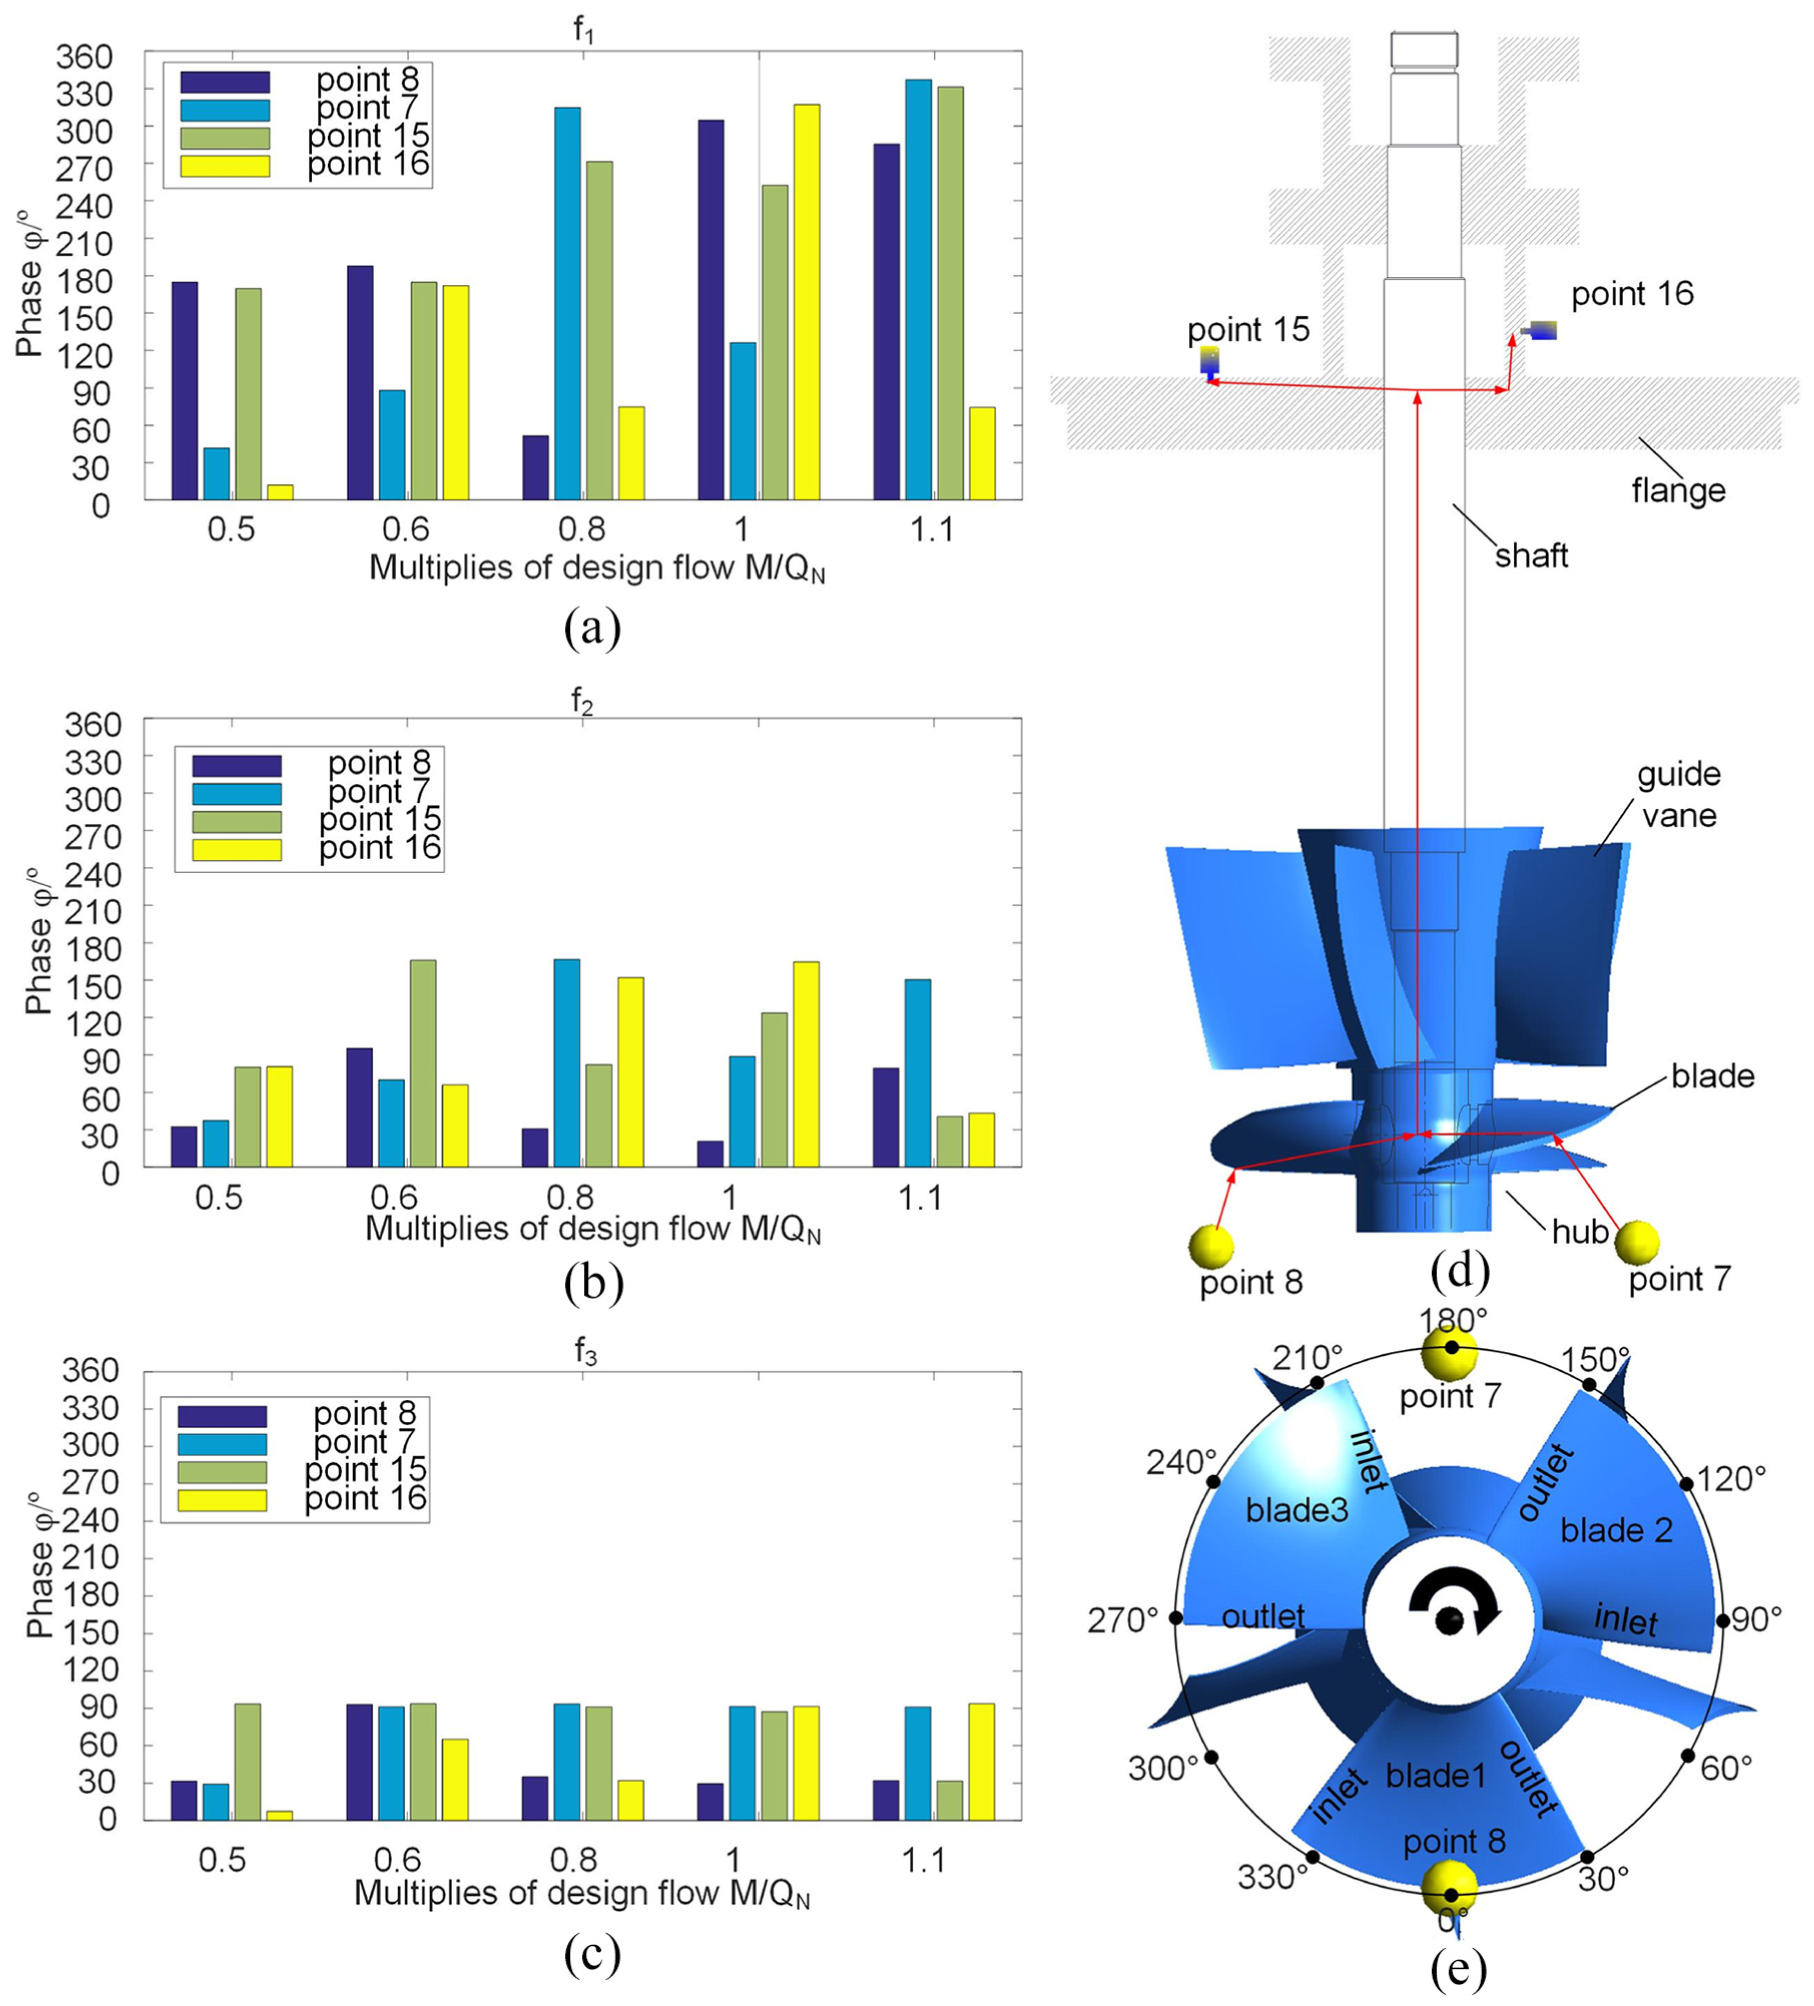
Phase character of four test points under different multiplies of design flow rates: (a) phase-flow character of one multiplies of base frequency, (b) phase-flow character of two multiplies of base frequency, (c) phase-flow character of three multiplies of base frequency, (d) schematic diagram of the left view of the pump device, and (e) schematic diagram of the bottom view of the impeller.
By combing (a) with (e) in Figure 5, we could find that the pressure pulsation with the frequency of
By using the same analysis method mentioned above, we can see from Figure 5(b) that the maximum of pressure pulsation with the frequency of
Discussion of correlation between pressure pulsation and vibration
Theoretically, the pressure pulsation on the water all around the blades of the impeller, containing the pulsation on point 7 and point 8, leads to the vibration of the blades, and then the vibration is transmitted to the flange through hub and shaft, which caused the vibration on point 15 and point 16. The route is shown in Figure 5(d) as the red arrow line, whose lengths are, respectively,
According to the description above, we can infer from Figure 5(a)–(c) that the vibration with the frequency of
Conclusion
In conclusion, the relationship between pressure pulsation and vibration can be summarized as follows:
The pulsation amplitude in the impeller is inferred to be the main cause of hydraulic excitation.
The slight difference between the signals on point 7 and point 8 indicates that there is small circumferential imbalance on the inlet of the impeller.
The vertical vibration has better amplitude correlation with pressure, while the correlation between pressure and horizontal vibration is reflected in phase and frequency.
The common main frequencies component of pressure pulsation and vibration are
The main frequency of pressure is
The main frequency of horizontal vibration shifts from
The horizontal vibration with frequency of
According to the vibration test data under different flow rates, it can be found that the horizontal vibration displacement is small overall, which is lower than
The correlation between pressure pulsation and vibration of the tank-type model axial flow pump device under different flow is concluded based on the model test and the analysis in both time-domain and frequency-domain. It can provide reference for the arrangement of pressure pulsation and vibration measurement points in practical engineering applications and can also provide reference for the flow control range in engineering. However, the precise signal characteristics of the axial pump unit vibration caused by pressure pulsation need to be given by further fluid–solid coupling numerical simulation.
Footnotes
Handling Editor: James Baldwin
Declaration of conflicting interests
The author(s) declared no potential conflicts of interest with respect to the research, authorship, and/or publication of this article.
Funding
The author(s) disclosed receipt of the following financial support for the research, authorship, and/or publication of this article: This research work was supported by the National Natural Science Foundation of China (Grant nos. 51376155, 51609210, and 61603325), Jiangsu Province Natural Science Funding (BK20160441 and BK20190914). Support for construction/assembly of the facility was also provided by the Hydrodynamic Engineering Laboratory of Jiangsu Province. University Natural Science Research Project of Jiangsu Province (19KJB570002), Yangzhou Natural Science Fund Project (YZ2018103) and Hydraulic Science and Technology Project of Jiangsu Province (2017031).