
Abstract
This research article presents a design parameter assessment technique for three-dimensional printed hip joint implants. A coupled experimental-simulation-based design technique, addressing minimum coating thickness, hardness, and adhesion requirements, is proposed for safe designs of individual three-dimensional printed hip joint implants. The purpose of this study is to analyze the mechanical properties of individual three-dimensional scanned hip joint human bone geometry through numerical simulation and relate these properties to hardness and adhesion values of bio-compatible coatings. The hardness and adhesion experimental results are discussed, which are then related to numerically obtained normal and shear stresses. Finite element analysis on original bone three-dimensional scanned model along with experimental results for investigating the minimum design requirements has not been reported before. Four ceramic coating materials, that is, alumina, CoCrMo, TiN, and zirconia, are discussed for each routine human physical activity. A comprehensive mesh independence study is conducted to ensure that the mesh has no effect on the variation of results. After finite element analysis, it was concluded that the pelvis bone can be taken as a vital bone for recommending design conditions. The finite element results are then coupled with experimental results as the maximum principal stress obtained from the finite element analysis is used to obtain minimum hardness requirements. Similarly, maximum shear stress obtained from the finite element analysis is used to obtain minimum adhesion requirements for three-dimensional printed implants. The coating thickness necessary to obtain minimum hardness and adhesion requirements is then predicted for TiN coating case.
Keywords
Introduction
Due to some diseases like osteoarthritis and osteoporosis and so on, different joints in the human body get affected. Every year, above 1 million arthroplasty surgeries are performed worldwide as a remedy, and these numbers are increasing exponentially. 1 Metals, ceramics, polymers, and composite materials are widely used for preparation of implants. The mechanical properties of implant material are of great significance. 2 For hip joint arthroplasty, the initial stability and stress shielding effects are very important; otherwise arthroplasty may lead to pain in thigh. The bone loss is also a factor which may compromise arthroplasty success. Human tissue and other internal conditions inside the human body may lead to corrosion in metallic implants. Improved geometries and computational tools can help to design better arthroplasty for provision of initial stability. 3 Different materials, that is, stainless steel, cobalt alloys, titanium, titanium and nickel alloys, tantalum and zirconium, and so on, offer good mechanical integrity in clinical/toxic conditions inside the human body. 4
Since the 1970s, ceramic materials are being used for manufacturing of arthritic hip and knee. Long life of prosthesis is usually obtained using ceramic materials as they offer good wear resistance and biocompatibility. Alumina (Al2O3) is an excellent ceramic for implant material as it offers good control over wear debris and provides good sliding properties.5,6 Cobalt and titanium–based alloys are also frequently used for the manufacturing of implants. 7 The coating is performed over the contact regions of the implants. The thickness of thin-film coatings is usually less than 25 µm. For zirconia and alumina, the coating thickness is considered about 5–10 µm, 8 whereas for TiN material, the thickness of coating is 8–10 µm. 9
DE Lunn et al. 10 studied and presented the functioning of a human hip joint and its equilibrium balancing while standing and performing daily routine physical activities. The kinetics and kinematics study of the hip joint, ankle, and knee joint during stair ascent and stair descent was performed by Protopapadaki et al. 11 The study of kinematics of the hip joint, ankle, and knee joint was performed by A Hemmerich et al., 12 for high-range motion during routine daily activities.
The calculations of contact forces generated on the hip joint while performing routine activities like level gait, sit to stand, stand to sit, stair ascent and descent, and carrying a load of 25 kg were performed by Varady et al. 13 Calculations for joint angles, that is, extension, flexion, abduction, and internal and external rotation, were performed by Diamond et al. 14 Study of joint mechanism for standing and sitting activities was performed by Lamontagne, 16 whereas Fotoohabadi et al. 15 elaborated the joint kinematics for standing from chair activity.
While performing in vivo experimental validation, it is very difficult to regenerate exact physical activity again and again. Finite element analysis is of great use in the aspect of biomechanics studies. Contact analysis for routine activities, like walking, standing from chair, and while bending the knee, was performed by Fuziansyah et al. Further, he compared the findings with the results obtained from experimentation. 17
Wear in bio-implants, controlled by several contributing variables, are considered among the major causes responsible for implant failure. There are several factors which contribute toward the wear mechanism. These factors include hardness, roughness, clearance, lubrication, contact stresses, nature of motion type, number of cycles, material oxidation, and surface abrasion as presented by Buford and Goswami. 18
Cardiff 19 developed a numerical model for study of loading and joint mechanism of the hip joint. According to Wu et al., 20 because of the differences in size, shape, and the structure of bones, the commercial femur implant designed on the basis of orthopedic data of Western population is not entirely compatible for Asian patients. Demange et al. 21 presented that patient-specific prosthesis can provide good clinical outcomes. Bio-printing and three-dimensional (3D) printing are the emerging techniques to manufacture implants, artificial bones, and other organs.22–24
Bergmann et al. 25 and Varady et al. 13 provide the most recent and reliable results on the forces produced on the hip joint during different activities. The use of these reliable datasets for 3D printed implants is almost non-existent in literature. The main purpose of this study is to present a comprehensive study on the design strategy for 3D printed implants using hip joint biomechanical data reported by Bergmann et al. 25 and Varady et al. 13 The design strategy includes the identification of normal and shear stress values for different human activity configurations on original hip bone 3D-scanned model and coupling obtained simulation values with hardness and scratch adhesion experimental results of bio-compatible coatings.
In this work, a design strategy is given for individual 3D printed hip joint implants. A coupled experimental and simulation–based technique is presented in this study. Computer-simulated experimentation is performed for the hip joint for routine physical activities like level gait, carrying a load of 25 kg, stand to sit, sit to stand, and stair ascent and descent. Comparison is established for four different materials, that is, alumina, zirconia, CoCrMo, and TiN. Geometry of the hip joint (pelvis and femur bones) is attained by 3D laser scanning. The point cloud data are obtained, and from these point cloud data, the 3D CAD model and 3D CAD assemblies (associated with different physical activities) are prepared. Using ANSYS Static Structural module, stress analysis is performed for four different biocompatible coating materials, that is, alumina, cobalt–chromium–molybdenum, titanium nitride, and zirconia. From the results of computer-simulated experimentation, maximum principle stress and maximum shear stress values are obtained. Experimental results of TiN coatings have been discussed for the design strategy to obtain minimum coating thickness, hardness, and adhesion values.
Modeling and simulation methodology
Geometry and orientation
The model of the femur bone and the pelvis bone of the human hip joint was obtained by 3D laser scanning. The accuracy of the available 3D laser scanning equipment was ±0.005 mm. The point cloud data obtained for the femur and pelvis bones from 3D laser scanning had 2.2 million and 1.8 million points, respectively. The surface was generated from the point cloud data using Geomagic Software. Subsequently, a solid model was obtained. The point cloud data and corresponding solid models are shown in Figure 1.
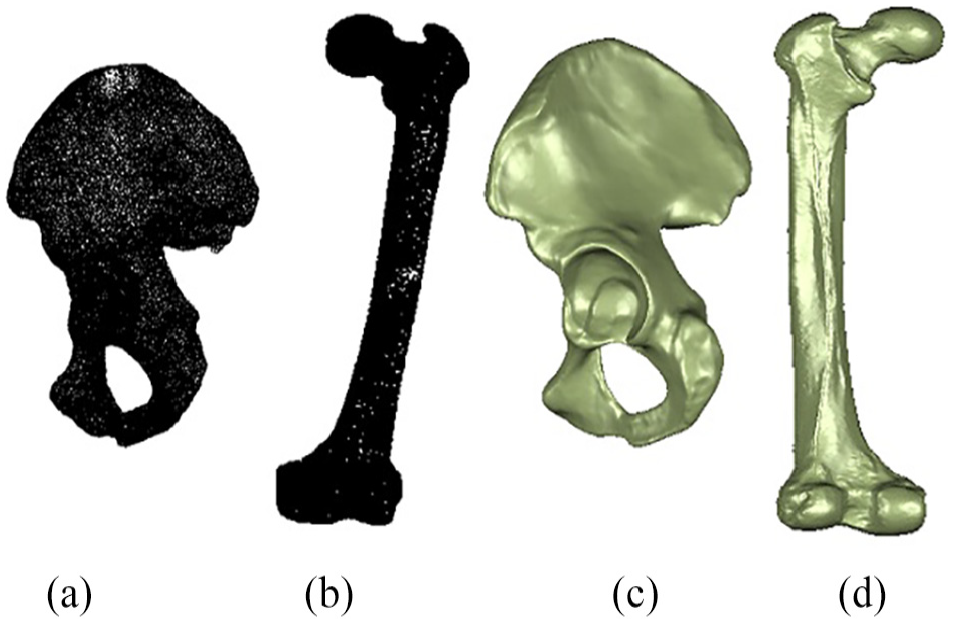
Point cloud data for the (a) pelvis and (b) femur and solid model of the (c) pelvis and (d) femur.
The computer-simulated experimentation was employed to analyze six different routine physical activities, that is, (1) carrying load of 25 kg, (2) level gait, (3) sit to stand, (4) stand to sit, (5) stair ascent, and (6) stair descent. 26 The angles between the pelvis and femur bones, that is, flexion, extension, abduction, adduction, internal rotation, and external rotation, reported by Olivecrona et al. 27 were used in creating the assemblies. The joint reaction forces for each activity were acquired from Varady et al. 13 using “WebPlotDigitizer.” 28 The maximum, minimum, and average output force values for each activity are summarized in Table 1.
Force components and joint angles for maximum, minimum, and average force condition for six activities.

NA: not available.
The assemblies of pelvis and femur bones were created by using PTC Creo Parametric (version 2.0). The pelvis bone was oriented in the standard position by defining the Mckibbin plane and the center edge angle as recommended by Olivecrona et al. 27 The Mckibbin plane was lined up with the XY plane as shown in Figure 2.

(a) Mckibbin plane, (b) center edge angle, (c) XY is the coronal plane, (d) YZ is the sagittal plane, and (e) ZX is the transverse plane.
For identification of joint angles, transverse and longitudinal axes are defined on the femur bone. The longitudinal axis passes along the stem of the femur bone, whereas the transverse axis passes through the ball of the femur bone as shown in Figure 3. The hip joint angular orientations were created by specifying the angles between the axis (longitudinal and transverse) and the three orthogonal planes. The angular orientations of the femur bone with respect to the pelvis were applied for analysis for each activity. The angular orientations of the femur bone is given in Table 1 and illustrated in Figure 4. The flexion/extension angles were defined as the angle between the longitudinal axis and the XY plane. The abduction/adduction angles were defined as the angle between the longitudinal axis and YZ plane. For internal and external rotation, angle was specified between the transverse axis and XY plane as shown in Figure 4. During the activities considered here, these angles continuously vary, and the values of these angles at maximum, minimum, and average force for each activity are given in Table 1.

(a) Longitudinal axis and (b) transverse axis.
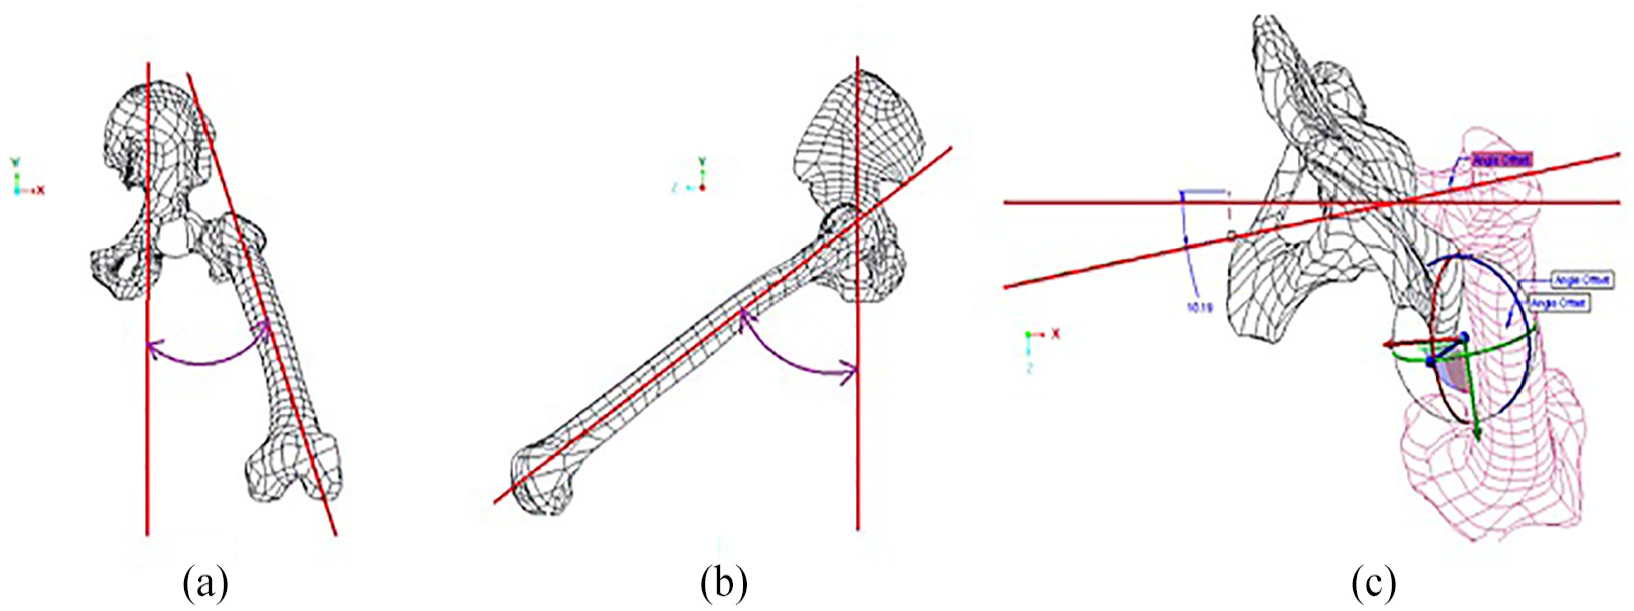
(a) Abduction/adduction, (b) flexion/extension, and (c) internal/external rotation.
The pelvis and femur bones are then assembled into the hip joint assembly for different activities in PTC Creo Parametric (version 2.0). The joint assemblies of level gait and sit to stand activity are shown in Figure 5 as an example.

Joint assembly for level gait and sit to stand.
Figure 6 indicates location and orientation of each applied force for six physical activities and maximum applied force case. The magnitude of each applied force is given in Table 1. The standard orientation and location of applied force is defined with respect to the Mckibbin plane (x’ and y’) as the force co-ordinate system Figure 6(a). The origin of applied force is always maintained at the middle of the femur bone head which ensures proper transfer of load from the femur bone head to pelvis bone.13,29 When the femur bone is aligned with respect to the pelvis bone to obtain certain physical activity orientation, the force co-ordinate system is also transformed to retain the orientation of the force co-ordinate system with respect to each location point of the femur bone as in Figure 6(a). The orientation of the femur and pelvis bones for six physical activities (maximum force case) with force co-ordinate transformation is given in Figure 6(c)–(h). The x, y, and z component of force is applied as reactive force with respect to the force co-ordinate system. Total 104 different numerical simulation configurations are being studied in this research work. Table 1 indicates 26 force configurations which are applied on each material. The results discussed in the “Results and discussion” section only contain six force configurations (maximum force configuration for each activity) for each material as all remaining 20 configurations per material give non-critical results.

(a, b) Force co-ordinate system with respect to the Mckibbin plane and (c–h) force co-ordinate system transformation with respect to the Mckibbin plane for six physical activities (maximum force case).
Material properties
The numerical analysis is carried out using four different coating materials, that is, titanium nitride (TiN), alumina (Al2O3), zirconium (ZrO2), and cobalt–chromium–molybdenum (CoCrMo). The properties of these materials are given in Table 2. All selected materials offer suitable biological, mechanical, and tribological properties for artificial implants.30–35 The 3D model of the hip joint was imported in ANSYS Static Structural for the structural analysis. The material definitions given to the femur bone and pelvis bone are given in Table 2, which are thin-film coating mechanical properties. The femur and pelvis bone is simulated as single material for each material case.
Mechanical properties of coating materials.

Meshing and boundary condition
Boundary conditions and associated forces were applied on model in ANSYS Static Structural. The displacement value of zero was applied on points A, B, and C in the x, y, and z direction 37 as shown in Figure 7. The effects of gravitational and centrifugal forces are neglected as combined contribution of these forces is less than 5% of total contact force at the hip joint. 38

Boundary conditions.
Stress analysis for all four materials and each activity, that is, level gait, carry load, sit to stand, stand to sit, stair ascent, and stair descent, was performed in ANSYS Static Structural. A comprehensive mesh independence study was carried out using four-node tetrahedron elements as recommended by MR Abdul-Kadir et al. 39 The joint between the femur head and pelvis acetabulum is given the definition of spherical joint along with no separation boundary condition for contact elements.19,40 The polyethylene liner is usually inserted between the femur head and pelvis acetabulum during hip joint arthroplasty, but when the hip joint implant fails due to the liner, then in case of total liner failure, only metal-to-metal contact exists.41,42 Therefore, the femur head and pelvis acetabulum are in direct contact in these numerical simulations. The localized mesh sizing was performed on the contact area of the pelvis and femur bones. 43 Element size at the contact region was reduced gradually from 12 to 0.35 mm for mesh independence study. Reduction in mesh size of contact area is shown in Figure 8.

Sample of mesh refinement used for mesh independence study.
The results of mesh independence study are shown in Figure 9(a)–(d). The element size was reduced gradually until the percentage relative error reached below 2%, as recommended by Doyle and McGloughlin. 44 The mesh configuration selected for the analysis contains approximately 65 × 105 tetrahedral elements. This configuration is selected because the results are not significantly varying with the increased number of elements as shown in Figure 9(a)–(d).

Mesh convergence results for (a) maximum principle stress—pelvis, (b) maximum principle stress—femur, (c) maximum shear stress—pelvis, and (d) maximum shear stress—femur.
Assessment of the scratch adhesion requirement for tribo-mechanical ceramic coatings
The adhesion of the tribo-mechanical ceramic coatings of implants is generally assessed by the scratch adhesion test. 45 The vertical load at the point at which the coating is completely delaminated from the substrate is marked as critical load L c in Figure 10(a). Corresponding to this critical load point, there is a value of shear force and a frictional force. This frictional force is measured as the product of the coefficient of friction (µ) and the critical load. 46 The experimental frictional force of a coating on implant can be compared with the numerically estimated shear force. The progressively increasing load in a scratch adhesion test applied through a stylus results in a constant increase in the coefficient of friction as the penetration depth keeps on increasing. The product of instantaneous values of the coefficient of friction and the applied load at the time of complete delamination of the coating is measured as experimental critical frictional force as given in the right side of equation (6). The shear stress before this critical point is within the elastic range of coating. The equivalent of this experimental frictional force can be calculated as the shear force F s by multiplying the maximum value of the numerically estimated shear stress with the contact area between the scratch test stylus and thin-film coating as shown in the middle of equation (6). The contact area depends upon the shape of the stylus and thickness of the coating. By using the recommended thickness and the standard geometry of Rockwell C scale styluses, the contact area can be calculated from equation (4). A schematic diagram representing the geometry of the Rockwell C scale styluses and the contact area of the thin film during the scratch test is shown in Figure 11.

(a) Scratch test schematics and (b) geometry of stylus.

Contact area between stylus and thin-film coating.
The equation of a triangle extended from the center of the nose circle of the stylus to the contact area is given by Pythagorean Theorem

where r = radius of the stylus tip (r = 100 μm, for the Rockwell Scale C stylus).
The film will be completely delaminated at the critical load L c when the stylus penetration in the thin film is equal to film thickness. Therefore, the y-coordinate of the contact area is equal to the difference between the radius of the stylus tip and the thickness of the thin film as shown in Figure 11

where t is the recommended film thickness and y c is the y-coordinate of the contact area.
The radius of contact area (R) is basically x-coordinate of the shaded circle as shown in Figure 11. The radius of the contact area is given by solving equations (1) and (2)

By using equation (3), the contact area A c becomes

Therefore, the shear force F s may be calculated as

As the shear stress corresponds to shear force, therefore, for safe coating design

where μ is the coefficient of friction and L c is the adhesion load on the thin films to the substrates. 47 Note that this shear force is equal to the frictional force which is the product of the coefficient of friction (μ) and critical load (L c ) during scratch adhesion testing. 48
Results and discussion
The 3D stress analysis for all materials and all conditions (for maximum force, minimum force, and average force conditions as presented in Table 1) was performed in ANSYS Static Structure.
The principle stress and shear stress for the contact areas of the pelvis and femur bones were considered in this study. Hardness in gigapascals can be directly related to normal stresses, 49 whereas maximum shear force values are closely related to adhesion requirement of coating material. As an example, the maximum principle stress values for both the pelvis and femur bones for one activity (i.e. carrying load of 25 kg) are shown in Figure 12.

(a) Maximum principle stress (pelvis), (b) maximum principle stress (femur), (c) maximum shear stress (pelvis), and (d) maximum shear stress (femur) (sample stress results).
Hardness requirements
Figure 12 indicates that the maximum principle stress for the surface of interest, that is, the contact portion between the pelvis and femur, is greater on the pelvis surface. This behavior is observed for all materials and activities. Therefore, the pelvis bone can be considered for obtaining a minimum design criterion. The results obtained for maximum principle stresses for the pelvis bone for all materials and activities are shown in Figure 13. The routine physical activities and maximum principle stress values are indicated on abscissa and ordinate, respectively.
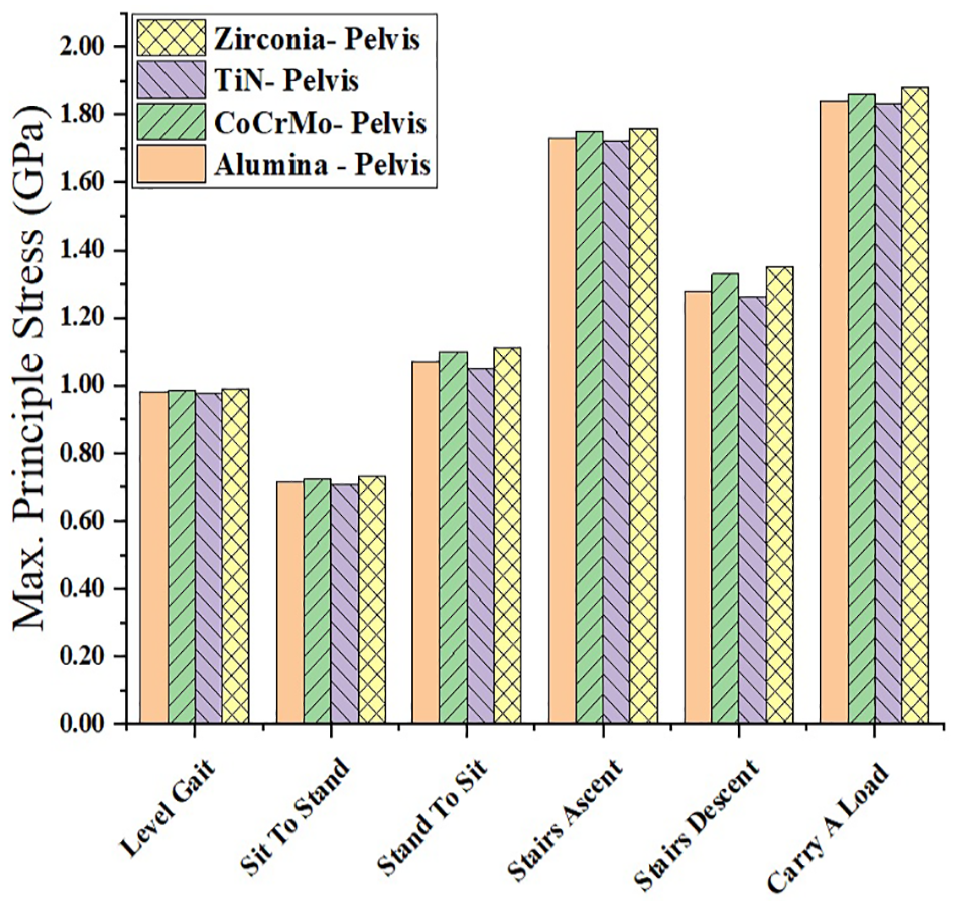
Maximum principal stress on the pelvis bone for different materials and activities.
The maximum principle stress versus routine physical activity for the pelvis bone is shown in Figure 13. For all the activities, the stress exhibited by the material appears to be dependent on the Poisson ratio which can be directly correlated with the hardness of a material. 50 The peak value for maximum principle stress (1.88 GPa) was found for zirconia for the activity carrying load of 25 kg.
A comprehensive summary of maximum principle stress values for the pelvis bone obtained from numerical simulations, for each material and all activities, are presented in Table 3. The maximum principle stress can be considered as the minimum hardness possessed by the surface coating of the implant material. Based on the results of analyses reported in Table 3, any wear-resistant coatings on 3D printed hip joint implants must at least possess 1.88 GPa (for zirconia) of hardness as measured in the case of activity carrying a load of 25 kg. The results by Anderson et al. 51 indicate that the stress in the hip joint depends upon the morphology of contact portion; high stress values for stair ascent case are reported for four surface morphologies of the six surface morphologies. This explains high stress values for stair ascent case with respect to stair descent case and stand to sit case with respect to sit to stand case.
The maximum principle stress values (which can be equated to the hardness value required for the coatings) for the pelvis bone for all the activities.

Adhesion requirements
Figure 12 indicates that the maximum shear stress for the surface of interest, that is, the contact portion between the pelvis and femur, is also greater on the pelvis surface. This behavior is observed for all materials and activities. Therefore, the pelvis bone can be considered for obtaining a minimum design criterion. The results obtained for maximum shear stresses for the pelvis bone for all materials, activities, and conditions are shown in Figure 14. The routine physical activities and maximum shear stress values are indicated on abscissa and ordinate, respectively.

Maximum shear stress on the pelvis bone for different materials and activities.
The maximum shear stress versus routine physical activity for the pelvis bone is shown in Figure 14. The peak value for maximum shear stress (1.05 GPa) was found for TiN for the activity carrying load of 25 kg. The maximum shear stress values can be related to shear modulus values of the material.
The maximum shear stress values can be closely related with adhesion of the coating with substrate. 48 The coating adhesion is dependent on the substrate surface roughness value, coefficient of friction at the joint interface, and resultant frictional force. Experimentally, it has been demonstrated that adhesion and hardness of the coating materials that define their wear resistance are thickness-dependent phenomenon. 52
Adhesion is experimentally measured by scratch testing (micro/nano) using Rockwell C scale styluses. A typical Rockwell C scale stylus geometry and scratch test schematics are shown in Figure 11. 53 The load value at which the complete coating is removed from the substrate is denoted as critical load L c . The values of shear force (calculated by equations (1)–(6) based on shear stress values from numerical simulations) can be equated to the experimentally established frictional force value which is a product of the friction coefficient (µ) and critical load (Table 4). 46 The values used for the calculation of contact area are given in Table 4.
The values used for the calculation of contact area.

Table 5 summarizes the shear force values for all materials (Al2O3, CoCrMo, TiN, and ZrO2) and all the activities. For considered thickness, the peak value of frictional force (2.1462 N) was found for TiN for the activity carrying load at 25 kg
Maximum shear stresses and recommended shear force for the pelvis (for considered coating thickness of 3.3 µm).

Based on the above discussion, it is clear that the hardness of the coating, normal deformation, and adhesion are important mechanical properties to consider for mechanical as well as biological performance of implants. Baseline design criteria can be obtained from the simulation results. The recommendations for artificial implant coatings can be made by combining simulation and experimentation.
TiN is the most researched material as a wear-resistant coating for tribo-mechanical and bio tribo-mechanical applications.54–58 Extensive experimental research is available that reports the mechanical and tribological properties of TiN with respect to critical variables like roughness of the substrate material and coating thickness for prosthesis and mechanical applications.59–61 However, other materials like Al2O3, CoCrMo, and ZrO2 require a lot of research. Therefore, in order to demonstrate a design methodology for coating materials on 3D printed implants, we discuss TiN as a specific example.
Conventionally, the TiN coating thickness for implants is recommended to be of 8–10 µm. 9 Experimental investigations on different TiN coating thicknesses revealed that due to complex strain propagation during deposition of the coatings, some of the mechanical and tribological properties behave as two-level effects with respect to coating thickness values.62,63 Very recent studies on TiN coatings have revealed that hardness and adhesion of TiN coatings are maximum at a thickness of 3–3.5 µm, and their value tends to reduce if the coating grows thicker than this range. 63 Moreover, it is also a well-established fact that hardness and adhesion of the coatings are directly related with tribo-mechanical performance and biocompatibility of the implants. Our recently reported results 63 revealed that the 3.3-μm-thick TiN coating exhibits a maximum hardness value 16.585 GPa which is well above the minimum criteria set by the simulation results reported in Table 3 (minimum hardness should be 1.83 GPa).
Similarly, experimental investigations indicate that the TiN coatings of approximately 3–3.5 µm show promisingly good adhesion values.64–67 The adhesion frictional force in all these studies is above 10 N, and the scratch adhesion values of TiN coatings are well above the maximum friction force (2.14 N) obtained from simulation as shown in Table 5. The metallurgical coating industries are also showing similar trends in case of TiN coating thickness. One such example is of BryCoat incorporation which has a typical TiN coating thickness of 3 μm. 68 These experimental results63–67 along with 3D scanned bone simulations and analysis technique give the basic design criterion and a design strategy for any type of wear-resistant coatings in 3D printed implants.
Conclusion
In this research work, finite element analysis is performed on 3D scanned models of actual femur and pelvis bones, and four coating materials (Al2O3, CoCrMo, TiN, and ZrO2) are assigned for the consideration of femur–pelvis 3D printed bone implants. The analyses constitute six routine human physical activities.
The 3D scanned hip joint simulation results are presented on the basis of the most recent and reliable datasets obtained from Bergmann et al. and Varady et al.
The maximum principle stress and maximum shear stress values from computer-simulated experimentation can be taken as minimum hardness and adhesion value requirements for the femur–pelvis 3D printed implants.
The minimum coating thickness requirements on the bases of hardness and adhesion values can be predicted.
The simulation results for four materials indicate the peak value for maximum principle stress (1.88 GPa) was found for zirconia and the peak value for maximum shear stress (1.05 GPa) was found for TiN for the activity carrying load of 25 kg. The hardness and adhesion are found to be related to the Poisson ratio and shear modulus of the material, respectively.
A comprehensive technique for the assessment of the scratch adhesion requirement for tribo-mechanical ceramic coatings is presented. The experimental results for TiN are discussed to complete the thickness, hardness, and adhesion requirement prediction techniques.
These experimental results along with 3D scanned bone simulations and analysis technique give the basic design criterion and a design strategy for any type of coatings in 3D printed implants.
Experimental results coupled with simulation values indicate that 3.3-μm-thick TiN coating gives a hardness value of 16.585 GPa which gives a high factor of safety as minimum hardness required for TiN coating is 1.83 GPa in femur–pelvis 3D printed implant.
Similarly, experimental results indicate that the TiN coatings of approximately 3–3.5 µm give adhesion force well above the minimum adhesion value for femur–pelvis 3D printed implant.
The experimental results discussed in this research work along with simulation values and baseline design criteria suggest that 8- to 10-µm TiN coating thickness on the implant surface is unnecessary; in fact, this thickness reduces mechanical and tribological properties of implants. Instead 3–3.5 µm of coating thickness is more tribo-mechanically suitable for femur–pelvis 3D printed implants.
Footnotes
Handling Editor: Assunta Andreozzi
Data availability
The readers can request the corresponding author for the data underlying the findings of the study.
Declaration of conflicting interests
The author(s) declared no potential conflicts of interest with respect to the research, authorship, and/or publication of this article.
Funding
The author(s) received no financial support for the research, authorship, and/or publication of this article.