
Abstract
The running-in process is considered an essential aspect of the comprehensive wear process. The phenomenon of running-in occurs during the initial stages of wear in the prosthetic hip joint. Within the field of tribology, the running-in phenomenon of the hip joint pertains to the mechanism by which the contact surfaces of the artificial hip joint components are adjusted and a suitable lubricating film is formed. During the process of hip joint running-in, there is an interaction between the metal surface of the ball and the joint cup, which results in adjustments being made until a steady state is achieved. The achievement of desirable wear existence and reliable performance of artificial hip joint components are reliant upon the tribological running-in of the hip joint. Despite the establishment of current modeling approaches, there remains a significant lack of understanding concerning running-in wear, particularly the metal-on-polyethylene (MoP) articulations in dual-mobility cups (DMC). An essential aspect to consider is the running-in phase of the dual mobility component. The present study employed finite element analysis to investigate the running-in behavior of dual mobility cups, wherein femoral head components were matched with polyethylene liners of varying thicknesses. The analysis of the running-in phase was conducted during the normal gait cycle. The results of this investigation may be utilized to design a dual-mobility prosthetic hip joint that exhibits minimal running-in wear.
Introduction
The dual-mobility (DM) artificial hip joint has been employed in clinical settings for more than four decades and continues to be utilized owing to its potential for reduced wear and robust stability. The present articulation was conceptualized by Gilles Bousquet in 1974 through the amalgamation of Charnley’s small head theory 1 and the McKee-Farrar principle 2 with large heads. Empirical evidence suggests that incorporating two distinct forms of articulation, small and large, positively impacts stability. 3 Based on findings from various researchers,4–7 the dual-mobility cup demonstrates superior efficacy in preventing dislocation and reducing instability compared to the unipolar cup in in-vivo circumstances.
As per the 19th Annual Report released by the National Joint Registry 8 from the United Kingdom, excluding Scotland, there has been a significant surge in the utilization of DMC from 2013 to 2021. In 2021, the implementation of DMC was observed to have been utilized in approximately 1300 procedures. According to the 2022 annual report of the Australian Orthopedic Association National Joint Replacement Registry, 9 it was found that bipolar hip replacement was more frequently utilized than unipolar modular in the year 2021. The employment of unipolar monoblocks was experiencing a downward trend.
Various methods can be employed to evaluate the wear on hip joint prostheses, such as utilizing a hip simulator through experimentation or employing computational techniques that involve finite element analysis (FEA). 10 FEA modeling can enable the determination of phenomena that are not directly observable within the body.
The running-in phase denotes a transitional interval during which the friction and wear between two surfaces that are new and unworn and are in contact with each other exhibit significant fluctuations over a period of time. 11 According to Jeng et al., 12 the running-in phase reduced the highest asperities, increasing the number of asperities in contact. Consequently, this enhances the surface’s load-carrying capacity. 13
The wear pattern of the prosthetic hip joint can be categorized into two discrete segments. According to research by Alvarez-Vera et al. 14 and Dowson, 15 the femoral head and acetabular cup were expected to experience initial wear up to approximately 1–2 million cycles in a hip joint simulator or 1–2 years within the human body. The above attribute was associated with a procedure commonly known as the “running-in” or “bedding-in” mechanism.
Some researchers have conducted finite element investigations concerning the wear of prosthetic hip joints, subsequently projecting the observed wear onto wear curves, including both linear and volumetric wear. The wear was suggested by Liu et al. 16 to be modeled as an exponential function of frictional effort. The research demonstrated significant improvements in computational predictions when assessing wear rate disparities within the range of 8%–25% for two distinct kinematic circumstances: those with a constant load direction and those with a variable load direction. The findings demonstrate the significant influence of both frictional work and contact pressure, highlighting the need to integrate both effectively into computer modeling to improve accuracy and effectiveness. The study by Jamari et al.17,18 examined the impact of surface texture on wear in total hip arthroplasty (THA). The simulation entailed the application of three-dimensional physiological loads on the hip joint under typical walking circumstances. The running-in phase was extended for up to 1 million cycles.
Hung et al. 19 suggested a numerical technique to examine the occurrence of wear in prosthetic hip joints. Various values of polyethylene wear rates were obtained for the established material combinations. However, it is essential to note that these values may not necessarily reflect the actual wear rates seen in vivo. Further debate on the wear mechanism involved in wear testing is needed to corroborate these findings. The findings of their study demonstrated that the polyethylene/ceramic combinations exhibited superior wear characteristics compared to the polyethylene/metal combinations. Similar wear tendencies in clinical and laboratory settings suggest that numerical simulation may provide equivalent results.
Di Puccio and Mattei 20 comprehensively analyze the biotribological aspects of hip replacements, including qualitative and quantitative aspects. The extensive discourse around the tribological characteristics of each kind of implant underscores the intricate interplay between friction, lubrication, and wear, making distinguishing one from the other difficult. Furthermore, the tribological properties are contingent upon other factors, including the specific system under investigation, the material properties (such as Young’s modulus and hardness), the geometric parameters (such as head diameter, clearance, and surface polish), the kinematic and loading conditions, as well as the kind of lubricant used.
As a result, the tribological situation in bearing types undergoes variations in friction, lubrication, and wear within a single activity and during the implant’s lifespan. These variations are influenced by factors such as patient characteristics, lifestyle, and the wear process itself, leading to ongoing modifications. These issues raise questions about the appropriateness of using in vitro testing for evaluating hip implants since simplified gait cycles may deviate significantly from the actual operating conditions experienced by the implant.
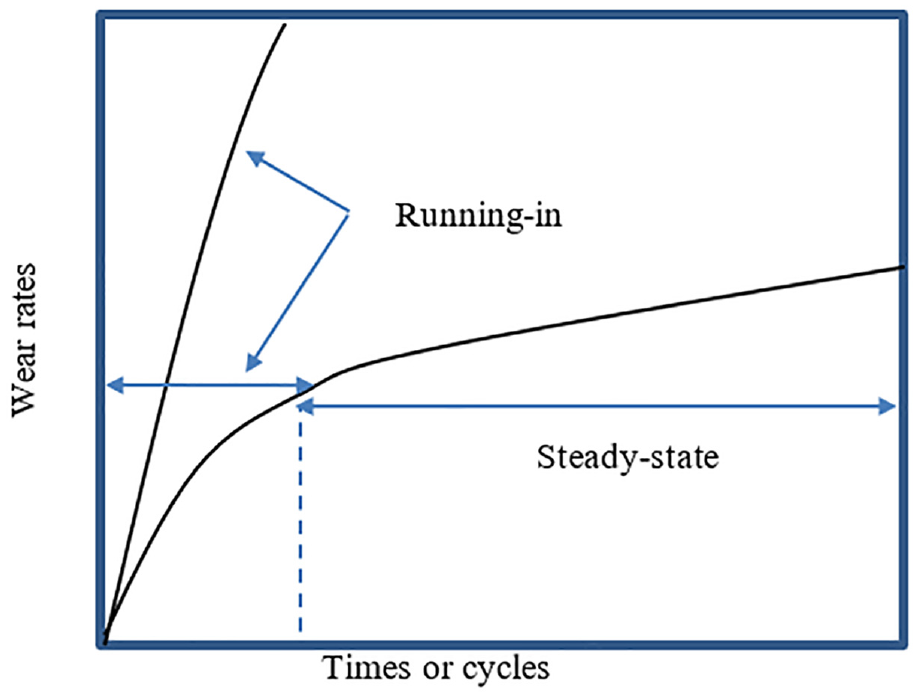
Following this specific phase’s conclusion, the deterioration level maintains a steady and generally minimal degree. The subsequent phase to running-in is denoted as steady-state, wherein a given tribological system attains a state of equilibrium characterized by a consistent and unchanging average dynamic coefficient of friction, a specific wear rate, and other particular features. 21 In a steady state, the tribological system undergoes a uniform level of wear, leading to an optimum state of functionality throughout its entire lifespan. The graphical depiction depicted in Figure 1 demonstrates the existence of two distinguishable wear regions.
In light of heightened information needs, notable advancements in computational wear modeling have occurred. As mentioned earlier, the tool is widely considered an essential instrument for implant designers engaged in preclinical investigations of novel implantable devices. The prominence of computational wear prediction is rising in both corporate and academic domains, indicating that this trend will persist. Computational wear models have the potential to enhance product design by facilitating the reduction of wear. Nonetheless, there are still uncertainties surrounding the topic of running-in wear, specifically with DMC models that utilize metal-on-polyethylene (MoP) articulations.
Previous research on wear has focused on single-mobility cups. 10 To date, no academic investigation has been conducted on the running-in behavior exhibited by the DMC. This investigation aimed to examine the running-in phenomenon of the DMC’s liner with different femoral head sizes and varying thicknesses of the inner liner. The present study investigated the running-in behavior during a typical walking cycle.
Materials and methods
The design consisted of four components: the acetabular cup, inner liner, outer liner (which served as a metal cover to minimize wear), and femoral head. An alternative design for a DM artificial hip joint (AHJ) introduced by the Center for Biomechanics, Biomaterials, Biomechatronics and Biosignal Processing (CBIOM3S), Department of Mechanical Engineering at Diponegoro University, Semarang, Indonesia. The Ministry of Law and Human Rights of the Republic of Indonesia granted patent number S00201703018 for this geometric shape. The difference lies in inserting a metal outer liner (SS316L) that protects the inner liner (UHMWPE) from excessive wear caused by friction with the acetabular cup. The outer liner adhered firmly to the inner liner without any friction. The friction occurred between the outer liner and the acetabular cup, made of metal in a metal-on-metal configuration. The simulation utilized the finite element (FE) software Abaqus 2020. The elastic modulus of SS316L was determined to be 200,000 MPa, whereas UHMWPE exhibited a significantly lower elastic modulus of 1,000 MPa. The materials SS316L and UHMWPE had Poisson’s ratios of 0.3 and 0.4, correspondingly. 24
The contact interaction in the Abaqus software was implemented through dissipated energy, unsymmetric matrix storage, and adaptive stabilization methods. The head-inner liner pair established contact by a surface-to-surface interaction, where the head served as the master surface, and the concave inner liner acted as the slave surface. The sliding formulation employed the concept of finite sliding. The outer liner and the acetabular cup pair underwent an identical procedure. The head-inner liner interaction exhibited tangential contact behavior with a friction coefficient of 0.1,25,26 whereas the outer-liner-acetabular cup pair demonstrated a friction coefficient of 0.6.27,28 All interactions’ stability was achieved using contact control with automatic stabilization and augmented Lagrange.
The femoral head’s diameters, commonly observed in prosthetic hip joints, were 22, 28, 32, 36, and 40 mm. The thickness of the inner liner varied between 5 and 12 mm. As per the findings of reference, 29 it is recommended that the distance between the inner liner and the head should be 150 μm, while the outer liner should maintain a distance of 50 μm from the cup. The thickness of the acetabular cup was measured to be 2 mm, while the outer liner had a thickness of 1 mm. The simulation assumed that all materials were homogeneous and exhibited elastic solid behavior. The femoral head was represented as an analytical rigid body to enhance the efficiency of FEA while maintaining the accuracy of results.
The prevalent options for meshing in volume-based geometric reconstruction include hexahedral and tetrahedral elements. The present study employed a butterfly hexahedral mesh model founded on the open cube box concept. The liner and the acetabular cup meshing were executed using eight-node structural hexahedron elements, specifically the C3D8R. 30 This approach obviates using a hybrid mesh comprising tetrahedral and hexahedral elements, which could potentially yield non-uniform stress concentrations. 29 The study conducted convergence analyses by employing hexahedral elements with a size of 0.8 mm. Figure 2 illustrates the FEA model of a DMC utilized in the present study.
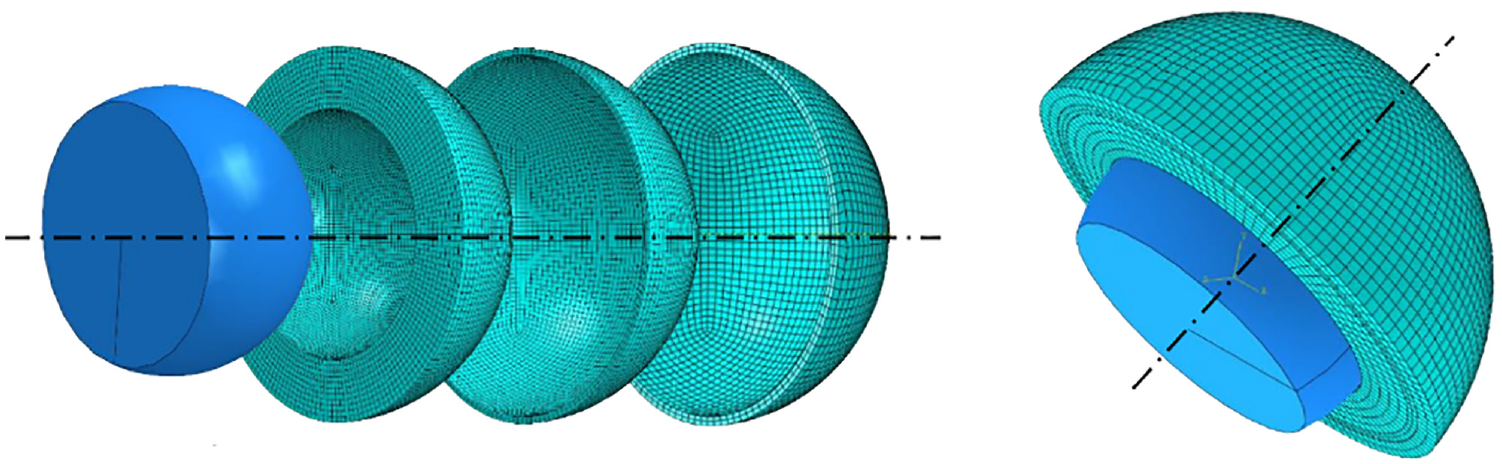
The FEA model of DMC. The butterfly hexahedral mesh model is used for the inner liner, outer liner, and acetabular cup, while the femoral head is treated as a rigid body. The DMC is set up at an angle of 45°.
The positioning of the cup and liner was anatomically optimal, with a 45-degree inclination and zero anteversion. 31 The center of the head served as the fixed Cartesian coordinate system’s origin, with coordinates denoted as (x, y, and z). As depicted in Figure 3, three distinct relative rotations may transpire among the interconnected segments of a spherical hip joint. The human body is capable of three fundamental movements: sagittal flexion and extension (FE), frontal adduction and abduction (AA), and horizontal internal and external rotation (IER). The movements, as mentioned earlier, were focused on the axes of medial-lateral (ML), anterior-posterior (AP), and proximal-distal (PD). 32
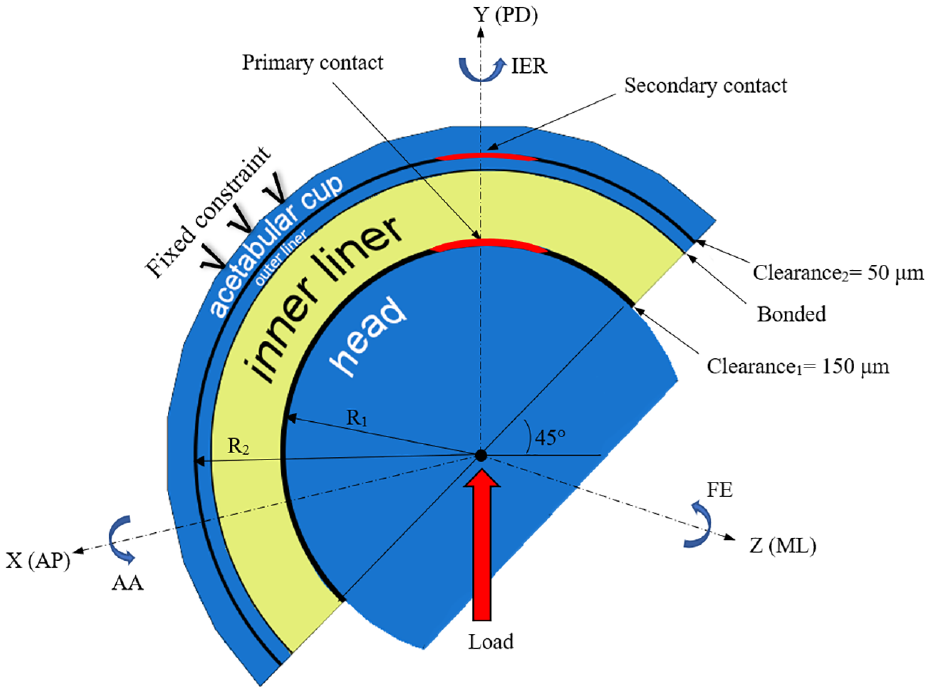
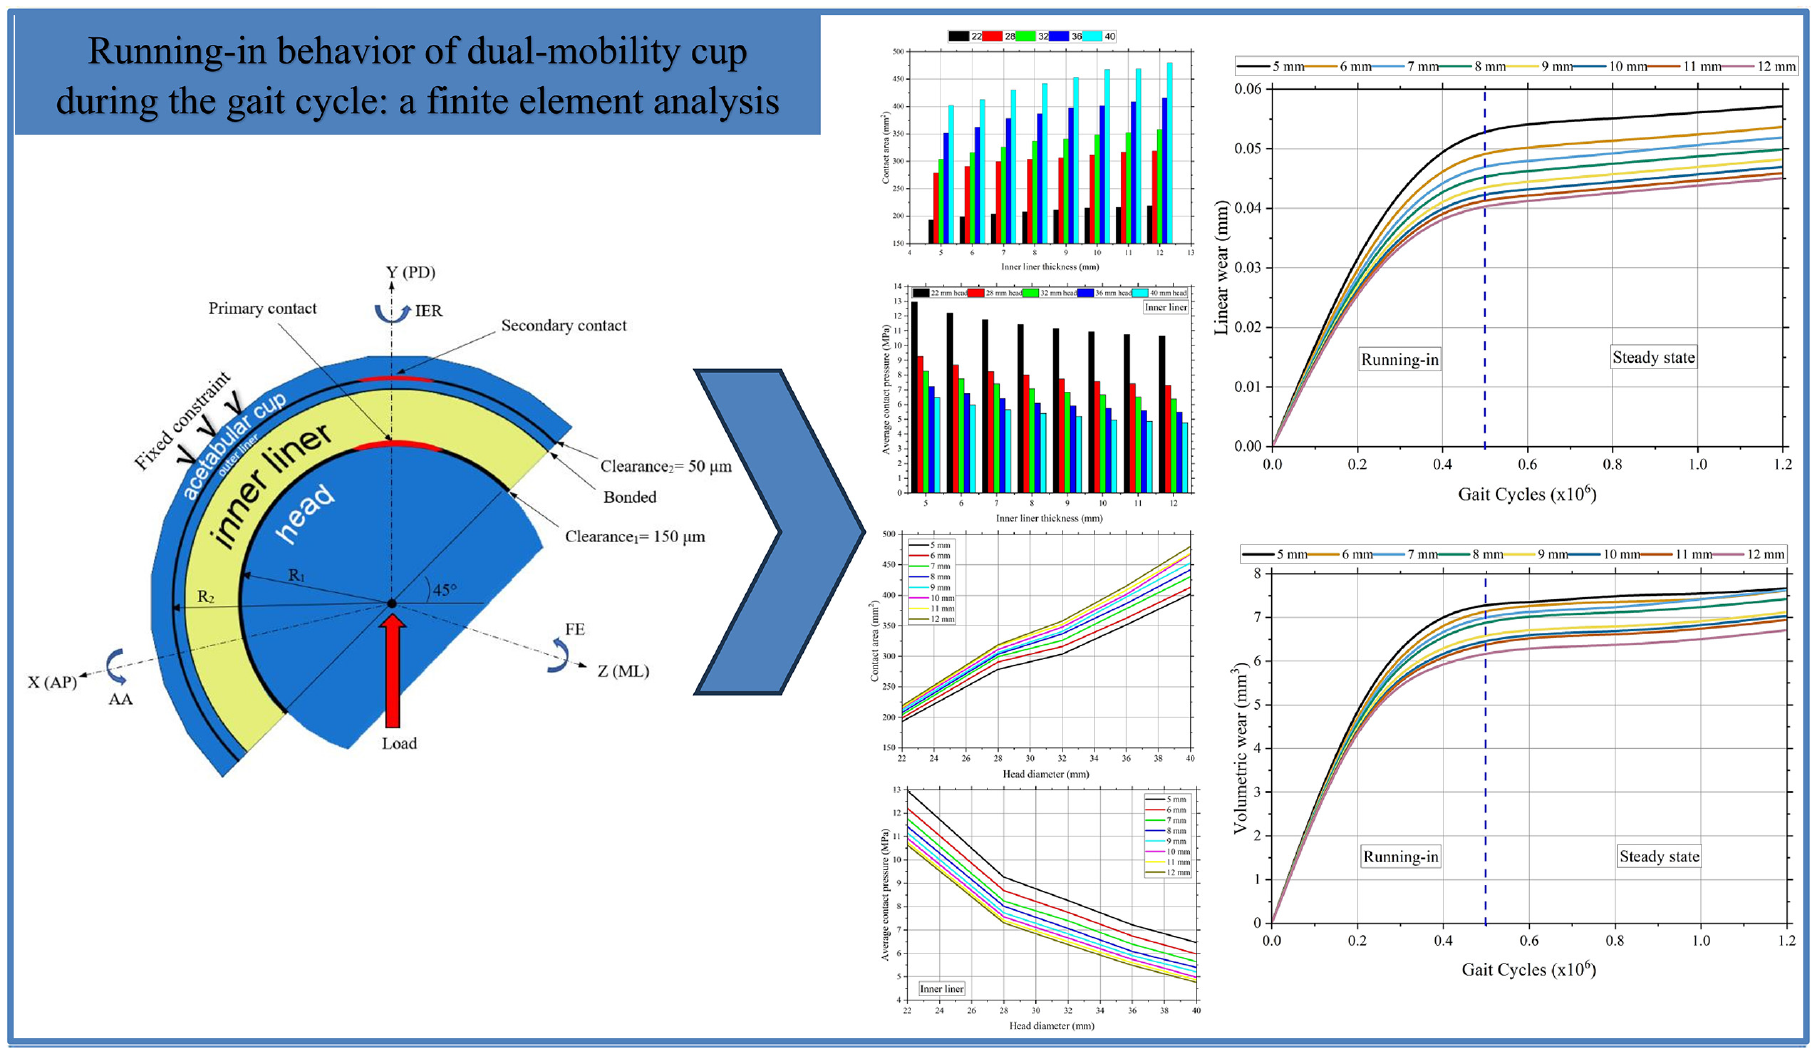
The DM hip joint reference frame. Load is applied to the reference point of the femoral head. Due to diametral clearance, the contact is non-conformal. Contact is limited to two distinct categories: primary and secondary contact. The external surface of the acetabular cup is constrained and exhibits immobility.
In the case of a sphere placed in a cup, as depicted in Figure 3, Hertz determined that the magnitude of the contact radius can be expressed as follows:
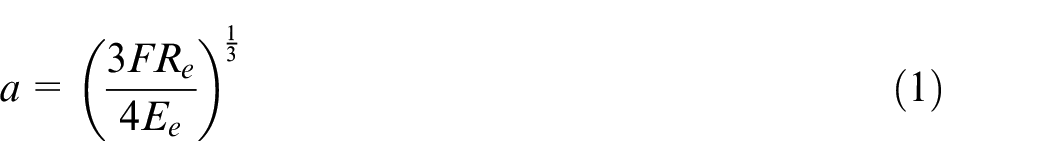
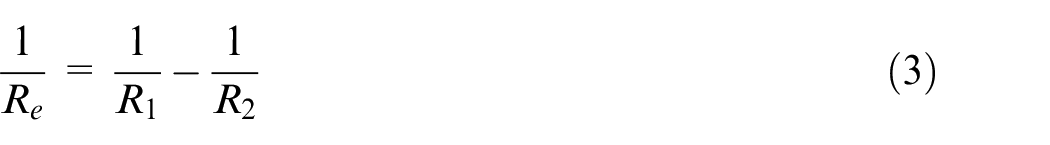
The load denoted by F (N) is accompanied by the equivalent Young’s modulus denoted by Ee (MPa) and the equivalent contacting radius denoted by Re (m), which are calculated from the given parameters:
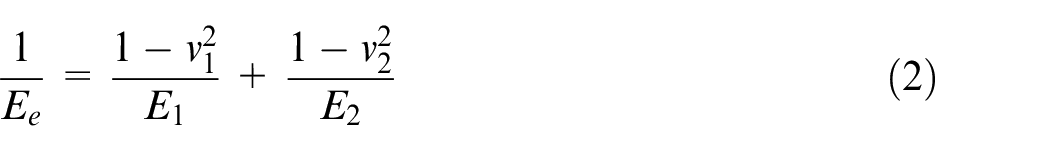
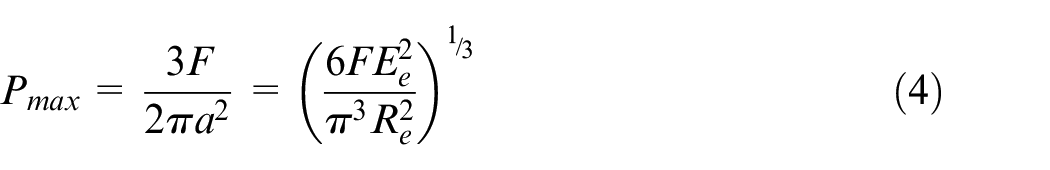
The variables E1, E2, v1, and v2 represent Young’s moduli and Poisson’s ratios of the respective bodies. The determination of the maximum contact pressure is accomplished by equation (4) 33 :
Archard’s 34 wear calculation is a widely used method for predicting the degree of wear that occurs on the surfaces of two components that come into contact with each other under typical conditions. Several studies15,35,36 utilized Archard’s wear equation to assess the extent of wear on the liner surface of the hip prosthesis. Nevertheless, under diverse conditions encompassing adhesive and abrasive scenarios, equation (5) has been shown to incorporate the wear volume Wv (mm3), load L (N), and sliding distance SL (m):

To determine the linear wear (WL) on a given surface, equation (5) can be adjusted by dividing both sides by an appropriate area, resulting in equation (6):

P denotes the contact pressure in megapascals (MPa) units, while Kw represents the wear coefficient. A set of wear coefficients was collected by Wang et al. 37 The current wear coefficient, Kw, on the sliding contact between SS316L and UHMWPE varies between 1 × 10⁻⁷ mm3/Nm 38 and 1 × 10⁻⁶ mm3/Nm. 39
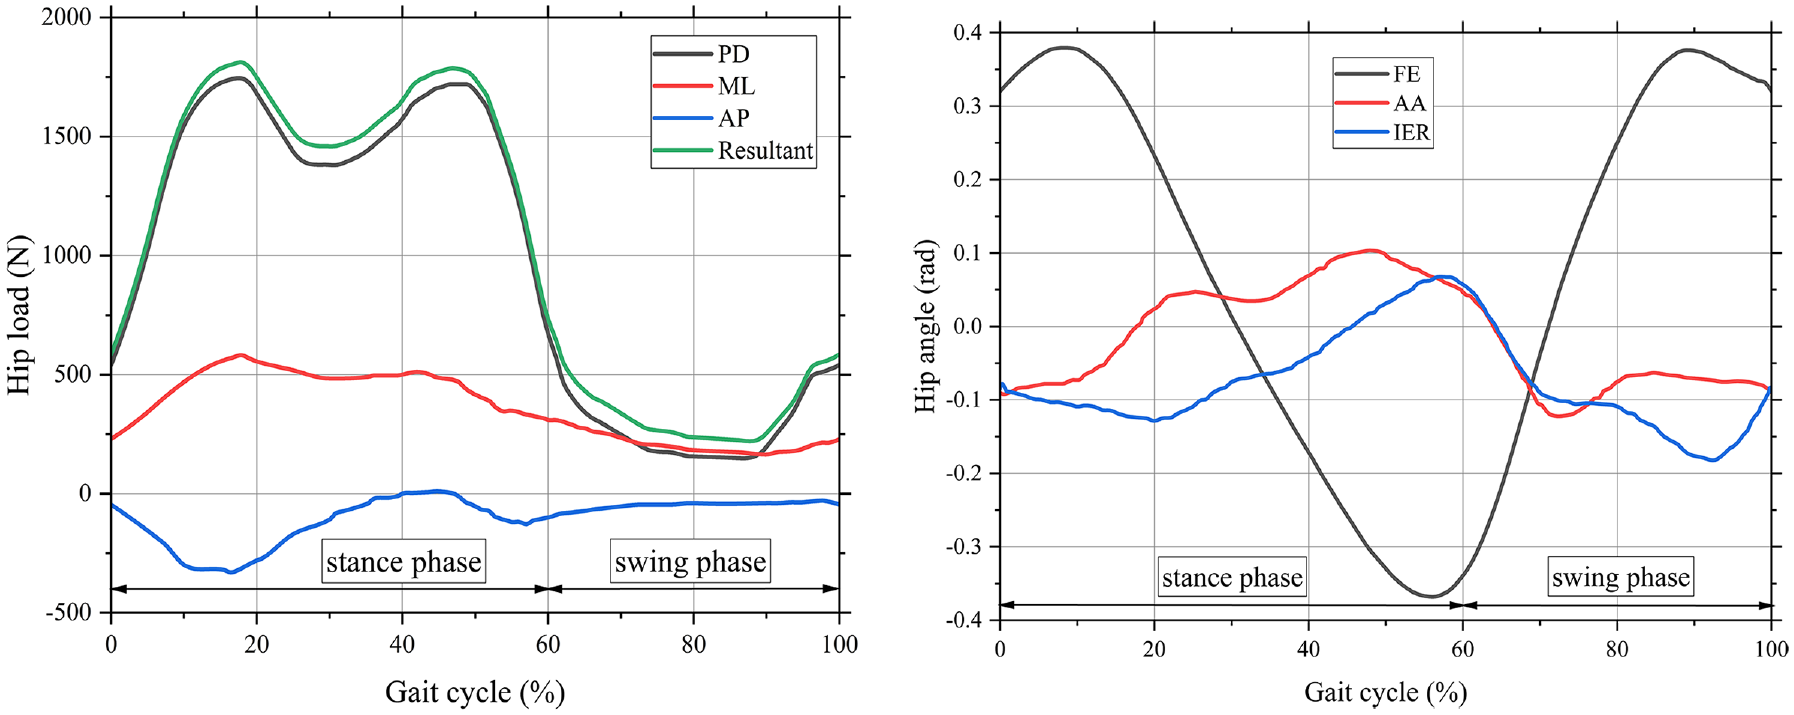
The utilization of the femoral head as a reference point for gait cycle loading conditions was initially proposed by Bergmann. 40 Figure 4 employs and replicates Bergmann’s depiction of the endogenous force exerted on the hip joint and the corresponding hip angle encountered by an individual during every instance of the gait cycle.32,41,42 The simulation utilizes millions of cycles (mc), with each mc representing a year in vivo, as stated in reference. 43
Results
FE validation
The FE model must first be validated for the simulation to provide reliable results. Contact pressure stress validity was confirmed by comparing the current study to the finding of Shankar and Nithyaprakash. 44 They used ANSYS to get contact pressure during gait. The maximum contact pressure reached 10.5 MPa in phase seven of the gait cycles. In the current study, the maximum contact pressure was 10.9 MPa. Figure 5 compares the current study to the investigation of Shankar and Nithyaprakash. The findings of this study were slightly higher, but they were acceptable because the difference was insignificant, 3.6%. The validation process to ensure that the contact algorithm used is correct and appropriate.
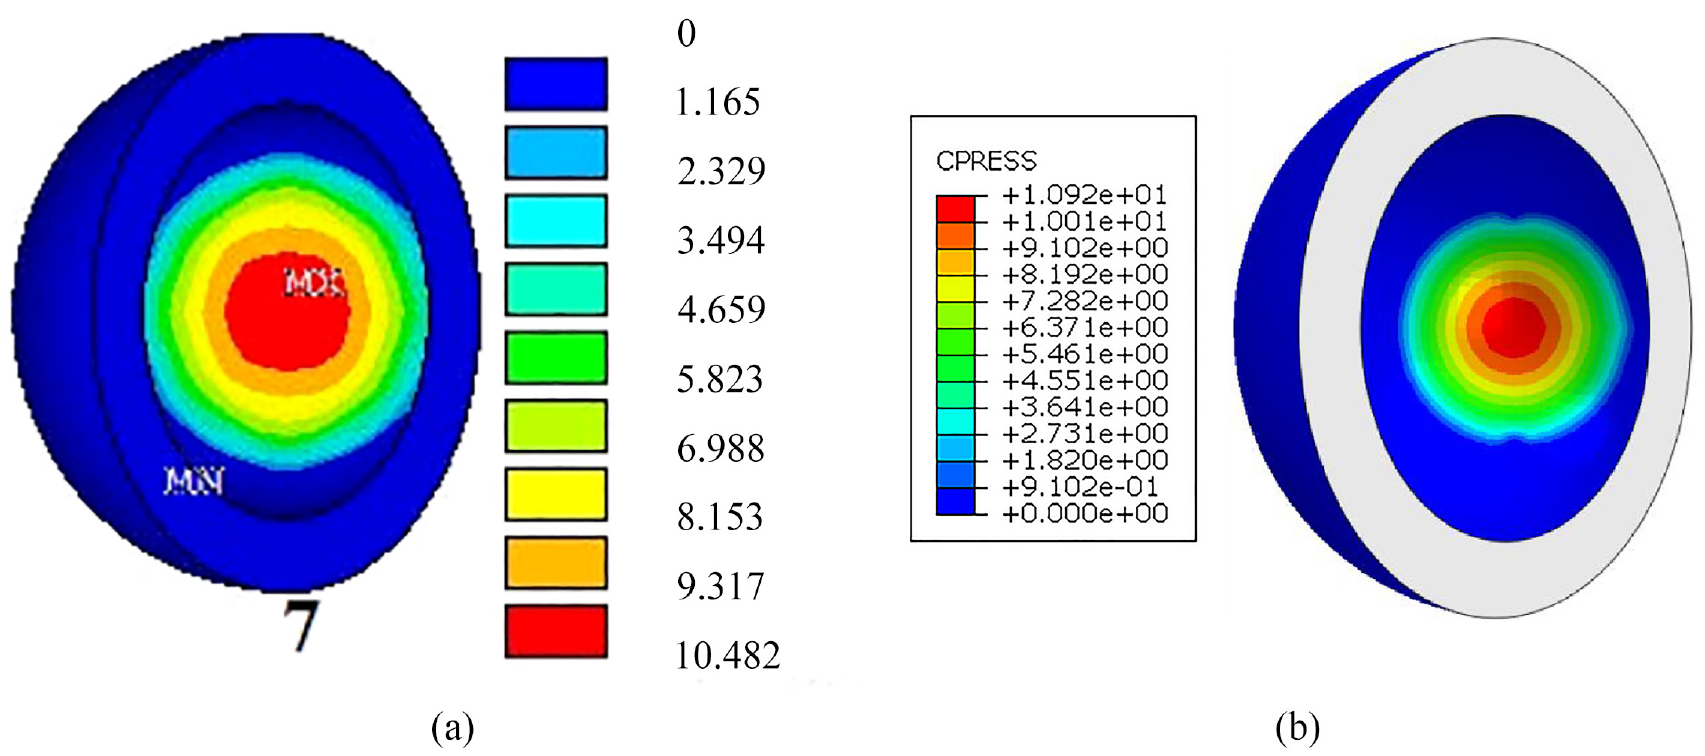
FE model validation: (a) Shankar and Nithyaprakash 44 and (b) current study. The difference in contact pressure is only 3.6%.
Contact area and contact pressure during the running-in period
The contact area was derived from the simulation outcomes using Abaqus. Figure 6(a) illustrates the contact area that arises on the inner liner during the running-in procedure. The graph indicates a significant correlation between the applied load and the contact area. The measurement of the contact areas is conducted for various inner liner thicknesses ranging from 5 to 12 mm. The relationship between the applied load and contact area is positively correlated. The contact area is expected to undergo a substantial increase throughout the running-in phase until it attains the condition of a steady state. In the interim, the thickness of the inner liner has a discernible impact on the contact area for head diameters 22, 28, 32, 36, and 40 mm, as depicted in Figure 6(b). As per Shen’s statement, 45 a positive correlation exists between the thickness of the inner liner and the magnitude of the contact area, and it is also in good agreement with equation (1). The contact area is observed to be the smallest on the inner liner, with a thickness of 5 mm, whereas the largest contact area is found on the liner, with a thickness of 12 mm. The contact area increases by 2.2% for each additional millimeter of inner liner thickness at the same head diameter.
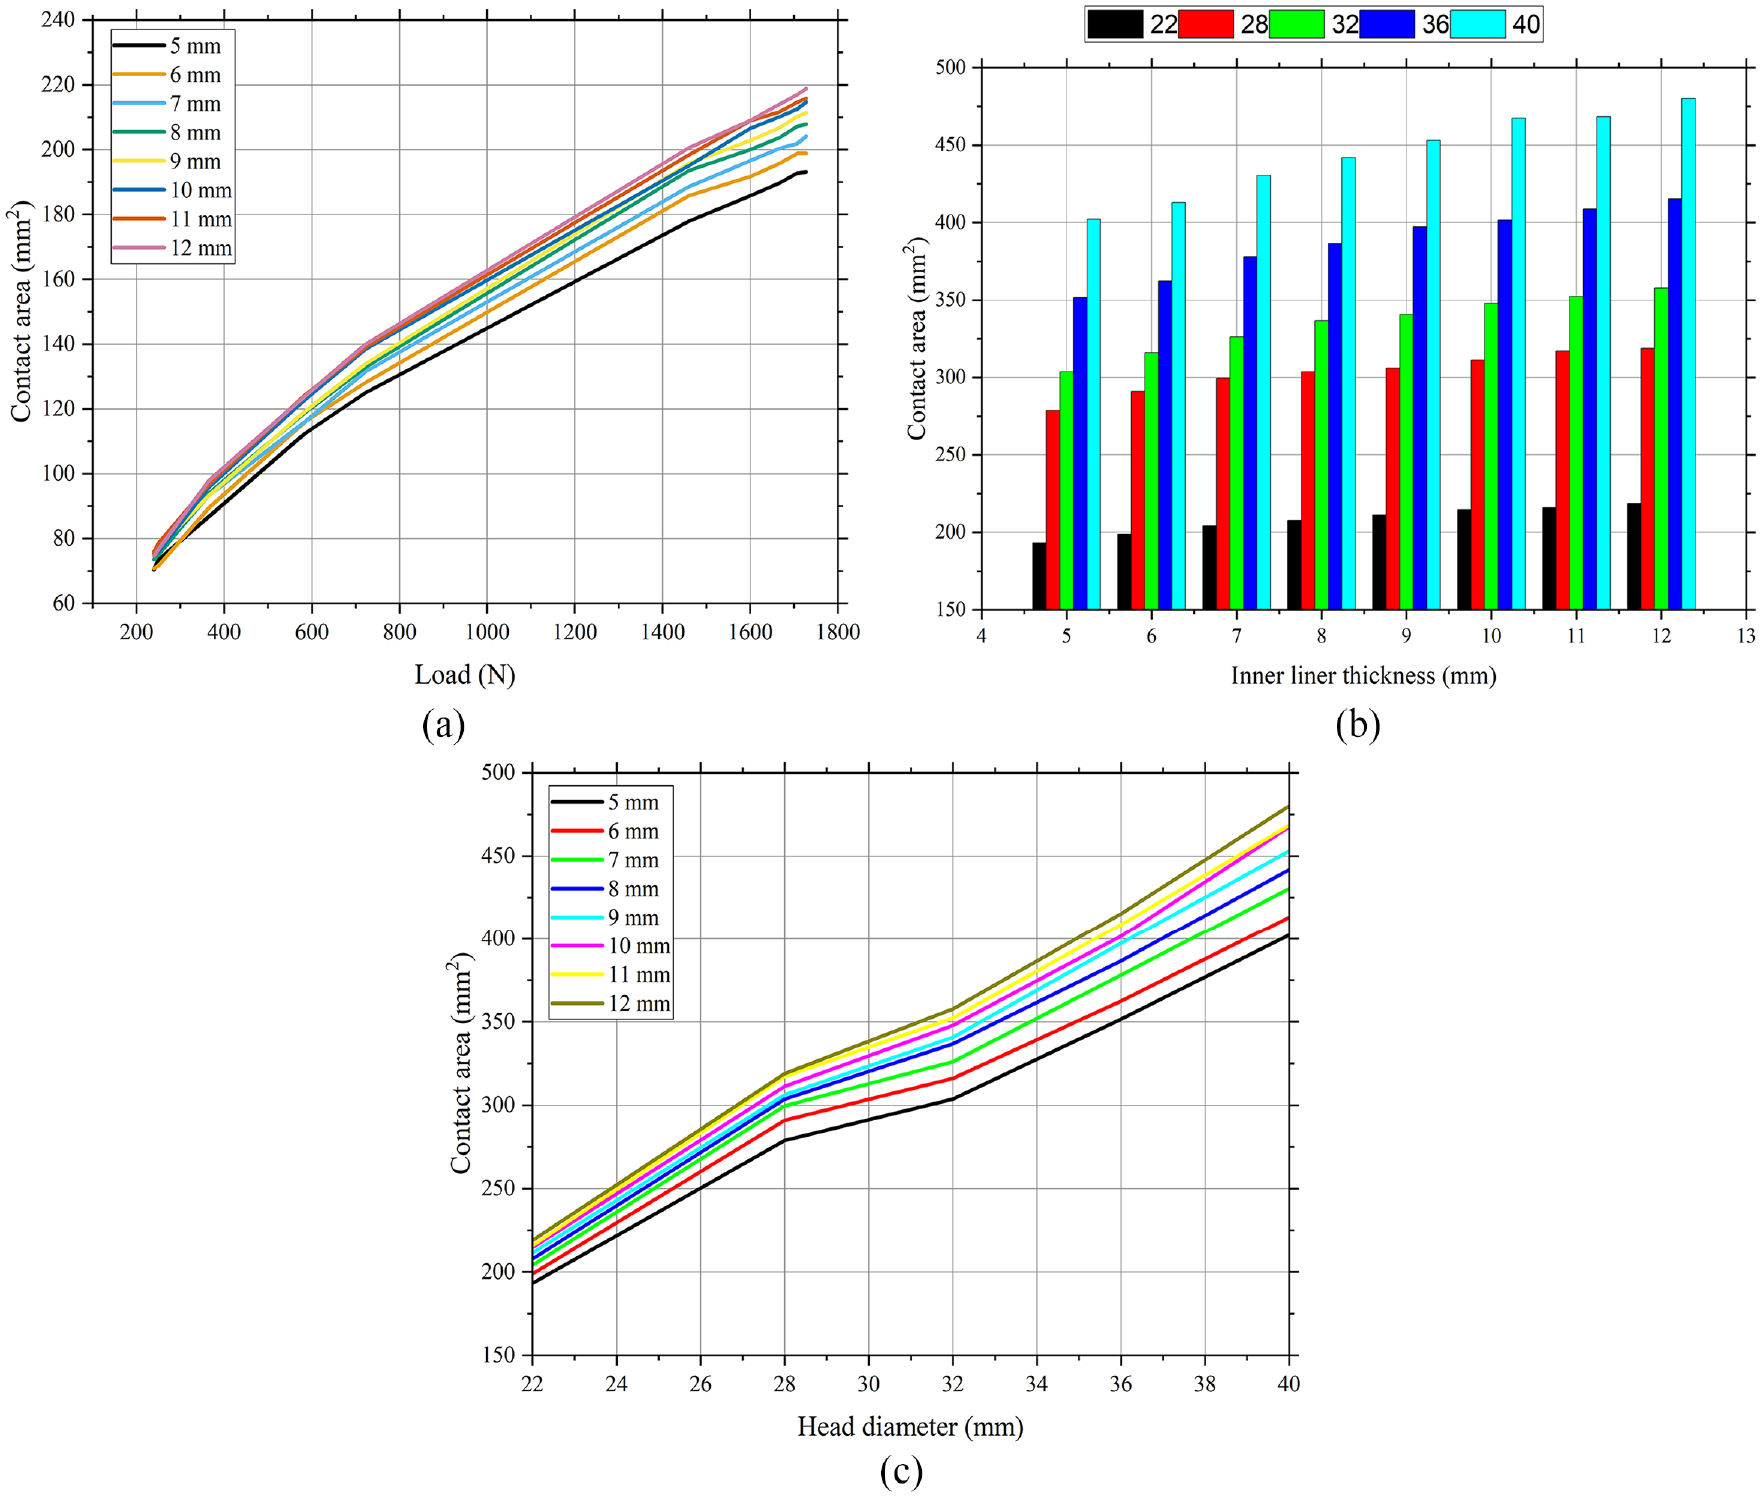
Contact area during the running-in process based on (a) load, the contact areas are measured in various inner liner thicknesses ranging from 5 to 12 mm, (b) inner liner thickness, the contact areas are measured in head diameters 22, 28, 32, 36, and 40 mm, and (c) head diameter, the contact areas are measured in various inner liner thicknesses ranging from 5 to 12 mm.
Figure 6(c) depicts the contact area versus the head diameter for each inner liner thickness during the running-in phase. The contact area increases linearly with increasing head diameter. However, the slope of the line changes (becomes steeper) for the 28–32 mm head diameter. The findings exhibit a 5.2% increase in contact area for every 1 mm of augmentation within the 22–28 mm range, whereas the rate of contact area increase is 2.3% per mm for the 28–32 mm range. Furthermore, the observed escalation in contact area falls within the 32–40 mm range at a rate of 3.1% per millimeter. The graph facilitates the estimation of the contact area corresponding to various head diameters, spanning from 22 to 40 mm.
Contact pressure was present at both the primary and secondary contact areas. The contact pressure experienced by the inner liner, outer liner, and acetabular cup at a head diameter of 22 mm is shown in Figure 7. The contact pressure exerted on the outer liner and acetabular cup is comparatively greater than the contact pressure experienced by the inner liner. The sequence of contact pressure, arranged in ascending order, is the inner liner, the outer liner, and the acetabular cup. The graph illustrates that a head diameter of 22 mm corresponds to the minimum contact pressure across all components when the inner liner thickness is 12 mm.
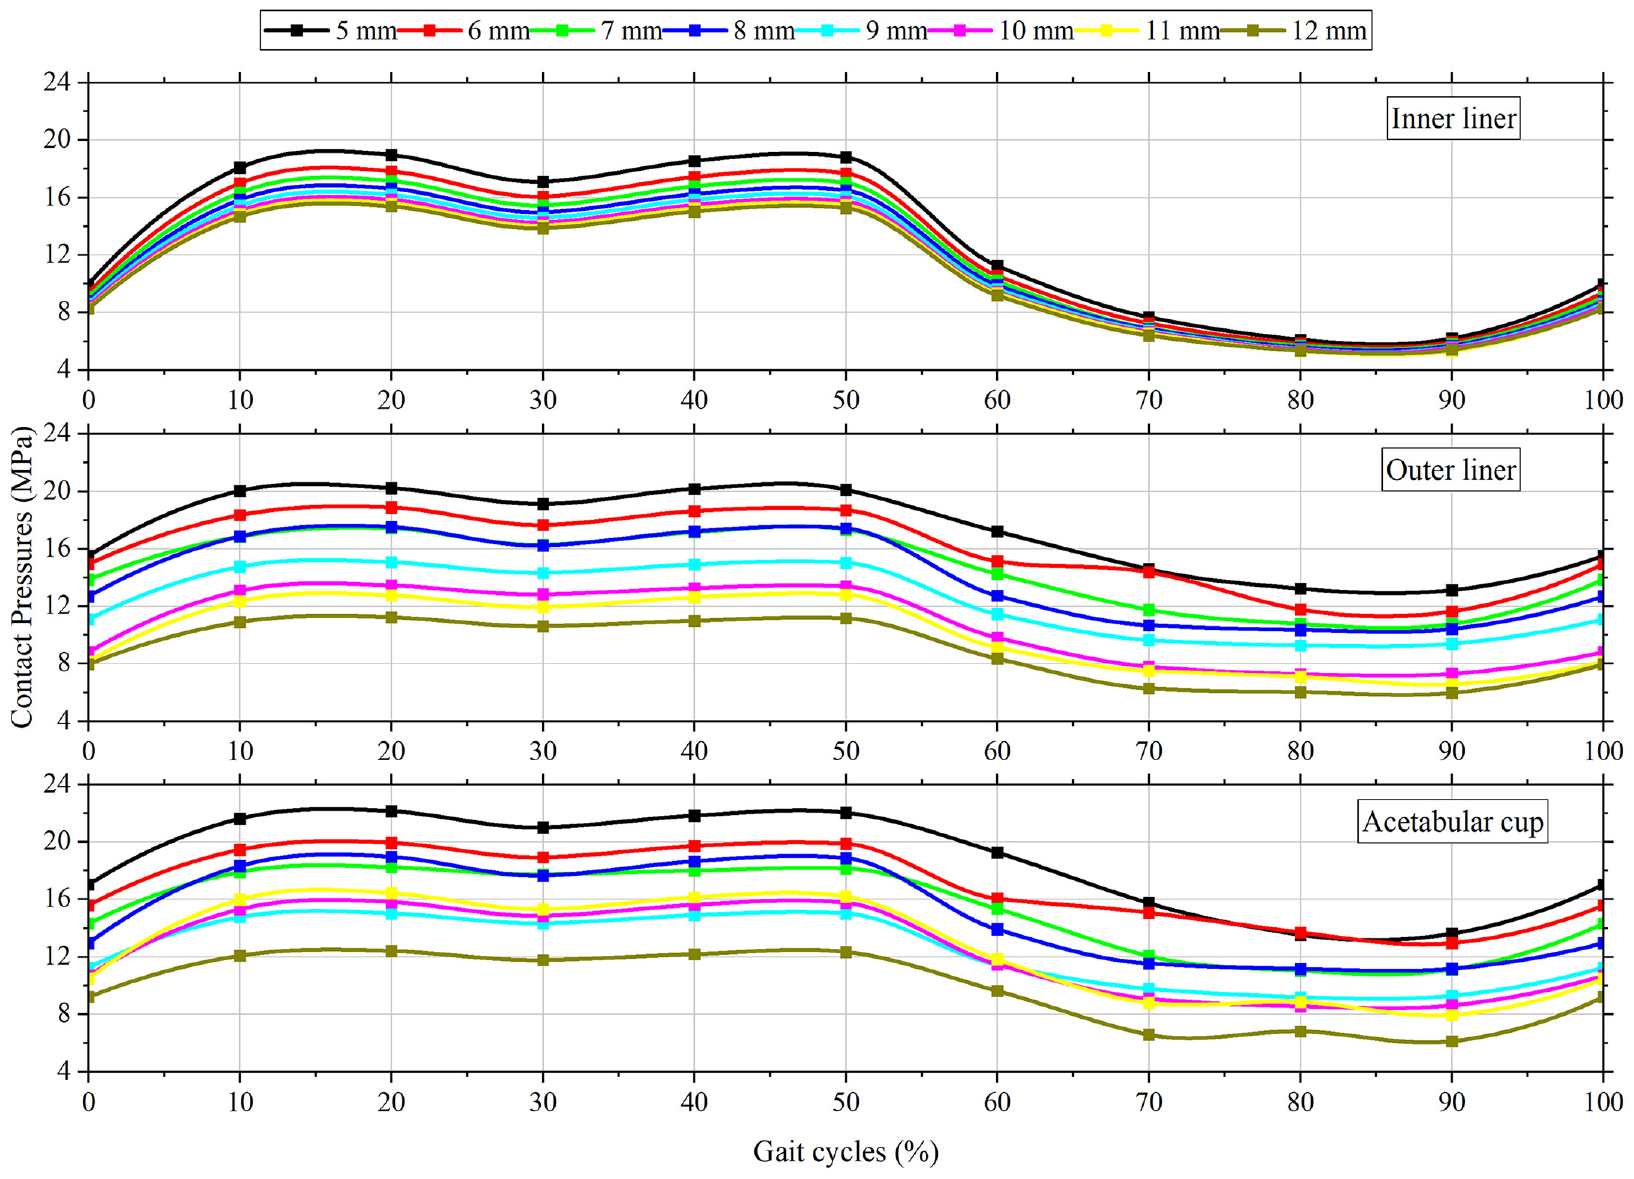
The contact pressures at inner-liner, outer-liner, and acetabular cup. The contact pressures are measured in one gait cycle on various inner liner thicknesses ranging from 5 to 12 mm.
Figure 8(a) reflects the contact pressure experienced by the inner liner during the running-in process. The phenomenon of contact pressure exhibits a direct connection with the amount of the applied load, such that an increase in load results in a corresponding increase in contact pressure. The thickness of the inner liner has an impact on the contact pressure in addition to the load, as displayed in Figure 8(b) for head diameters 22, 28, 32, 36, and 40 mm. Unlike the contact area, the contact pressure decreases as the inner liner’s thickness increases. This finding aligns with the mathematical expression represented by equation (4). The region with the least amount of contact pressure is situated on the inner liner, which has a thickness of 12 mm. The decrease in contact pressure per millimeter of inner liner thickness is 3.5%.
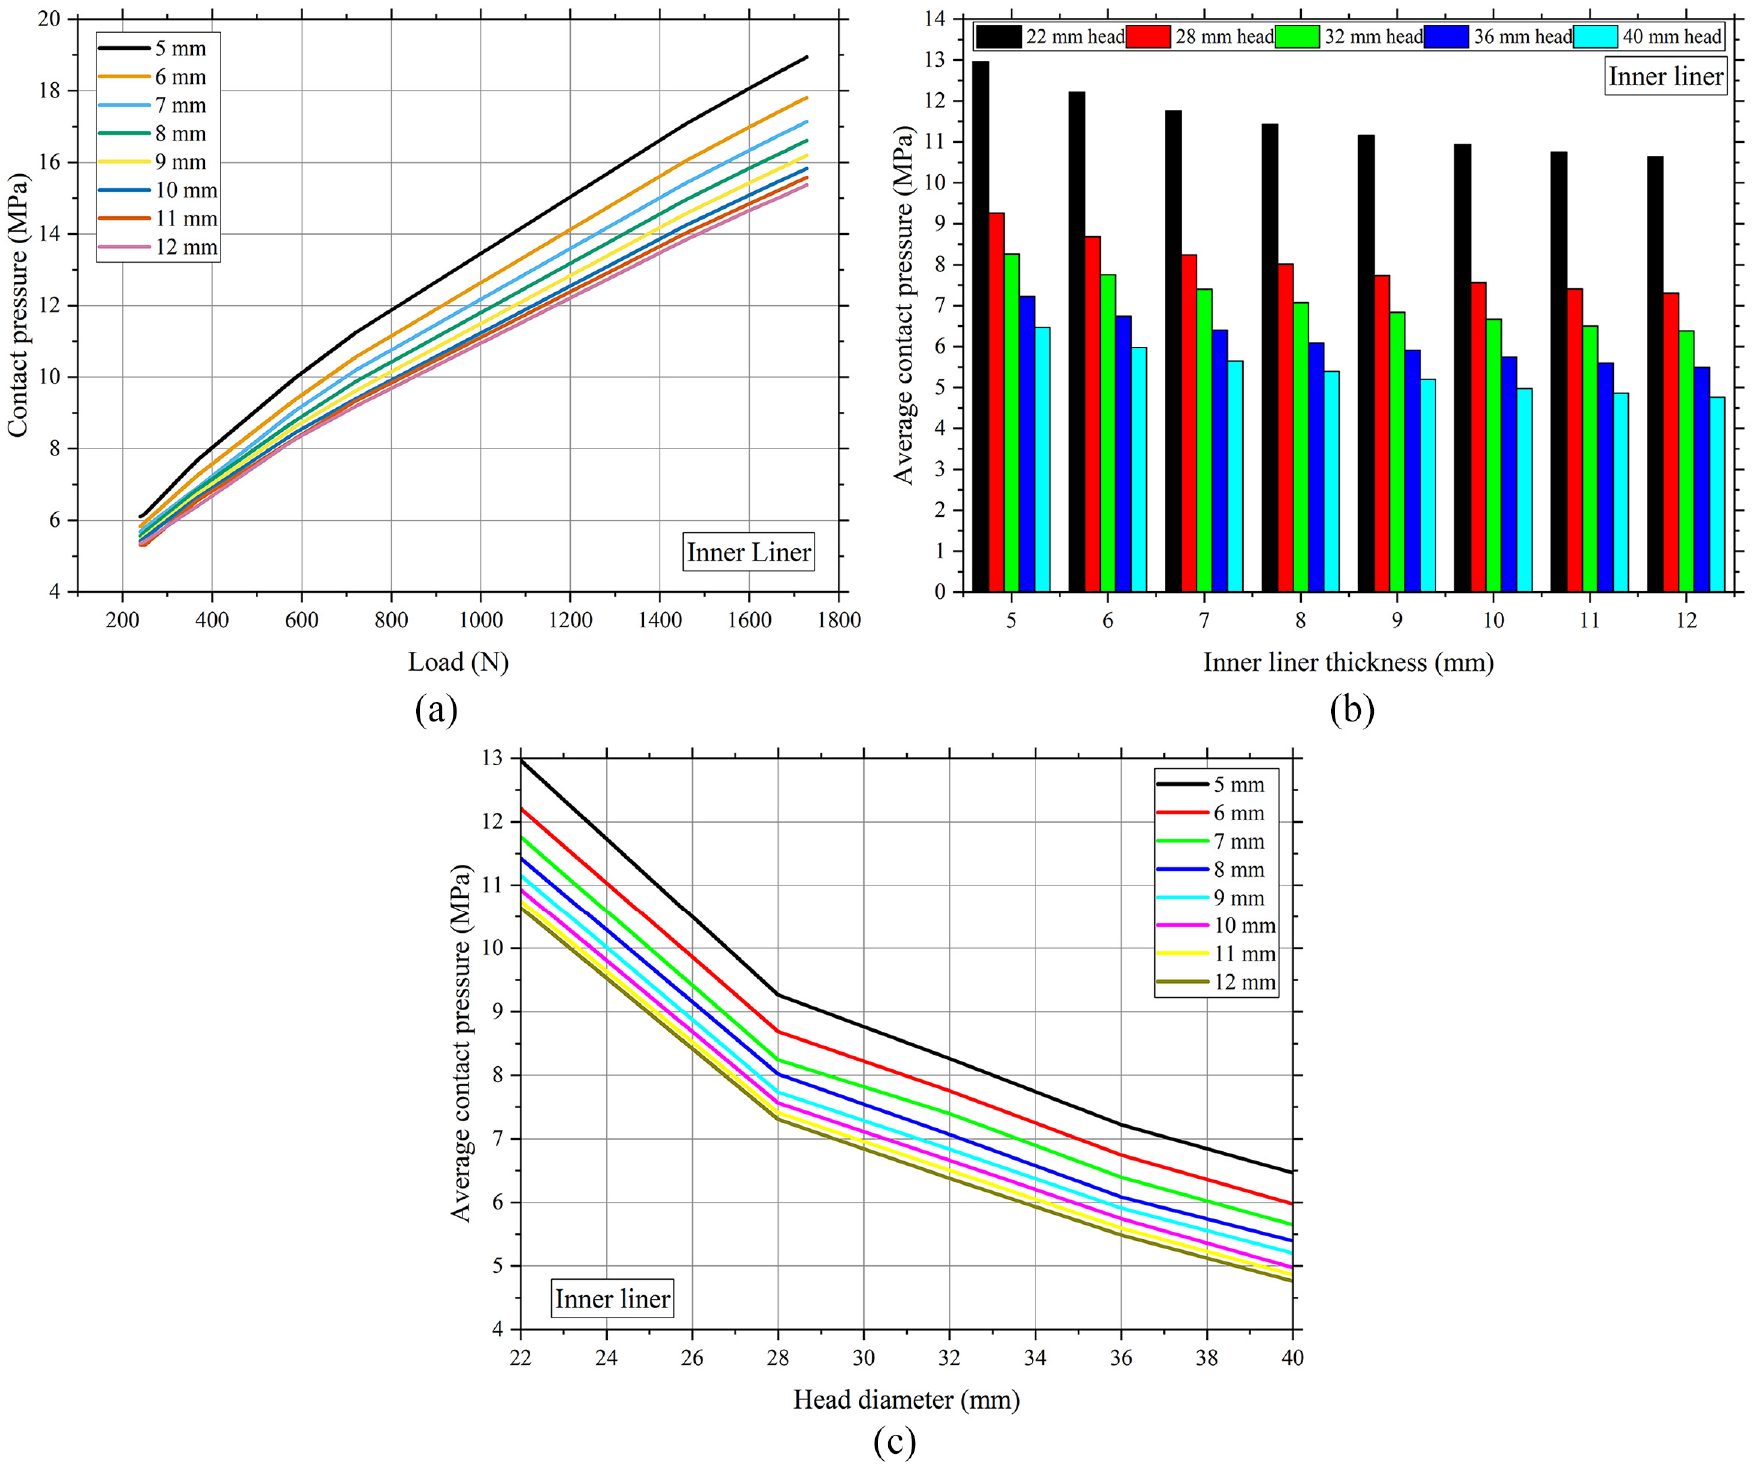
Contact pressure during the running-in procedure based on (a) load, the contact pressures are measured in various inner liner thicknesses ranging from 5 to 12 mm, (b) inner liner thickness, the contact pressures are measured in head diameters 22, 28, 32, 36, and 40 mm, and (c) head diameter, the contact pressures are measured in various inner liner thicknesses ranging from 5 to 12 mm.
The average contact pressure to the head diameter during running-in is shown in Figure 8(c). The data indicates an inverse relationship between head diameter and contact pressure, whereby an increase in head diameter results in a decrease in contact pressure. However, it is noteworthy that there is a variation in the gradient of the head diameter, measuring 28 mm. A notable decrease in contact pressure at a head diameter ranging from 22 to 28 mm, resulting in a 5% reduction per millimeter. At a head between 28 and 40 mm, the decline in contact pressure exhibits a more gradual slope, with a rate of 2.7% per millimeter.
Running-in wear
The Archard equation is utilized for the mathematical analysis of linear wear. Figure 9 displays the outcomes of the linear wear rate (Figure 9(a)) and volumetric wear rate (Figure 9(b)) computation of 22 mm head in million cycles. The graph depicts the occurrence of running-in, which is observed to occur within approximately 500,000 cycles or up to 6 months postoperatively. During the running-in phase, the inner liner thickness of 5 mm exhibits the greatest linear wear rate, measuring at 0.1 mm/mc. While the minimum linear wear rate is achieved at a thickness of 12 mm for the inner liner, resulting in a value of 0.08 mm/mc.
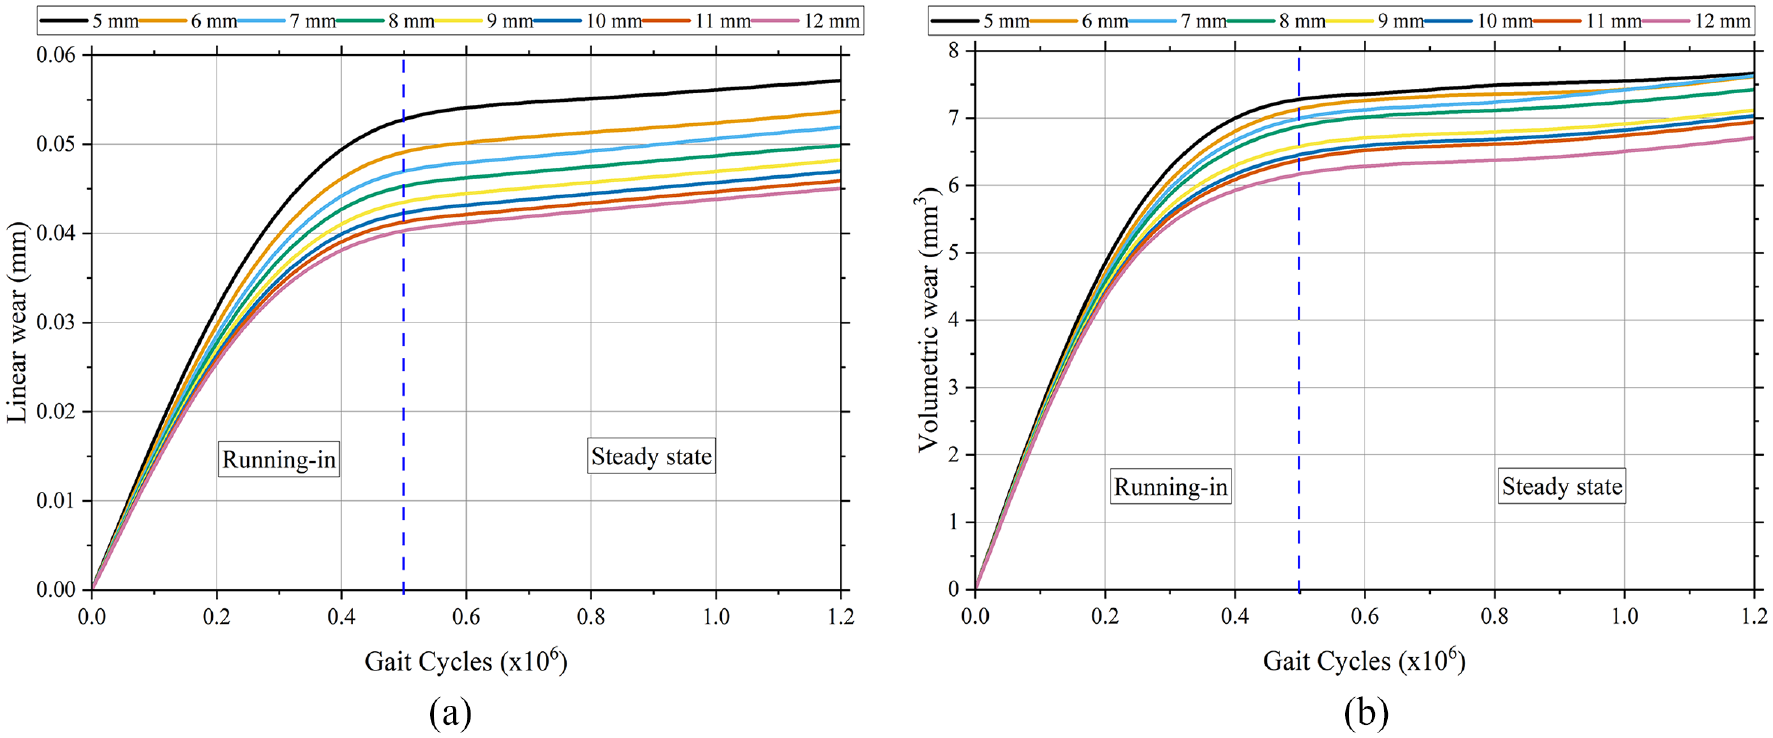
(a) The linear wear rate and (b) the volumetric wear rate. The running-in phase at a head diameter of 22 mm occurs up to 500,000 cycles, which is then followed by the steady-state phase.
The maximum rate of volumetric wear observed is 14.6 mm3/mc. The volumetric wear rate that exhibits the most minor wear is 12.4 mm3/mc. The linear wear has exhibited a reduction of 2.5% per millimeter of thickness in the inner liner. In the interim, there is a reduction of 1.9% in volumetric wear per millimeter of the inner liner.
Discussion
The assessment of hip joint contact area and pressure distribution during typical daily activities is of considerable importance in predicting the mechanism of joint degeneration, the degradation of prosthetic implants, and providing biomechanical rationales for preoperative planning and postoperative recovery. 46 Several research investigations47–49 have established that the anticipation of implant malfunction due to wear can be accomplished by approximating the distribution of contact pressure and contact area during typical utilization. Therefore, it is imperative to understand the contact area and contact pressure when designing an artificial hip joint to ensure the highest level of functionality, superior performance, and life expectancy.
The selection of the diameter of the femoral head and overall design is a crucial aspect that requires careful consideration. It is imperative to ensure that the chosen design accurately replicates the physiological function of the hip joint under the patient’s anatomy. 50 In addition, the dimensions of the femoral head and the inner liner thickness significantly impact the running-in process of DMC. According to reference, 51 an increase in articulation diameter resulted in enhanced stability, while a decrease in articulation diameter led to decreased wear.
Based on the report, 9 heads with a diameter of less than and equal to 28 mm exhibited the lowest risk, underwent the least number of revisions, and demonstrated a prolonged lifespan of up to 15 years. Several in vivo studies reported that the head diameter utilized in DMC was typically smaller than 32 mm.52,53 This head was designed to fit within a larger polyethylene hemisphere, typically from 38 to 54 mm in diameter. 52 The hemisphere was designed to articulate with a smooth metal surface. In the opinion of certain researchers, the optimal head size was 28 mm.4,54,55 Aguado-Maestro et al. 56 reported a substantial rise in the risk of dislocation associated with a 22 mm head diameter compared to a 28 mm head diameter.
The DMC technology has been developed to adhere to Charnley’s theory, which posits that smaller-diameter heads result in reduced wear. As such, the system is designed to be compatible with 22-mm heads. Currently, the utilization of 28-mm heads is feasible, given that they are employed in extensive liners to prevent inadequate polyethylene thickness in the liner. 57 Neri et al. 57 suggested that to ensure a minimum circumferential thickness of 10 mm liner, the use of 28-mm-diameter heads should be limited to liner dimensions exceeding 54 mm.
The study conducted in a controlled environment revealed that the utilization of dual mobility cups featuring 22.2 and 28 mm femoral heads resulted in a considerably higher range of motion (RoM) compared to traditional implants with comparable head sizes.58–60 According to Wegrzyn’s findings, 61 no statistically significant difference was observed in the volumetric wear and impingement deformation depth on the chamfer when comparing the use of a 28-mm or 22.2-mm diameter femoral head.
The current study’s findings indicate that a head diameter of 28 mm is the recommended size for DMC based on the contact area results and contact pressure calculations. This conclusion is drawn from an analysis of the contact area and contact pressure graphs. Moreover, according to the graphical representation of the contact area and contact pressure as a function of the inner liner thickness, it can be inferred that the ideal thickness for the inner liner is 12 mm. The findings of this investigation exhibit a high level of agreement with the previously cited sources.
Several researchers have conducted wear computations on DMC. However, estimating wear during the initial running-in phase is a seldom-explored area. In a prior investigation, Hidayat 10 conducted a comprehensive analysis of the running-in wear characteristics of different sets of hip joint bearings in the context of a single-mobility (SM) artificial hip joint (AHJ). Table 1 compares the outcomes obtained from wear or running-in wear computations conducted on DM and SM AHJ.
Comparison of wear rates on AHJ.
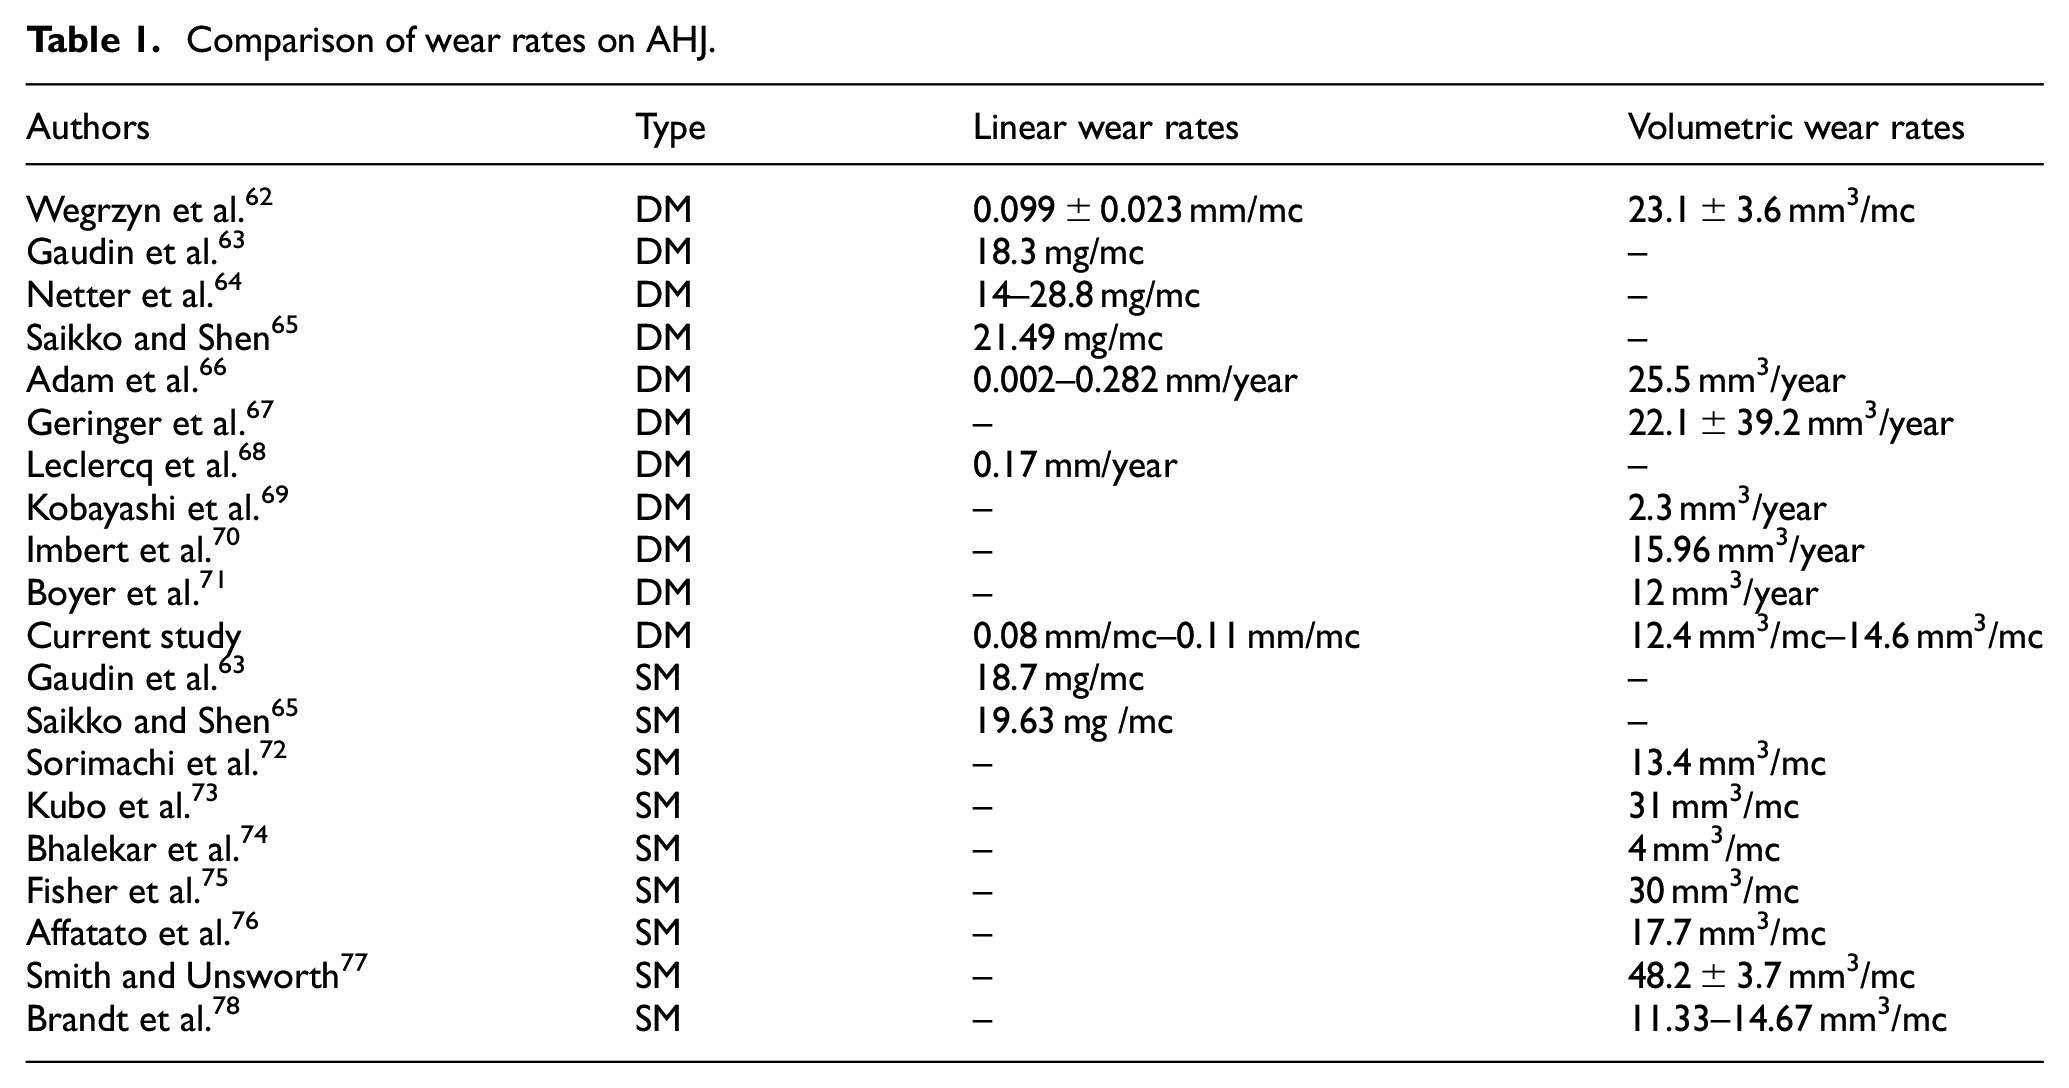
Table 1 reveals that the running-in wear value in this study is comparable to previous research findings. The wear value of artificial hip joints exhibits significant variability, lacking a standardized measure. The issue of wear has been a subject of ongoing debate among experts for an extended time. Determining a consistent and precise measure of wear is challenging due to its close association with numerous non-standard factors. Researchers have the freedom to choose the material, inner liner thickness, clearance distance, and head diameter based on the patient’s condition.
The linear wear values for SM AHJ range from 18.7 to 19.6 mg/mc, while DM AHJ ranges from 0.002 mm/year to 28.8 mg/mc. The volumetric wear values for SM AHJ range from 4 to 48.2 mm3/mc, while DM AHJ ranges from 2.3 to 25.5 mm3/year. In current studies, the linear wear values range from 0.08 to 0.11 mm/mc, while the volumetric wear values range from 12.4 to 14.6 mm3/mc. Based on the facts at hand, it is evident that the wear rate on the DM AHJ does not exceed that of the SM AHJ. There exist certain DM AHJ that exhibit reduced wear rate compared to SM AHJ.
According to Yang, 79 the wear rate of DMC was comparable to that of traditional bearings. The veracity of this claim can also be substantiated by empirical evidence obtained from laboratory experiments. Gaudin et al. 63 conducted a comparative analysis of the wear of UHMWPE liners in conventional and DM bearings through the hip simulator test. The findings indicated that the degree of wear experienced by DMC is marginally lower than that of traditional bearings. Saikko et al. 65 analyzed the wear of DMC and conventional bearings, examining their performance at various positions of the acetabular shell. There was no observable correlation between the wear rates of the two designs and the abduction angle.
Some researchers posit that the wear of DMC may be higher than that of SM AHJ if the outer articulation is dominant, owing to the larger contact area and sliding distance at the outer articulation compared to the inner articulation. 80 Indeed, despite possessing two mobile articulations, the wear rate observed on the DMC does not exhibit a magnitude twice that of the wear rate observed on the SM AHJ. The wear rate of both of them exhibits only a slight disparity. This discovery suggests that internal articulation plays a significant role in the motion distribution of the DMC.
The study of the running-in phase is crucial due to the notable rise in wear during this period. The running-in process of an artificial hip joint is crucial for ensuring optimal functionality and safe usability of the medical device by the patient. The purpose of the running-in procedure for the artificial hip joint is to ensure optimal functionality, proper alignment, and pain-free movement for the patient. The impact of this is an extension of the lifespan of the medical device. The running-in procedure allows for the identification and swift correction of any existing or potential issues with the artificial hip joint before it is thoroughly utilized by the patient.81,82
The duration of complete recovery following hip joint replacement surgery exhibits significant variability. The prevailing consensus is that a minimum duration of 4–6 months is often required for patients to perceive a restoration of their activity levels to those observed prior to sustaining an injury. In certain instances, the healing process may extend for 9–12 months. 82
Conclusions
The approach presented can be utilized to emphasize the investigation of the tribology of DMC in conditions that are comparable to those commonly found in the human body, leading to the deduction of the following findings: The linear relationship between the running-in wear and the parameters of head diameter and liner thickness is following Charnley’s low friction hypothesis. The optimal head diameter for the DMC is suggested to be 28 mm. A thickness of 12 mm is considered the optimal choice for the inner liner. The algorithm proposed for computer simulation yields plausible outcomes and is feasible.
To summarize, assessing and evaluating contact area, contact pressure, and running-in wear in prosthetic hip joints are crucial for comprehending the biomechanical characteristics of these implantable apparatuses. By examining these parameters, people can detect prospective problems with existing designs, devise techniques to reduce deterioration and enhance efficiency, and refine rehabilitation procedures. The results obtained from these investigations make a valuable contribution to the continuous progress in the area of orthopedics and hold promise for significant advantages for patients in need of a total hip replacement.
The simulation was conducted under static conditions, and the absence of lubrication in the dry contact scenario were constraints in this investigation. In order to enhance the scope of future investigations, it would be advantageous to conduct dynamic simulations, including the use of lubricants. In addition to the mentioned considerations, conducting experiments with a hip simulator is essential.
Footnotes
Acknowledgements
The authors acknowledge the support from Department of Mechanical Engineering at Diponegoro University, Universitas Muria Kudus, and Semarang State Polytechnic, Indonesia.
Declaration of conflicting interests
The author(s) declared no potential conflicts of interest with respect to the research, authorship, and/or publication of this article.
Funding
The author(s) received no financial support for the research, authorship, and/or publication of this article.
Ethical approval
Not required.