
Abstract
Enhancing the ejector entrainment ratio plays an important role in the ejector performance. In this article, a surrogate-based optimization approach along with computational fluid dynamics technique has been employed to optimize the entrainment ratio of a single-phase ejector working with natural gas. Nine ejector geometrical factors have been varied to maximize the ejector entrainment ratio. Validation results of the presented computational fluid dynamics model were in a good agreement with the experimental data from the literature with an average error of 0.6% in the critical mode. Reported results showed that the optimum design achieves entrainment ratio of 19.45% at 12, 2, and 5.2 MPa motive pressure, induced pressure, and discharge pressure, respectively. Moreover, the primary nozzle convergent angle and throat length are insignificant factors. Furthermore, secondary nozzle inclination angle has a minor effect on the entrainment ratio of the optimum design.
Keywords
Introduction
Natural gas treatment and production plants often choke the natural gas coming from high-pressure wells or compression station in order to meet pipelines or plant pressure. Recovery of the wasted energy in choking process has the potential to make the natural gas production more energy-efficient. In addition, low-pressure gas from the later stages of the process system is to be flared for being uneconomical to recycle. The flaring of low-pressure gas is an energy inefficient process and detrimental to the environment. The high-pressure gas coming from the high-pressure wells or compression station could be used to boost gas production from aging wells or to recompress and recycle the low-pressure gas from the later process stages.
Ejectors have no moving parts, which subsequently increases its reliability and reduce maintenance cost significantly. Moreover, ejectors are distinguished by construction and operation simplicity. Ejector has been introduced by Sarshar 1 as an energy-efficient and environment-friendly solution to recover the wasted energy in choking process and to reduce gas-to-flare amount. Ejectors are mechanical devices by which a high-pressure stream could be used to induce and accelerate a low-pressure stream.
Because of these advantages, many research works have been conducted on the application of ejectors in natural gas production industry. For example, Andreussi et al. 2 presented the design method and result of field tests for a multiphase ejector installed to boost the production from a depleted well in the Gulf of Mexico. Melancon and Nunn 3 discussed the benefits of using the ejector vapor recovery unit in the United States, Reddell field to recover a high-Btu content vent gas and reported the system economics and operational modes. Also, Wu et al. 4 carried out a field application economic analysis of the natural gas ejector, being used to boost the production of low-pressure gas well and investigated its performance at different operating conditions. The above-mentioned research works all agreed on the potency of ejectors as a natural gas production boosting device and as a waste gas recovery tool.
Despite the advantages of ejectors, they are still not widely used in natural gas production industry due to its low performance specially at a relatively high back pressure and low induced flow pressure. As a result, numerous investigations have been conducted to improve their performance. Chong et al. 5 optimized numerically the geometrical parameters of a natural gas ejector for boosting low-pressure natural gas production. A maximum pressure ratio of 60% has been obtained at 12 MPa motive pressure, 3 MPa induced pressure, and 5.2 MPa discharge pressure. The optimal diameter ratio of mixing tube-to-primary nozzle throat, length-to-diameter ratio of mixing tube, and inclination angle of mixing chamber are 1.6, 4.0, and 28°, respectively.
The entrainment ratio (ω) is used as a key parameter in many research works such as Chen et al.6,7 and Xue et al.
8
The entrainment ratio is defined as the ratio between the secondary flow rate, ms, and the primary flow rate,
Computational fluid dynamics (CFD) investigation was carried out by Chen et al. 6 to optimize some structural parameters of natural gas ejector by maximizing the entrainment ratio. The simulations revealed that, the optimal inclination angle of the mixing chamber, diameter ratio of the mixing tube to primary nozzle throat, length-to-diameter ratio of the mixing tube and inclination angle of the diffuser are 14°, 1.7, 5.0, and 1.43°, respectively. Based on their previous studies, Chen et al. 7 conducted an optimization study to maximize both the entrainment ratio and pressure ratio. The results showed that, the maximum entrainment ratio achieved when the primary nozzle exit position was varied from 3.6 to 7.2 mm and the mixing tube length-to-diameter ratio varied from 2 to 8, while the maximum pressure ratio achieved when the primary nozzle exit position ranged from 1.2 to 7.2 mm and the mixing tube length-to-diameter ratio ranged from 3 to 7.
Xue et al. 8 compared the performance of supersonic air ejector with three different nozzles shapes, conical nozzle, petalage nozzle, and crenation nozzle. Compared to the conical nozzle, the entrainment ratio of petalage nozzle was slightly smaller, but the critical back pressure increased by 5.2%. The entrainment ratio of crenation nozzle was slightly higher, and the critical back pressure decreases by 2.1%. Chen et al. 10 proposed another design enhancement to maximize ejector capacity. The proposed enhancement was to install bypass at ejector low-pressure district. The results showed that, the optimal length ratio is about 1.1, and the ejector performance with the optimal bypass has relatively higher entrainment ratio and lower critical back-pressure compared to conventional the ejector.
The above-mentioned investigations reported a significant effect of ejector geometrical factors on its performance. However, no structural optimization on the primary nozzle of natural gas ejectors has been reported. Moreover, there is no study considered the interactions between the natural gas ejector geometrical factors, since the one factor at a time approach is dominant in all studies. In this study, the surrogate modeling along with CFD are used to obtain the optimum value of nine natural gas ejector geometrical factors that maximize the entrainment ratio. According to this approach, the interactions between ejector factors are considered in the optimization process.
Mathematical model
In this work, the commercial software ANSYS Fluent 16.2 is employed as a numerical solver. 11 The flow in the ejector is considered to be compressible, steady-state, and turbulent flow. The two-dimensional (2D) axisymmetric simplification is used in this study. The conservation equations are given by
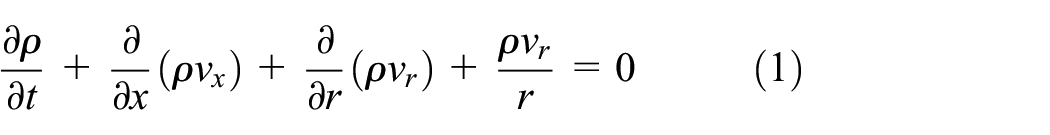
Mass conservation
Momentum conservation


where x and r are the axial and radial coordinates, respectively. vx and vr are the axial and radial velocities, respectively. While Fx and Fr are the external forces in axial and radial directions, respectively. ρ is gas density and
Renormalization group (RNG)

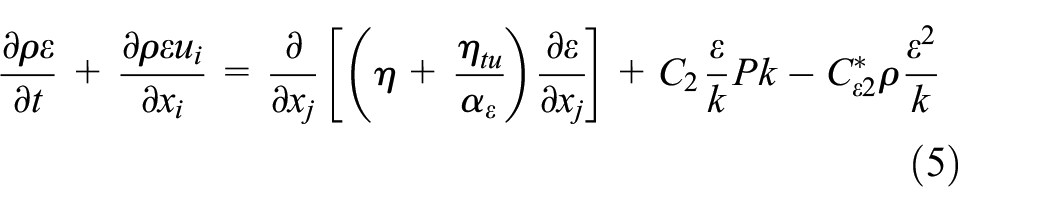
where
In this study, the entrainment ratio, used as a key parameter, is not affected by the flow boundary layer according to these conditions. This conclusion is obtained from a comparison between these CFD results and Chong et al.
12
results. Chong solved the flow boundary layer and the entrainment ratio that are in a good agreement with these results. Therefore, the scalable wall function is the best selection to solve the near wall cells in this study. The scalable wall functions is used to force the usage of the log law in conjunction with the standard wall functions approach since it is so hard to adjust ejector walls
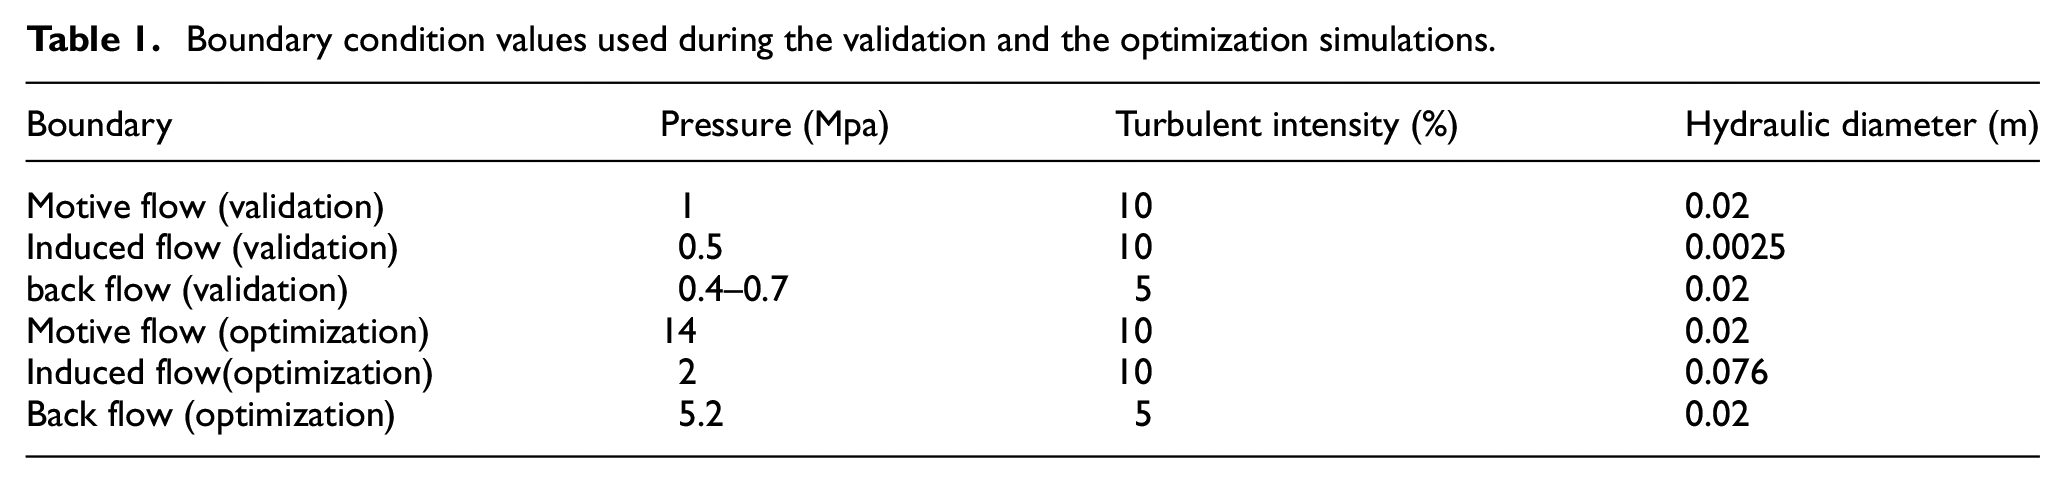
The second-order upwind discretization scheme is adopted to solve the convection terms. While, the coupled pressure-based algorithm is selected to obtain ejector pressure field at low dominant Mach number. 13 The boundary conditions used to solve the governing equations are pressure inlets for the motive and induced flow inlets, and pressure outlet for ejector outlet. The flow condition of the natural gas ejector used in this study is supersonic with zero velocity at the ejector inlets. As a result, the ejector walls are considered to be adiabatic due to the small residence time of gas. The temperature is kept at 300 K. Turbulent intensity and hydraulic diameter, listed in Table 1, are used for turbulent boundary conditions.
Boundary condition values used during the validation and the optimization simulations.
Due to the symmetry of the ejector, the 2D axisymmetric simplification is used for calculation time reduction purpose. The 2D full domain and the 2D axisymmetric domain are demonstrated in Figure 1(a) and (b). A structured mesh with hexahedral elements was generated using ANSYS meshing tool as shown in Figure 1(c). Methane is selected as the working fluid because it represents more than 85% of natural gas volume. 14 The density is modeled using the real gas equation of Soave Redlich Kwong, equation (6) 11

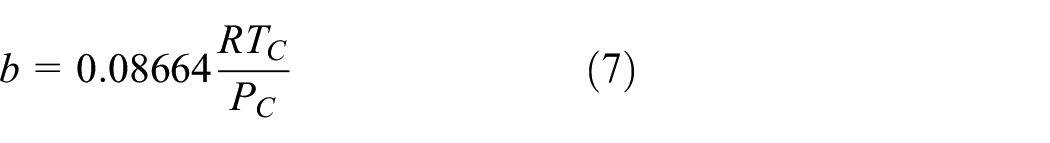

where P, V, T, and R are the gas pressure, specific volume, temperature, and universal constant, respectively.


The ejector flow domain. (a) Ejector 2D wholeflow domain, (b) ejector 2D axisymmetric half domain, and (c) part of the generated mesh for ejector 2D axisymmetric flow domain.
Mesh independency and validation study
Roache16–18 suggested the grid convergence index (GCI) as a quantitative measure for the grid convergence. The GCI is based upon a grid refinement error estimator derived from the theory of the generalized Richardson extrapolation. The GCI, equation (12), is a measure of how far the computed value is away from the value of the asymptotic numerical value. Consequently, it indicates how much the solution would change with a further refinement of the grid. A small value of GCI indicates that the computation is within the asymptotic range

where

where

where
where
The solution is in the asymptotic range when α, which defined in equation (17), approaches unity
Oscillatory convergence,
Monotonic convergence,
Divergence,


In this study, over 90 geometrically different ejectors are needed for the optimization process. It is too much time consuming to study the mesh independency on each ejector. So, the authors proposed the average cell area

where
Grid convergence index calculations results.

The value at zero grid space (fexact equation (18)).
The following conclusions have been obtained from the GCI analysis:
The obtained values for α are close to 1, so the results are in the asymptotic range.
The ratio
There is a reduction in the
The extrapolated value (fexact) is only slightly changed from the finest grid solution. This confirms that the grid independency solution has been achieved.
The minimum appropriate value for
The accuracy and the stability of the numerical solution are highly correlated to mesh quality. Therefore, the mesh quality characteristic is carefully monitored during mesh generation. The minimum orthogonal quality, maximum skewness, and maximum aspect ratio for the constructed grids throughout this study are 0.85, 0.3, and 30, respectively. Meshes are constructed manually using ANSYS meshing tool for every simulated ejector during the optimization process with
The CFD model is validated with the experimental data from Chong et al. 12 In Chong et al.’s study, air is used as a working fluid in the experiments. Therefore, air is used during the validation process and the real gas equation of Soave Redlich Kwong is used for density calculations with the temperature-dependent polynomial functions provided by ANSYS Fluent database for air. The simulation is performed at 1 MPa motive pressure, 0.2 MPa secondary pressure, and discharge pressure ranging from 0.4 to 0.7 MPa. The mesh independency study is conducted first using the GCI analysis before the validation process at 0.4 MPa discharge pressure. According to the GCI analysis summarized in Table 3, the mesh independence is achieved.
Grid convergence index calculations results for ejector model validation.

The value at zero grid space (fexact equation (18)).
Figure 2 shows that predictions of the entrainment ratio are in a good agreement with the experimental data with an average error of 0.6% in the critical mode. In addition, the model is able to predict ejector operational modes. Therefore, the CFD model is used in the optimization process to predict with considerable accuracy the entrainment ratio.

Comparison of entrainment ratio experimental data and CFD results for different discharge pressures at 1 MPa motive pressure and 0.2 MPa induced pressure.
Optimization methodology
The most popular approaches used for the optimization are the one factor at a time approach and the factorial approach in which the objective function affected by more than one factor. The one factor at a time method depends on selecting a starting point, or baseline and set of levels for each factor, then successively varying each factor over its range with the other factors held constant at the baseline level. The major disadvantage of this method is that, it does not take into consideration any possible interaction between the factors. This leads to the failure of the one factor at a time method to produce the same effect on the response at different levels of another factor. While, factors are varied together in the factorial approach. Hence, the interactions between factors can be investigated in which better results can be reached. 19 In this phase, the regression Kriging surrogate model is used to utilize the factorial approach in natural gas ejector geometrical optimization process. The optimization process passes through four main steps: defining the optimization goal and factor ranges, constructing the sampling plan, building the surrogate model, and finally defining the infill process and convergence criterion. The coupling between the CFD results and the optimization tool is performed manually.
Optimization goal and factors
The optimization goal is to maximize the entrainment ratio, ω. In order to achieve such objective, the geometrical factors of the natural gas ejector, shown in Figure 3, such as the primary nozzle convergent angle,
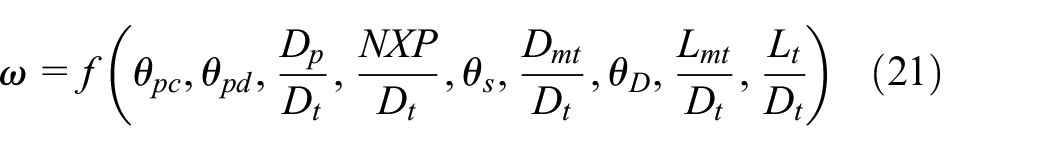

Natural gas ejector geometrical factors.
Ejector primary nozzle throat diameter kept constant at 4.6 mm, and the entire ranges at which these factors studied are summarized in Table 4.
Ejector geometrical factors ranges under study.

Kriging and initial sampling plan construction
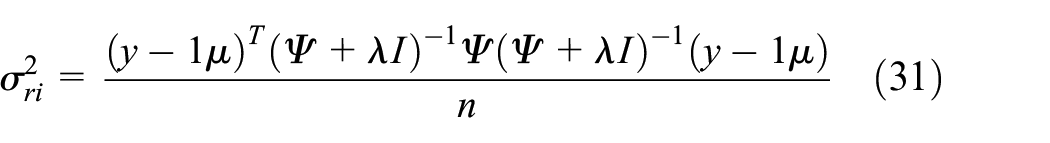
Kriging is an interpolating technique which considers both the distance and the degree of the variation between known data points when predicted values in unknown areas. 20 A kriged estimate is a weighted linear combination of the known sample values around the point to be estimated. Due to the great number of the Kriging model parameters, it is well suited for a highly nonlinear function with multi extremes. The maximum likelihood estimation (MLE) method is used to tune regression Kriging parameters. The MLE is a method of estimating the parameters of a statistical model given observations, by finding the parameter values that maximize the likelihood of making the observations, given the parameters. The concentrated ln-likelihood function is given by 20


where μ and

where
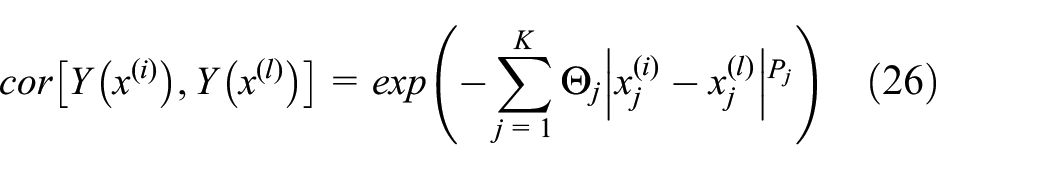
The correlation matrix depends on the absolute distance between the sample points
In order to tune Kriging model parameters, Latin hypercubes technique has been used to construct a sampling plan of 90 points. The constructed sampling plan responses were evaluated using CFD and then used to find the optimum

Infill and convergency criterion
The expected improvement infill strategy has been used to improve the accuracy in the region of the predicted optimum by Kriging to obtain an accurate optimal value quickly, and enhance the general accuracy of the model. The expected improvement approach computes how much improvement can be expected if decided to sample at a given point (x) as follows 20

where


The non-bolded “1” is a single one.
Genetic algorithm operators and parameters.

Figure 4 demonstrates the procedures of optimization process in order to obtain the optimum ejector geometrical factors.A suitable convergence criterion is adopted to stop the surrogate infill process which is a hard decision for the expectation of improvement infill strategy, since the estimated mean squared error of Gaussian process-based models is often an underestimate and the search may be stopped prematurely. 20 The surrogate infill process is stopped if the expectation of improvement is smaller than 1% of the range of observed objective function values for ten successive infill processes. After the convergency criterion for the infill process reached which is based on maximizing the expectation of improvement, the infill process based on maximizing Kriging prediction starts. The infill process based on maximizing Kriging prediction is terminated as the maximum value of the objective function founded through the infill process, based on maximizing the expectation of improvement, does not change for 20 successive infill processes.
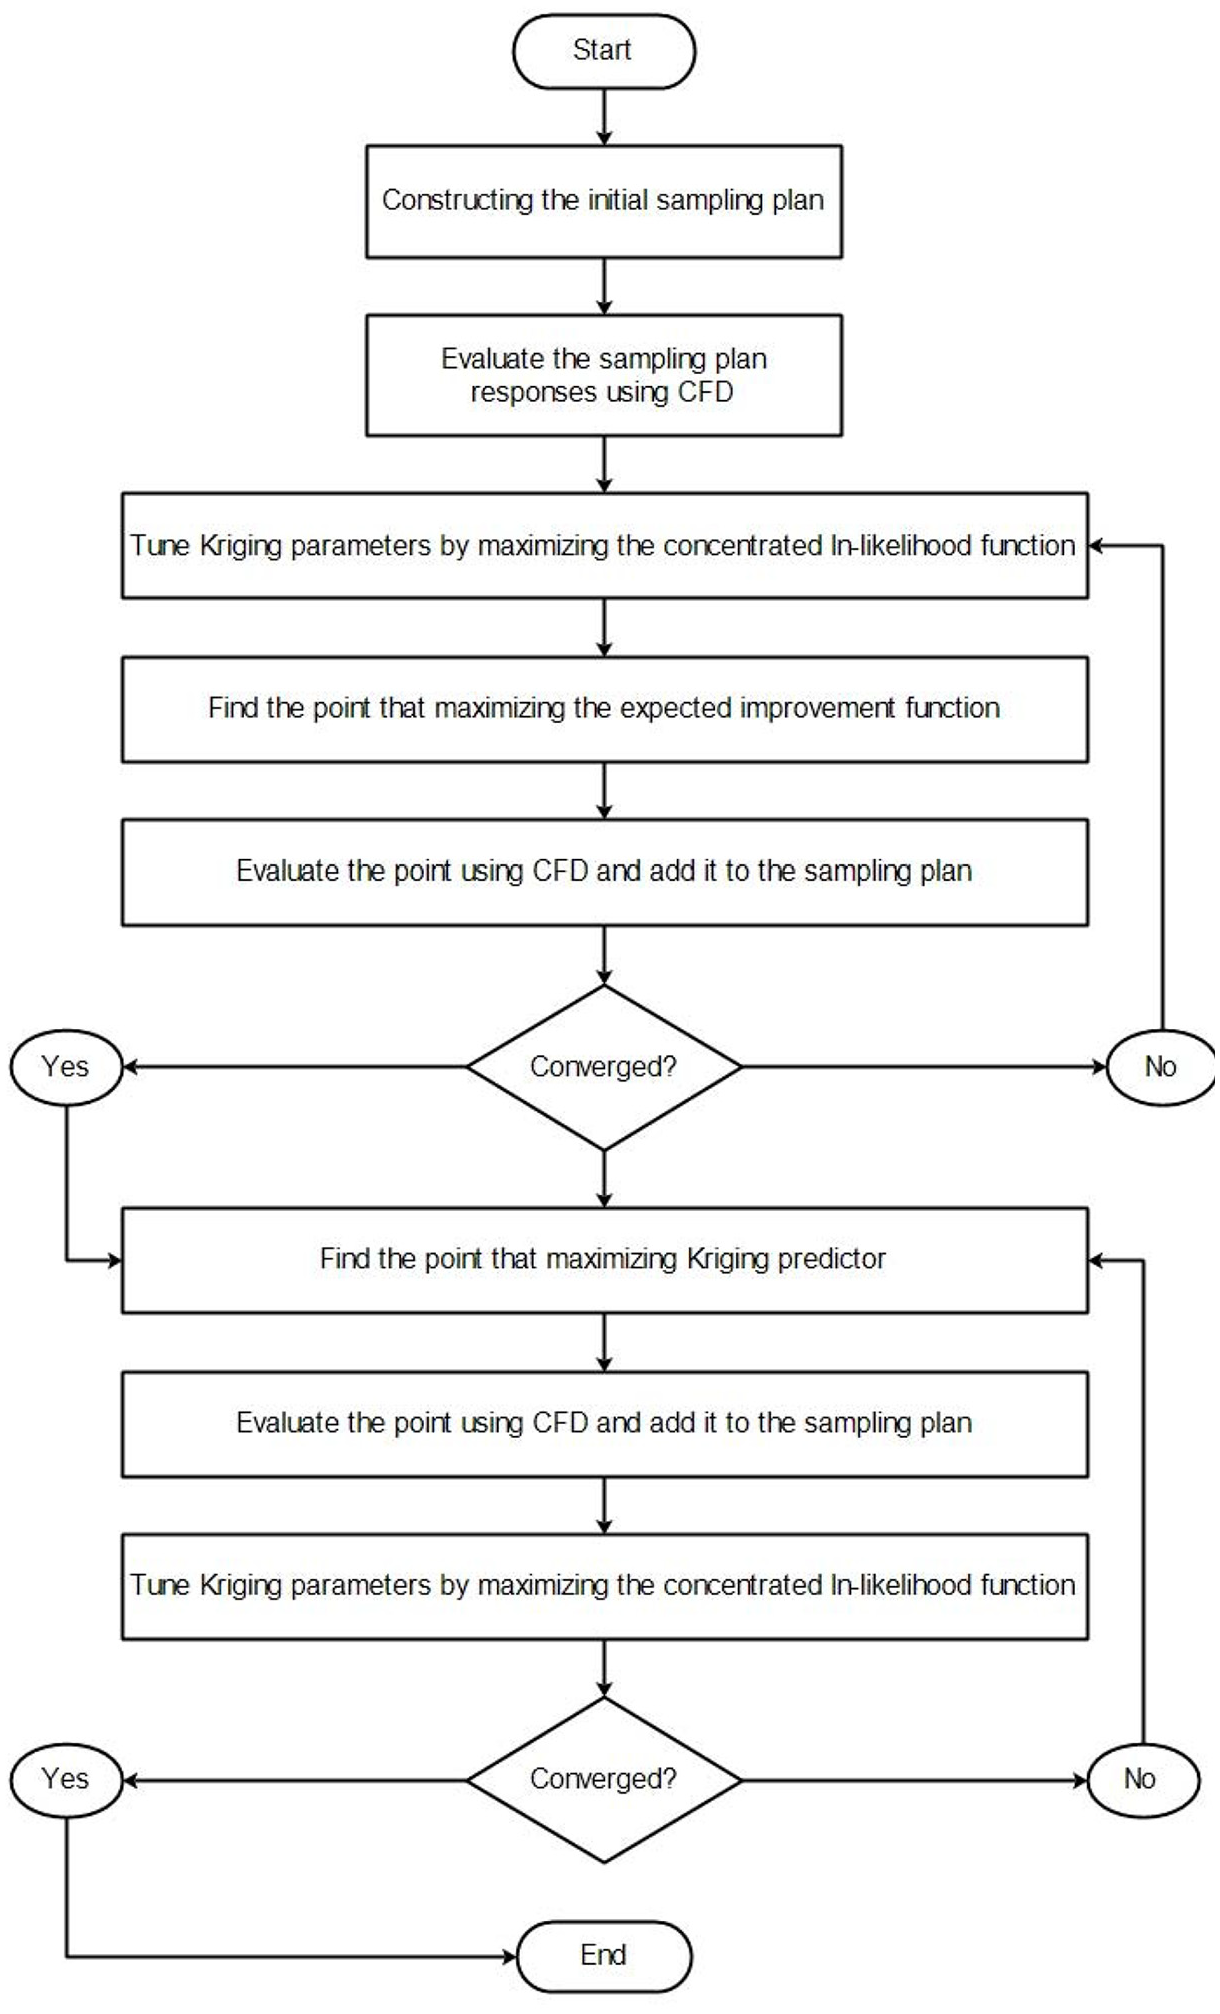
Flowchart of ejector optimization procedure.
The construction of the required ejector geometries and corresponding grids was performed manually for each ejector. The setting inputs to simulation software such as boundary conditions, physical model, and solver settings were applied though ANSYS Fluent journal commands. The entrainment ratio evaluation from ANSYS Fluent software and input to MATLAB optimization code were performed manually. All simulations have been performed using a laptop with 8 GB of RAM and 2.40 GHz CPU. In average, the calculation time is around 8–10 h for each run.
Results and discussions
The initial regression Kriging model has been trained with a set of 90 points. Most of the tested ejectors in the initial 90 points sampling plan are in the back-flow mode, since the entrainment ratio is negative and only 11 ejectors from the data set work with a positive entrainment ratio. As mentioned above, the infill process was stopped if the convergency criteria reached. The infill process based on maximizing the expectation of improvement was stopped after 106 infill processes, and the maximum value of the entrainment ratio was not changed for the 20 infill processes based on maximizing Kriging prediction. The final sampling plan of 216 points has been reached. The simulated 126 infill points have 103 ejectors working with a positive entrainment ratio. The total number of the simulated ejectors working with a positive entrainment ratio was 114. In contrast to the initial sampling plan, the median of the entrainment ratios is positive which means that the infill process is concentrated in the area of the maximum entrainment ratio as demonstrated in Table 6.
Sampling plans of statistical data of the entrainment ratio.

The model proved its ability to fit the data set successfully since the training root mean square error for the data set is smaller than
Converged regression Kriging model tuned parameters.
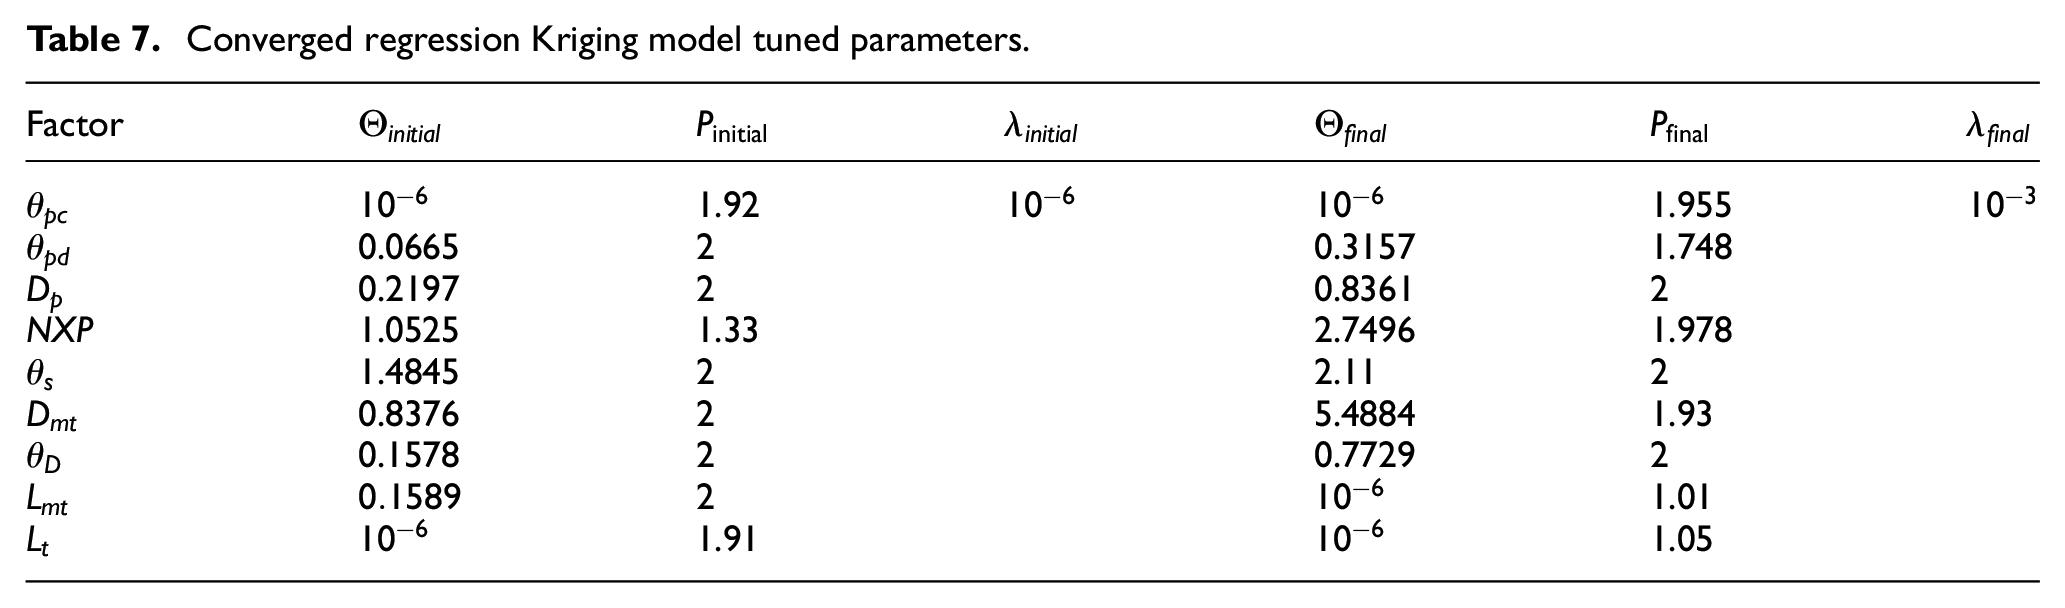
Furthermore, the optimum value of
Figure 5 illustrated the main effect of the significant factors according to the converged Kriging model prediction on the entrainment ratio. The plot depicted by varying one factor at a time in the range stated in Table 4, while the other factors were kept constant at the values which gives the maximum entrainment ratio of (19.35%) which stated in Table 7.

Main effect plot of six ejector geometrical factor according to converged Kriging model.
The negative values of the entrainment ratio presented reveal the sensitivity of the studied factors. The demonstrated trends in Figure 5 showed an agreement with the trends found in the literature works.6,7 The effect of the primary nozzle divergent angle,
Kriging model ranked the mixing tube diameter,
Figure 5 reveals that, the one factor at a time plot comprises no information about the interaction between the factors, since it just demonstrates the main effect of the factors under study. In order to build a mental image of the constructed Kriging model, two-factor slices have been extracted from the model and arranged as tiles in a matrix as shown in Figure 6. The matrix of the contour plots in Figure 6 is constructed by plotting diffuser inclination angle,

Kriging nested tile plot for the top four factors based on converged sampling plan, in each tile the x-axis represents
The optimum ejector
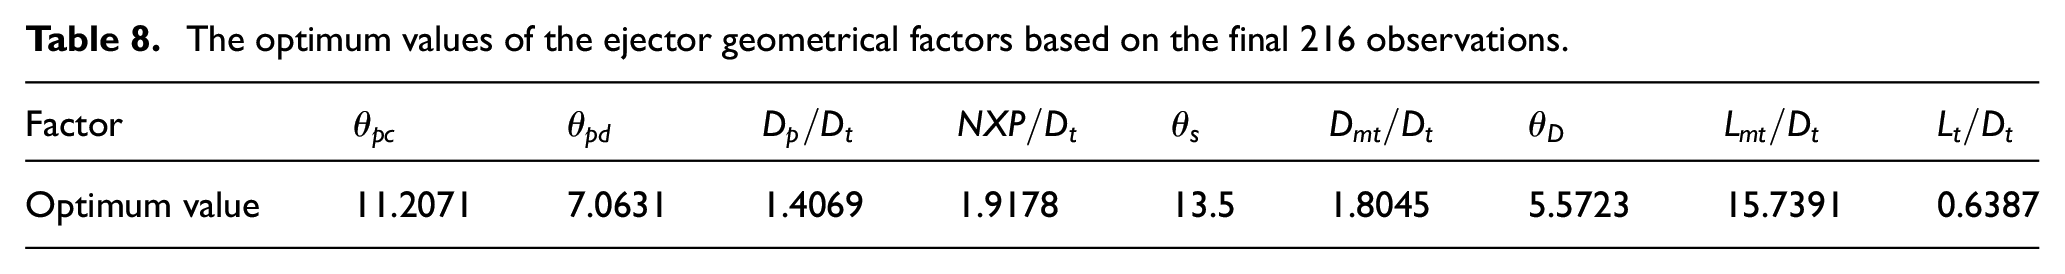
The optimum values for the nine ejector geometrical factors are summarized in Table 8. The optimum ejector is simulated to validate the Kriging result. The grid independency study for the optimum ejector design is performed to be sure that, the obtained results are grid independence. The GCI analysis results in Table 9 demonstrate that, the fine grid is sufficient to represent the ejector flow characteristics with a high resolution.
The optimum values of the ejector geometrical factors based on the final 216 observations.
Grid convergence index calculations results for the optimum ejector design.

The value at zero grid space (fexact equation (18)).
The optimum ejector design with the fine mesh size is simulated and the flow field is illustrated in Figure 7. Figure 7(a) and (b) represents Mach number and pressure contour, respectively. Figure 7(d) illustrates the pressure distribution along ejector center line, and Figure 7(d) demonstrates the sonic lines inside the ejector. As shown in Figure 7(a) and (b), the primary flow expanded in the primary nozzle and discharged in the mixing section before the mixing tube. The flow continually expands in the mixing section because its pressure is still higher than the pressure in the mixing section as revealed in Figure 7(c). After that the diamond waves are induced in the jet core. The high velocity difference between the primary and the induced flow forms the shear stress layer. The shear stress layer along with the mixing tube wall forms the converging duct for the secondary flow in which the induced flow accelerated to the sonic speed and choked since the sonic line is very close to the wall as shown in the sonic line plot in Figure 7(d). The sonic line plotted by connecting the center of the cells which have Mach number value of one.

The flow characteristics of the optimum ejector design. (a) Mach number flow field of the optimum ejector design, (b) pressure flow field of the optimum ejector design, (c) static pressure distribution along the optimum ejector design center line, and (d) sonic lines plot of the optimum ejector design.
After the choking of the induced flow, strong shock has formed in the mixing tube and the second series of shock waves induced. At 0.04 m, after the beginning of the mixing tube, the second series of shock waves vanished and the static pressure gradually recovers to the back-pressure at the end of the mixing tube and the diffuser. Because of the choking of the induced flow, the entrainment ratio of the optimum ejector design is no longer affected by the reduction in the back-pressure of the ejector.
Conclusion
In this study, the effect of nine ejector geometrical factors on the entrainment ratio is investigated and the optimum ejector design is obtained at 12 MPa motive pressure, 2 MPa induced pressure, and 5.2 MPa discharge pressure using CFD technique, and surrogate-based optimization approach. The CFD model is validated against experimental data from the literature and the validation showed a good agreement with the experimental data with an average error of
The primary nozzle convergent angle and throat length have no effect on the entrainment ratio.
Kriging model based on the final data set failed to predict the significance of the mixing tube length.
Mixing tube diameter, primary nozzle exit position, and secondary nozzle incitation angle are the most effective factors on the entrainment ratio based on Kriging prediction. When all factors are optimum, small effect of the secondary nozzle incitation angle has been obtained.
The optimum primary nozzle convergent and divergent angles are 11.2° and 7.06°, respectively. While the optimum primary nozzle exit diameter, throat length, and primary nozzle exit position and nozzle incitation angle are 6.47, 2.9, and 8.82 mm and 13.5°, respectively. In addition, the optimum mixing tube diameter and length are 8.3 and 72.4 mm, respectively; and the optimum diffuser angle is 5.57°. The optimum design achieves entrainment ratio of
Surrogate-based optimization approach using Kriging as a surrogate model along with CFD represents as an effective way to optimize the ejector geometrical factors, and to investigate their effects on the entrainment ratio.
Footnotes
Appendix 1
Handling Editor: James Baldwin
Declaration of conflicting interests
The author(s) declared no potential conflicts of interest with respect to the research, authorship, and/or publication of this article.
Funding
The author(s) received no financial support for the research, authorship, and/or publication of this article.