
Abstract
For identifying the operation situations of centrifugal pumps by artificial intelligence, we performed an experiment on multi-flow conditions. The multi-flow conditions were simulated by adjusting an automatic flow-regulating valve installed on outlet pipe, and the vertical vibration signals of 20 flow points at the bearing house were collected by the test system. By time-domain analysis, frequency-domain analysis, information entropy, empirical modal decomposition, and wavelet packet decomposition methods, a comprehensive feature space was constructed. In addition, the optimal features were selected by Fisher discriminant ratio, and the dimensionality of the selected optimal features was reduced with principal component analysis. Finally, support vector machine algorithm was employed to identify the real-time flow condition, and the hyper-parameters of support vector machine classifier model were optimized by a grid search technique. Results show that the vibration test can effectively simulate the operation situation of centrifugal pumps under multi-flow conditions, and the proposed multi-flow conditions identification method has achieved a good identification performance.
Keywords
Introduction
Centrifugal pumps are widely used in chemical, electric power, metallurgy, energy, and many applications for the roles in fluid transports. Due to variations of operating conditions or blockage in pipelines and so on, centrifugal pumps always run in off-design conditions, resulting in several harmful consequences such as abnormal noise, severe vibration, and lower operating efficiency. In addition, the performance of a centrifugal pump deteriorates when it is operated because its components physically degrade. The above serious problems have a direct effect on the desired pump characteristics. Fortunately, with the help of continuous condition monitoring of the pump system, the operational situation of pump can be captured in time. The downtime and repair costs are reduced, and the unexpected pump failures are prevented, so as to ensure effective operation. Therefore, condition motoring of a centrifugal pump system at an early stage is very important.
So far, several scholars have paid attention on condition motoring of centrifugal pump. McKee et al.1,2 introduced the fault modes of centrifugal pump, and reviewed the available diagnostic and prognostic methods on centrifugal pump. Compared to the operating conditions, such as current, voltage, vacuum gauge reading, and pressure gauge reading, vibration signals are widely applied in condition motoring of centrifugal pump. Wang and Chen 3 presented that the vibration signal was effective in fault diagnosis of centrifugal pump, because the vibration signals carried dynamic information about the machine state. Xue et al. 4 also pointed out that vibration signature is the most revealing information reflecting the condition of rotating machinery.
Effective feature extraction of vibration signal is a vital step to ensure the accuracy of fault diagnosis. Different approaches have been applied in feature analysis of centrifugal pump. Samanipour et al. 5 detected cavitations of centrifugal pump using pressure time-domain features. Kumar and Kumar 6 presented an automatic detection method of centrifugal pump using time–frequency features. Muralidharan and Sugumaran7,8 proposed fault diagnosis methods of monoblock centrifugal pump using wavelet features. Azizi et al. 9 presented a hybrid feature selection technique for cavitation severity in centrifugal pump. Yu et al. 10 proposed a principal component analysis (PCA)-based fault detection methodology for sewage source heat pump system. Zhang et al. 11 presented a variational mode decomposition method in rolling bearings fault diagnosis of the multistage centrifugal pump. Sakthivel et al. 12 compared dimensionality reduction techniques for fault diagnosis of monoblock centrifugal pump by vibration signals. Liu et al. 13 developed dimensionality reduction of submersible plunger pump fault diagnosis via locally linear embedding, wavelet transformation, and singular value decomposition methods.
In term of comparative study of identification performance, several artificial intelligence algorithms have also applied in centrifugal pump. Muralidharan and colleagues14,15 applied naive Bayes, Bayes net, and support vector machine (SVM) in fault diagnosis of monoblock centrifugal pump. Sakthivel et al.16,17 presented rough-set, fuzzy set, and gene expression programming in fault diagnosis of monoblock centrifugal pump as well. Wang and colleagues18,19 introduced deep belief networks and minimum entropy deconvolution to detect faults in axial piston pumps. Panda et al. 20 studied the flow blockages in the inlet pipe and impending bubble formation in the centrifugal pump by SVM. Kang et al. 21 applied the status coupling relationship in fault diagnosis of the pipeline and pump unit systems for improving fault detection sensitivity and reducing false alarm rate. Buono et al. 22 investigated the possible cavitation problem for gerotor pumps and developed fault diagnosis by auto-regressive-moving-average technique. ALTobi et al. 23 studied fault diagnosis of a centrifugal pump by genetic algorithm, multilayer feedforward perceptron, SVM, and continuous wavelet transform. Al-Obaidi 24 detected and diagnosed the cavitation phenomenon within centrifugal pumps by vibration analysis. Bordoloi and Tiwari 25 discussed the optimal SVM method for identification of suction flow blockages and casing cavitations in centrifugal pumps. Azadeh et al. 26 proposed a flexible algorithm based on artificial neural networks (ANNs) and SVM for fault diagnosis of centrifugal pump. However, ANN has the limitation on the intractability of determining the hidden layer size and learning rate. Fuzzy logic always suffers from the accuracy of classifier. SVM exhibits better classification accuracy, but the drawback is the high algorithmic complexity and required to set its hyper-parameters in advance properly.
For above reasons, this article focuses on a multi-flow conditions identification algorithm of centrifugal pump by combination of Fisher discriminant ratio (FDR), PCA, and SVM. Radial basis function (RBF) is selected for SVM model, and grid search technique is employed to optimize the hyper-parameters (penalty parameter “c” and kernel function parameter “g”) of SVM model. A comprehensive feature space is constructed by time-domain analysis, frequency-domain analysis, information entropy, empirical modal decomposition (EMD), and wavelet packet decomposition approaches. The multi-conditions identification algorithm processes the feature space by FDR and PCA, and the fusion features obtained from FDR and PCA are employed for multi-flow conditions identification via SVM.
This article is organized as follows: in section “Proposed multi-flow conditions identification algorithm,” the proposed multi-conditions identification method is introduced; section “Experiment studies” depicts multi-flow conditions experiment; the results are discussed in section “Results and discussion”; and in section “Conclusion,” conclusion for this article is given.
Proposed multi-flow conditions identification algorithm
As shown in Figure 1, this article proposed a multi-flow conditions identification algorithm for centrifugal pump. The procedure of the proposed algorithm can be depicted as follows:
Step 1: data acquisition. The experimental data were collected by sensors installed on centrifugal pump, including vibration, inlet and outlet pressures, shaft power, and so on. According to actual monitoring requirements, sensor selection and monitoring points layout were taken into account.
Step 2: feature space construction. Generally, the data collected from the sensors are not directly used for identification, but are preprocessed by modern signal processing technology, such as filtering or feature extraction. Time-domain analysis, frequency-domain analysis, information entropy, EMD, and wavelet packet decomposition methods are employed to construct feature space in this article.
Step 3: optimal feature selection. The most sensitive features of system are selected from feature space as the optimal features.
Step 4: feature fusion. For realizing dimension reduction and eliminating redundant information, PCA method is employed to feature fusion.
Step 5: multi-flow conditions identification. SVM classifier is constructed for multi-flow conditions identification, and the hyper-parameters of SVM classifier model are optimized by a grid search technique.

The identification procedure of multi-flow conditions.
PCA
PCA 27 is a linear technique for dimensionality reduction, which means that it performs dimensionality reduction by embedding the data (p-dimensionality) into a lower dimensionality linear subspace (m-dimensionality). The calculation procedure of PCA 28 is as follows:
Step 1. Let
Step 2. Normalized the raw feature space data
Step 3. Calculate the covariance matrix
Step 4. Calculate the eigenvalues of covariance matrix
Step 5. Choosing components and forming a feature vector,
Step 6. Deriving the new m-dimensionality data
Multi-conditions identification based on SVM
SVM
29
has been proven to show an excellent generalization capability and has been successfully applied in machinery fault diagnosis. For linearly separable part, there is an optimal hyper-plane

where n, d,
The optimal classification function is

where
For linear non-separable part, the main idea is to map the original d-dimensional space into a d′-dimensional space
The objective function is

The optimal classification function is

Experiment studies
Several serious problems, such as abnormal noise, high vibration, leakage, and reduction of water head and efficiency, are caused by non-design operational conditions of centrifugal pump. To make clear the effect of different flow conditions on operation of centrifugal pump, we performed a vibration test bench on centrifugal pump. Data acquisition and pump with sensors are discussed in the following topics under sections “Experimental setup” and “Experimental procedure,” respectively.
Experimental setup
Take KCC250X 200-315 centrifugal pump as the test object, and the specific performance parameters are shown in Table 1, where rotational speed is 1450 r/min.
The performance parameters of centrifugal pumps.

NPSHR: net positive suction head required.
Since the casing of the centrifugal pump is integrated with the bearing casing of the centrifugal pump, the vibration changes of these two sensor placement are minute, and this article selects the bearing housing of the centrifugal pump as the vibration sensor placement. In addition, the vertical direction vibration is the physical quantity that best reflects the operating condition of the rotating machine, so the vertical direction vibration signal of centrifugal pump is measured. An automatic test system equipped with multi-parameters measuring instrument was adopted in the tests, which reached China National Standard with Class B for measurement accuracy. The performance test and vibration test of centrifugal pump were carried out in a special test rig as shown in Figure 2, where Figure 2(a) shows experimental scenes, Figure 2(b) shows partial enlarged drawing of test section, Figure 2(c) shows the schematic diagram of the centrifugal pump test system, and Figure 2(d) shows the layout of vibration monitoring point.
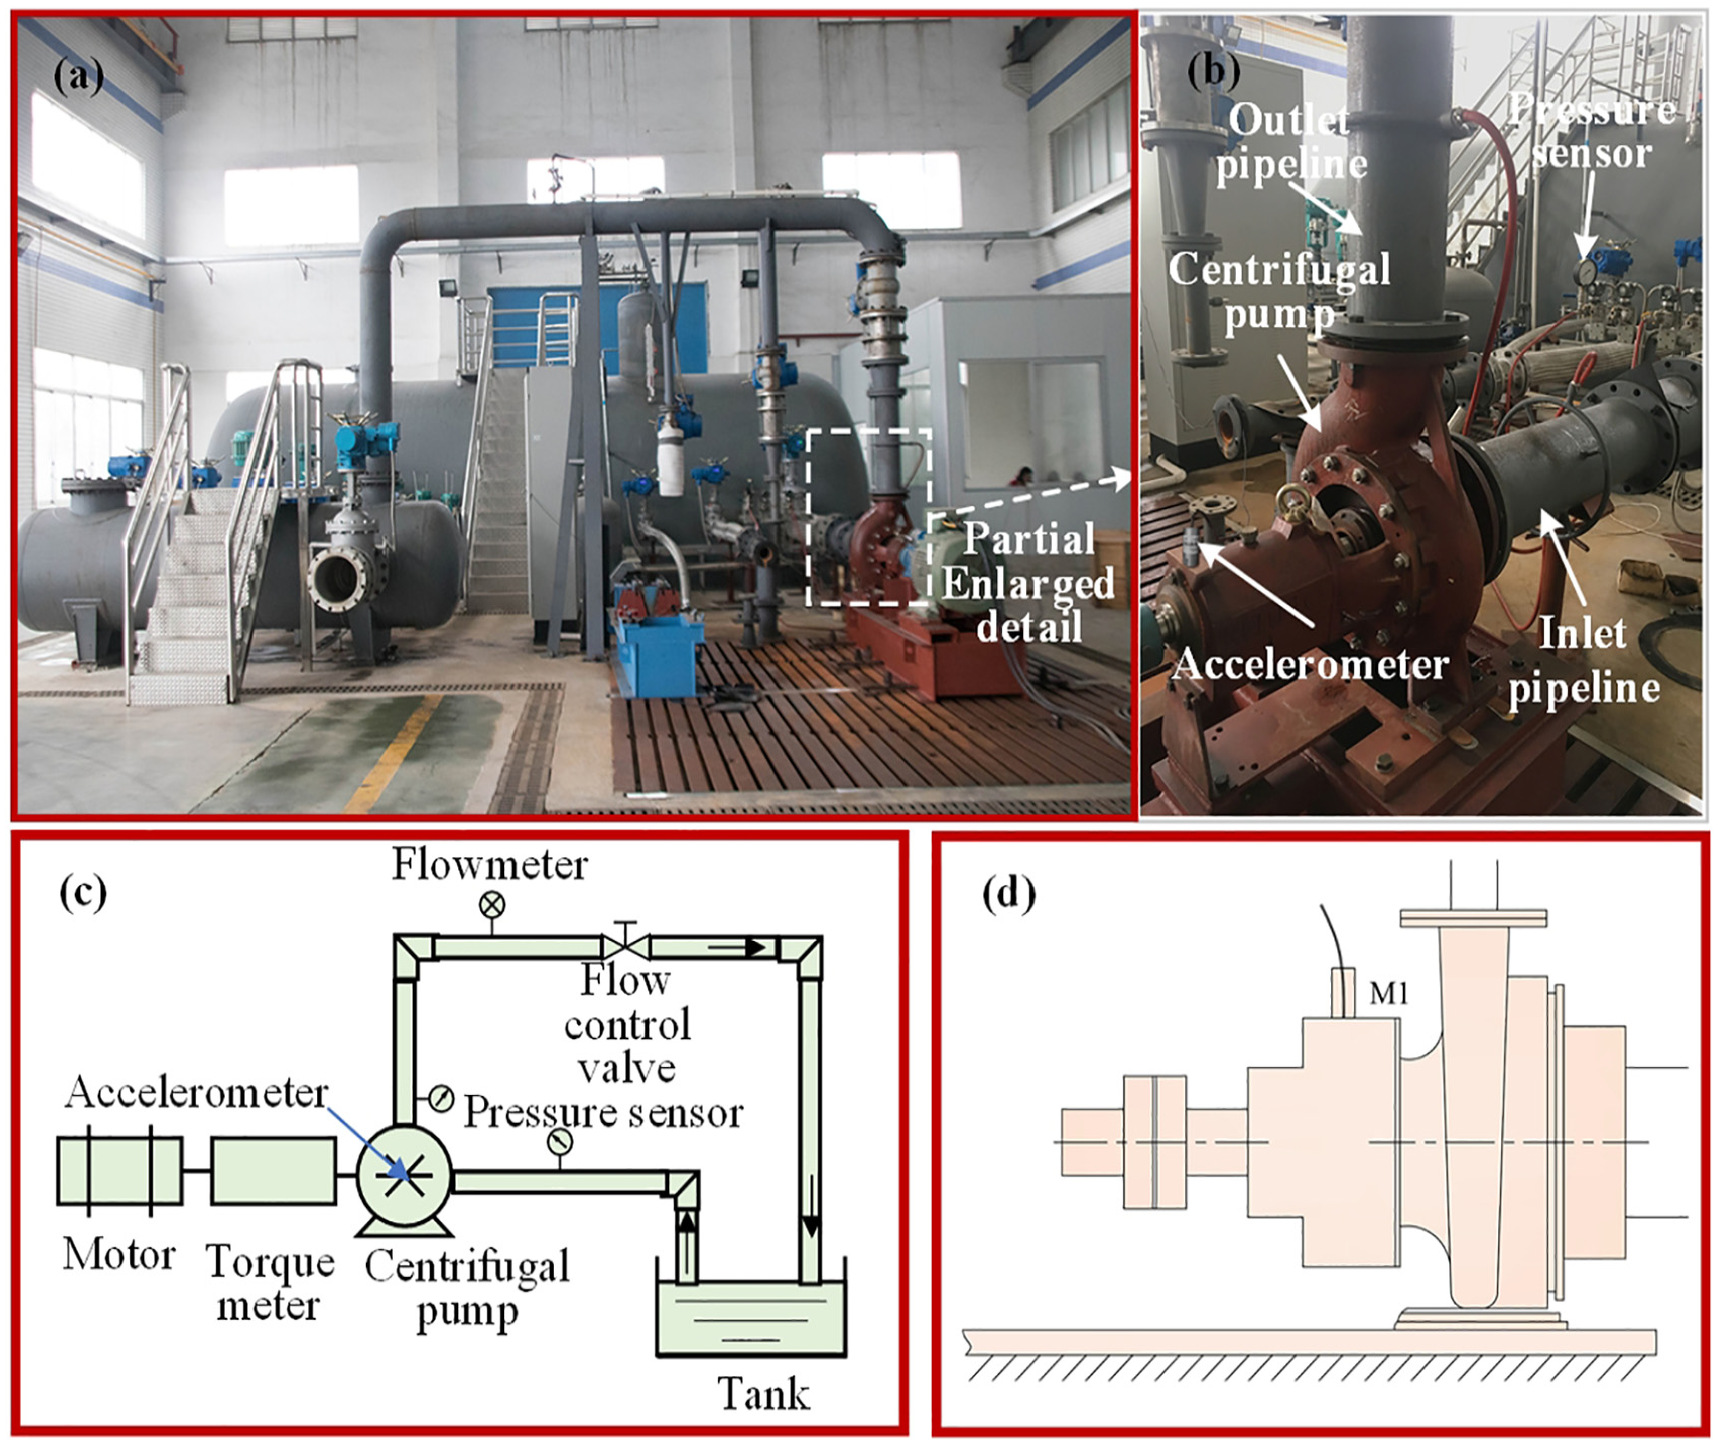
Test rig of centrifugal pump: (a) experimental scenes, (b) partial enlarged drawing of test section, (c) schematic diagram of a centrifugal pump test system and (d) layout of vibration monitoring point.
From Figure 2, it can be seen that the operating principle of the centrifugal pump test system is as follows. The motor is used to drive the centrifugal pump. The speed of centrifugal pump is regulated by torque meter, and the flow is adjusting by the automatic flow-regulating valve. Pressure drop was measured by the pressure gauges set at the inlet and the outlet of centrifugal pump. Flow rate was measured by flow meter. The data of rotational speed and torque could be obtained by torque meter. By adjusting the opening of the automatic flow-regulating valve installed on the outlet of centrifugal pump, the performance parameters in different operating points under a certain rotational speed were measured.
Experimental procedure
Performance test and vibration test were performed in this article, and the parameters such as vibration, flow, pressure, speed, and shaft power were collected. By the automatic flow-regulating valve, 20 flow monitoring points of centrifugal pump as shown in Table 2 were simulated, covering zero-flow, low-flow, design-flow, and high-flow conditions. There are totally 3860 data samples, where the flow point #1 takes 60 data samples and the remaining flow points take 200 data samples, 1024 data points in each data sample. The testing process was strictly conducted in accordance with the GB/T 29531-2013 methods of measuring and evaluating vibration of pumps, 30 and the main test steps were as follows:
The test prototype is installed, and the centrifugal pump is adjusted to operate in various conditions normally.
The sensors, data acquisition card, and corresponding electronic control element are installed on the test prototype, and the test rig is connected with the IPC (industrial personal computer).
The test rig of centrifugal pump is started with design speed (1450 r/min). To ensure the reliability and accuracy of the experimental data and the test instruments, the signals—such as pressure and speed, vibration, flow, speed, and power—are collected for initial proofreading.
After completion of step 3, the vibration, flow rate, pressure, speed, and shaft power of the flow monitoring points in Table 2 are collected by adjusting the automatic flow-regulating valve installed on outlet pipe. Pump long-term operation in zero-flow condition may cause damage. Therefore, for operation of the pump safely, the monitoring time of zero-flow conditions is 3 min and the monitoring time of the remaining flow points is 10 min. The sampling frequency of the vibration acceleration is 1024 Hz, and the sampling interval is 1 s.
After the test, the water supply valve is closed, the pump is stopped, and the water in the pump is discharged.
The description of flow monitoring points

Results and discussion
Experimental results analysis
By the performance test, the characteristic parameters and vibration parameter covered the full-flow conditions were obtained in this article. After measuring all parameters, head, flow rate, output power, and efficiency of centrifugal pump were calculated. Through the performance test, this article obtains the external characteristic curve under its full-flow condition, as shown in Figure 3. From the performance curves of centrifugal pump, it can be seen that the best efficiency point determined by experiment is consistent with the design-flow point of 630 m3/h. As the flow rate increases, the overall head shows a downward trend, while the overall axial power tends to rise.

Performance curves of centrifugal pump.
Figure 4 shows the pump vibration signals and frequency diagrams of 20 flow monitoring points, and here, rotational frequency of centrifugal pump is 1450/60 = 24.17 Hz.

Time-domain signals and frequency diagrams of 20 flow monitoring points: (a) time-domain signals and (b) frequency diagrams.
From vibration time-domain signals (Figure 4(a)), we found that the changes of vibrations of the 20 flow monitoring points are not particularly evident. The maximum vibration acceleration value is appeared at flow point #1, indicating vibration of flow point #1 (i.e. zero-flow) is the most obvious. The minimum vibration acceleration value is appeared at flow point #15, indicating vibration of flow point #15 (i.e. design-flow) is relatively minimal and the fluctuation is not obvious. As flow rate increases, the vibration acceleration value declines from flow points #1 to #15 (i.e. zero-flow to design-flow); however, the vibration acceleration value rises from flow points #16 to #20 (i.e. design-flow to high-flow). In addition, the vibration acceleration value at low-flow is slightly higher than the vibration acceleration value at high-flow.
From the frequency diagrams of 20 flow monitoring points (Figure 4(b)), it can be seen that the vibration amplitude of the rotational frequency (24.17 Hz) is relatively stable, which is generally kept near 4.0, and the fluctuation is small. In other frequencies, such as 128 Hz, there are fluid-induced vibrations. The maximum amplitude value of fluid-induced vibration appeared at flow point #1, indicating that vibration of flow point #1 (i.e. zero-flow) is most obvious. The minimum amplitude value of fluid-induced vibration appeared at flow point #15, indicating that vibration of flow point #15 (i.e. design-flow) is relatively minimal. During the change process of flow point from #1 to #15, the fluid-induced vibration of the pump shows a weakening trend. This is because that there is a working medium in the pump to greatly improve the state of operation so as to reduce the vibration obviously, but the efficiency of centrifugal pump is relatively low in this condition. When the flow rate exceeds the design-flow point, the shaft power of the pump increases and the pump may be overloaded.
In short, the experimental results are consistent with the actual situations, verifying the correctness of this experiment. From the above analysis, we can see that the vibration of centrifugal pump is roughly divided into four conditions, that is, zero-flow, low-flow, design-flow, and high-flow. The vibration intensity and frequency diagrams of centrifugal pump in full-flow conditions are shown in Figure 5, where root mean square (RMS) value of vibration acceleration is employed to reflect vibration intensity of centrifugal pump.

Vibration intensity and frequency diagram of full-flow conditions: (a) vibration intensity and (b) frequency diagram.
From Figure 5, there are four groups, that is, zero-flow, low-flow, design-flow, and high-flow. In full-flow conditions, the amplitude of the rotation frequency has little change and is kept at about 4.0, while the amplitude of fluid-induced vibration varies greatly. Generally, zero-flow is extreme condition, vibration intensity is highest, and fluid-induced vibration is maximum as well. This is because that the working medium inside the centrifugal pump is discharged from the outlet of the pump chamber. In addition, the inlet working medium does not enter pump in time for the inlet valve to shut up, so as to result in a violent vibration. In design-flow condition, centrifugal pump is in good operating condition with the highest operating efficiency and minimum fluid-induced vibration. Similarly, the vibration variations of low-flow and high-flow conditions are relatively stable and the amplitudes are between zero-flow and design-flow conditions. The vibration amplitude of low-flow is slightly higher than that in high-flow condition.
Multi-conditions identification
Figure 6 shows 55 serial numbering feature parameters, including 16 time-domain parameters, 13 frequency-domain parameters, 7 information entropy features, 16 wavelet packet energy features, and 3 EMD energy features.

The 55 sets of fault features.
It is noted that seven information entropy features are approximate entropy, 31 sample entropy, 32 singular spectrum Shannon entropy, 33 singular spectrum index entropy, amplitude spectrum entropy, power spectrum entropy, and wavelet energy spectrum entropy, respectively; wavelet packet energy features are four-depth decomposition of wavelet packet. 34 The EMD energy features are selected the frist three EMD features; 35 16 time-domain and 13 frequency-domain features are shown in Appendix 1.
It can be seen from Figure 6, the features such as feature #2 (RMS) and #6 (Skewness) fluctuate significantly, but the other features such as feature #1 (Mean) and #55 (the third EMD energy feature) are changed little, even irregular. According to the irregular features, the identification performance is seriously affected by additional interference information. Therefore, it is necessary to select sensitive features for improving the accuracy of multi-conditions identification.
Effective feature selection is an important step to ensure the accuracy of identification. For the purpose of selecting the sensitive features, FDR is carried out to feature selection, realizing the maximum distance between the classes and the smallest distance within the class. The FDR is calculated as follows

where f is feature parameter;
Figure 7 shows the FDR value of 55 feature parameters, and the larger the FDR value indicates that the feature is more separable. From mean of 55 FDR values, feature selection threshold is set to 4. the 24 feature parameters of {#2, #6, #7, #8, #9, #11, #14, #16, #17, # 9, #20, #22, #26, #28, #29, #30, #31, #32, #33, #34, #35, #37, #53, #54} are greater than the selection threshold.

FDR value of feature parameters.
For multi-conditions identification, the flow point #1 takes 30 data samples as the train samples and 30 data samples as the test samples. The remaining 19 flow points take 100 data samples as the train samples and 100 data samples as the test samples, respectively. Thus, there are totally 1930 train samples and 1930 test samples. To verify the effectiveness and superiority of the proposed multi-conditions identification approach, the following three methods were compared: (1) SVM: full feature parameters were directly employed to identification by SVM method. (2) FDR + SVM: 24 optimal features selected by FDR were employed to identification by SVM method. (3) The proposed method: FDR + PCA + SVM. Six fusion features obtained by PCA were employed to identification by SVM method. In this article, 24 optimal features were selected by FDR and then 24 optimal features were reduced into six fusion features by PCA. RBF was selected for SVM model, and the hyper-parameters (Penalty parameter “c” and kernel function parameter “g”) of SVM model were optimized by grid search technique. Table 3 and Figure 8 show the time-cost and results of above three methods, respectively, where 1, 2, 3, and 4 denote zero-flow, low-flow, design-flow and high-flow conditions. In addition, the running environment is Matlab2015b software, CPU is Intel® Core™ i5-6500 CPU@3.2 GHz, and RAM is 8 GB.
The identification results and time-cost.
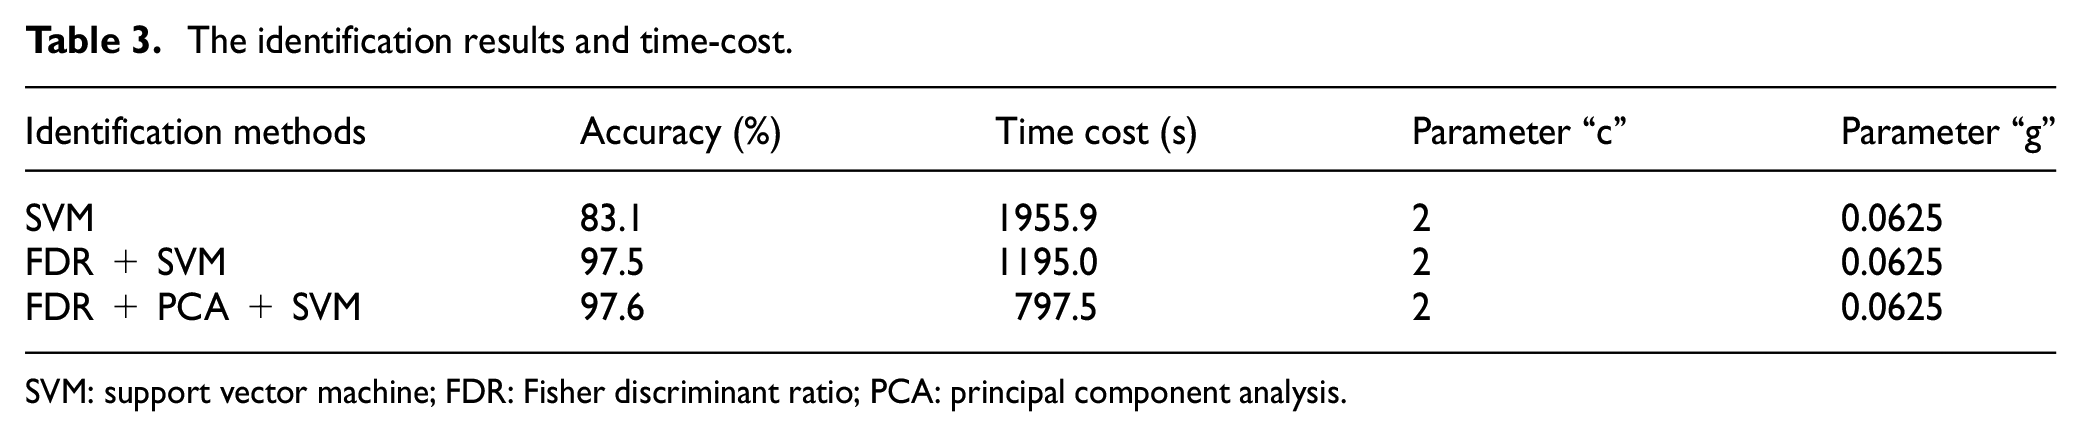
SVM: support vector machine; FDR: Fisher discriminant ratio; PCA: principal component analysis.
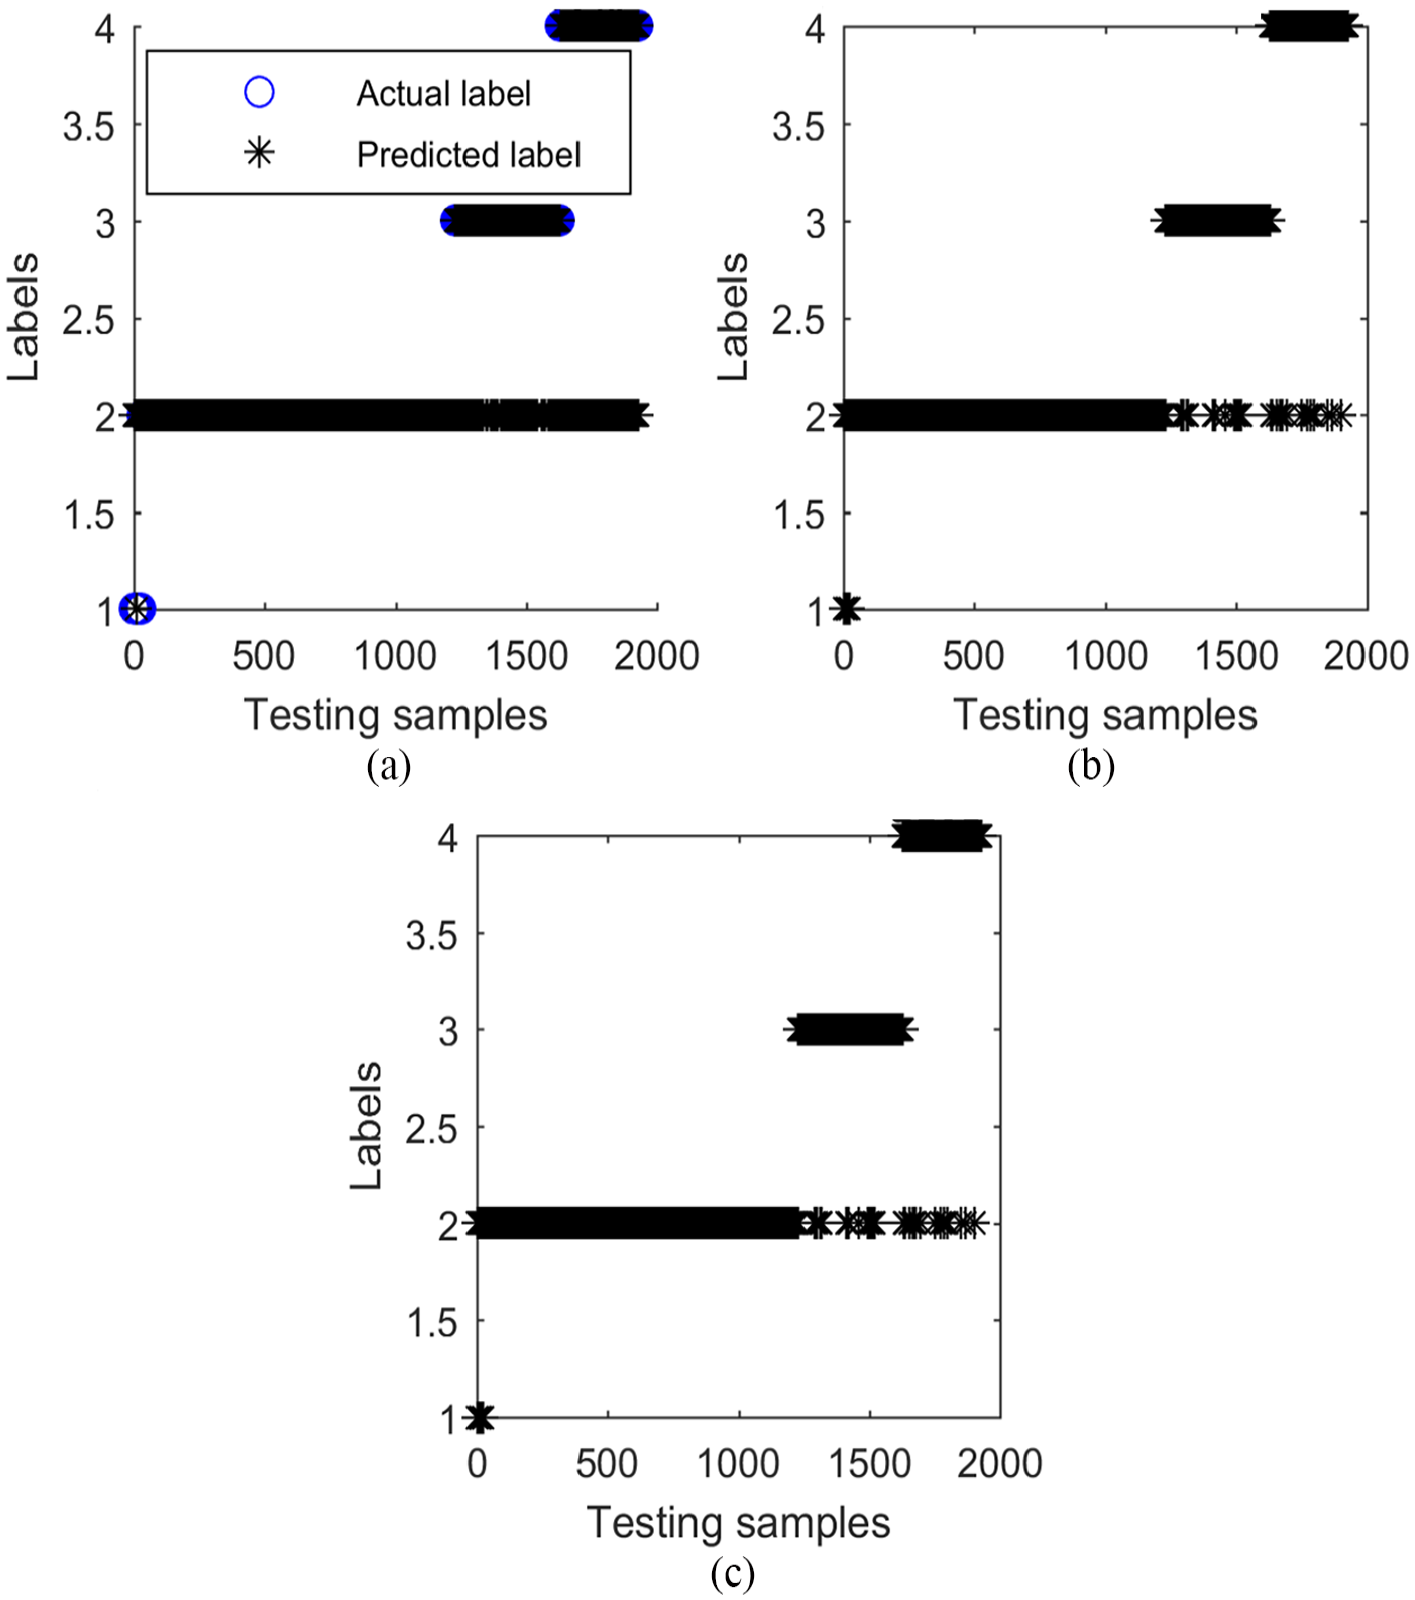
Identification results: (a) SVM: accuracy 83.1%, (b) FDR + SVM: accuracy 97.5% and (c) FDR + PCA + SVM: accuracy 97.6%.
From Table 3 and Figure 8, it can be seen that the accuracy of the 55 feature parameters directly identified by SVM method is 83.1%, which is relatively low and the time-cost (1955.9 s) is longest as well. The accuracy of FDR + SVM is increased to 97.5%, and the time-cost (1195.0 s) was lower than the first method. The accuracy of FDR + PCA + SVM method is 97.6%, which is slightly higher than FDR + SVM, and the time-cost (797.5 s) is the lowest among the three methods. Therefore, it is concluded that the proposed algorithm is the most effective multi-conditions identification approach among the three methods.
To verify the superiority of the proposed multi-conditions identification approach, the performances were compared with the backpropagation neural network (BPNN) and k-nearest neighbor (KNN) models. Table 4 presents the accuracy of multi-conditions identification methods.
Comparison of the accuracy of multi-conditions identification models.

FDR: Fisher discriminant ratio; PCA: principal component analysis; SVM: support vector machine; BPNN: backpropagation neural network; KNN: k-nearest neighbor.
In Table 4, we can see that the SVM model has the best performance by inputting FDR or FDR + PCA features. BPNN performs relatively worse than SVM, but better than KNN. BPNN and KNN show much more robustness in such three feature extraction methods than SVM, indicating that such three feature extraction methods have less impact on the performance of BPNN and KNN. For SVM model, the performance is the lowest by inputting the raw features directly. However, the performance is significantly increasing by FDR or FDR + PCA feature extraction methods, indicating that the quality of features is improved by feature extraction method based on FDR or FDR + PCA. From the above analysis, we can conclude that the proposed multi-conditions identification approach (FDR + PCA + SVM) has the best performance among these models.
Conclusion
This article focuses on a multi-flow conditions algorithm for centrifugal pump by combining FDR, PCA, and SVM, and an experiment on multi-flow conditions is performed for verifying the accuracy and effectiveness of the proposed approach. We conclude this article with the following remarks:
The experimental results on multi-flow conditions are consistent with the actual situations, verifying the correctness of this experiment. The best efficiency point determined by experiment is consistent with the design-flow point of 630 m3/h as well.
By comparing with the SVM and FDR + SVM models, the accuracy of the proposed identification algorithm (FDR + PCA + SVM) is 97.6%, which is much higher than the accuracy of SVM model with 83.1%, but slightly higher than the accuracy of SVM + FDR model with 97.5%, indicating that the feature quality is effectively improved by the FDR method. In addition, the proposed identification algorithm (FDR + PCA + SVM) has a lowest time-cost with 797.5 s, indicating that the model complexity is reduced by the FDR and PCA methods.
By comparing with BPNN and KNN models, we found that the proposed multi-conditions identification approach (FDR + PCA + SVM) has the best performance among these models. Therefore, we concluded that the proposed multi-flow conditions identification algorithm has achieved a best performance and a lowest model complexity.
Footnotes
Appendix
Description of time-domain and frequency-domain features.

| No. | Feature | Definition |
|---|---|---|
| 1 | Mean | |
| 2 | Root mean square | |
| 3 | Mean square amplitude | |
| 4 | Mean absolute | |
| 5 | Skewness | |
| 6 | Kurtosis | |
| 7 | Standard deviation | |
| 8 | Max | |
| 9 | Min | |
| 10 | Peak to peak | |
| 11 | Shape factor | |
| 12 | Crest factor | |
| 13 | Impulse factor | |
| 14 | Clearance factor | |
| 15 | Skewness factor | |
| 16 | kurtosis factor | |
| 17 | Mean frequency | |
| 18 | Feature 2 | |
| 19 | Feature 3 | |
| 20 | Feature 4 | |
| 21 | Frequency center | |
| 22 | Standard deviation frequency | |
| 23 | Root mean square frequency | |
| 24 | Feature 8 | |
| 25 | Feature 9 | |
| 26 | Feature 10 | |
| 27 | Feature 11 | |
| 28 | Feature 12 | |
| 29 | Feature 13 |
Acknowledgements
The authors are grateful for the valuable comments and suggestions from the respected reviewers. The authors also sincerely thank Foshan Kenflo Industrial Pump Co., Ltd for supporting the multi-flow condition experiment.
Handling Editor: James Baldwin
Declaration of conflicting interests
The author(s) declared no potential conflicts of interest with respect to the research, authorship, and/or publication of this article.
Funding
The author(s) disclosed receipt of the following financial support for the research, authorship, and/or publication of this article: This study was supported by the National Natural Science Foundation of China (Grant No. 61463021 and 61963018), Young Scientists Object Program of Jiangxi Province in China (Grant No. 20144BCB23037), Natural Science Foundation of Jiangxi Province in China (Grant No. 20181BAB202020), Science and Technology Project in Education Department of Jiangxi Province in China (Grant No. GJJ180494), and Doctoral Scientific Research Foundation of Jiangxi University of Science and Technology in China (Grant No. 3401223356)