
Abstract
In this article, the effects of clocking effect on performance and vibration intensity of a five-stage centrifugal pump were investigated by experimental tests. The vibration characteristics of five positions in the pump were measured, including axial direction of the pump and horizontal and vertical directions of pump inlet and outlet. There are eight clocking schemes between the impellers in the test, which are arranged by orthogonal experimental design. The test results show that the clocking effect of impellers has little effect on the head and efficiency of the five-stage pump in the whole flow rate. Compared with the results of 0° stagger angle clocking scheme between each impeller, in the whole flow rate, the pulsation of pump head and efficiency is just 1.5% and 1.3%, respectively, under other clocking schemes of impellers. Instead, the impeller clocking has a significant effect on the vibration characteristics of the model pump. The maximum vibration intensity of the five-stage pump locates in the vertical direction of pump inlet within the whole flow rate. Under the best clocking scheme of impellers, the maximum vibration intensity of the pump can decrease by 23.1% and the mean vibration intensity can decrease by 17.3%.
Introduction
The clocking effect is a phenomenon that the performance of the turbo machine can be adjusted by changing the circumferential position of rotors or stators. It has a significant effect on the performance of turbo machines, such as turbines, compressors, fans, and pumps. 1
The clocking effect was first discovered by Walker and colleagues2,3 in compressors. Walker found that the noise could be reduced by 5–6 dB when the relative circumferential position of stators in a compressor was adjusted. Saren and colleagues4,5 conducted studies of clocking effect in a compressor, and the results indicated that the performance of a compressor can be improved obviously and the unsteady aerodynamic load of blades can be reduced. The achievements of Saren were confirmed by Hsu and Wo 6 based on experiments. Studies of Hsu indicated that the load of downstream stators can be significantly decreased by adjusting the relative position of rotors. In experiments, Sharma et al. 7 found that the efficiency of turbine was changed by 0.5% when the inlet of guide vanes was staggered with downstream stators in circumferential direction. Huber et al. 8 also found the same phenomenon in the experiment of turbine. Griffin et al. 9 confirmed the results of Huber by numerical calculation. He found that when the wake from upstream stators passes the front of upstream blade, the efficiency of the turbine is the best. When the wake from upstream blade went through the middle of channel of downstream stator, the efficiency of the turbine is the worst. Li et al. 10 found that the path of the wake from upstream rotor to the front of downstream blade can be changed by three-dimensional clocking effects in the turbine, and the efficiency could be improved in this way. Yang et al. 11 studied the impact of clocking effect on the aerodynamic performance of a turbo machine based on the numerical calculation and found that the staggered arrangement of upstream rotors in circumferential position can strengthen the wake from downstream stators and then the place where pressure fluctuation offsets on the blades changed; therefore, the interference between blades becomes weak. The above research results indicate that the clocking effect has a significant impact on the aerodynamic of turbo machines.
Although a lot of research on clocking effect has been done in aerodynamic turbo machines, the report about clocking effect in hydraulic machines is seldom. So, it is necessary to do more research about clocking effect in hydraulic machines.12,13 In this article, the impact of clocking effect on the energy performance and vibration characteristics of a multistage centrifugal pump has been studied by orthogonal test.
Experimental model
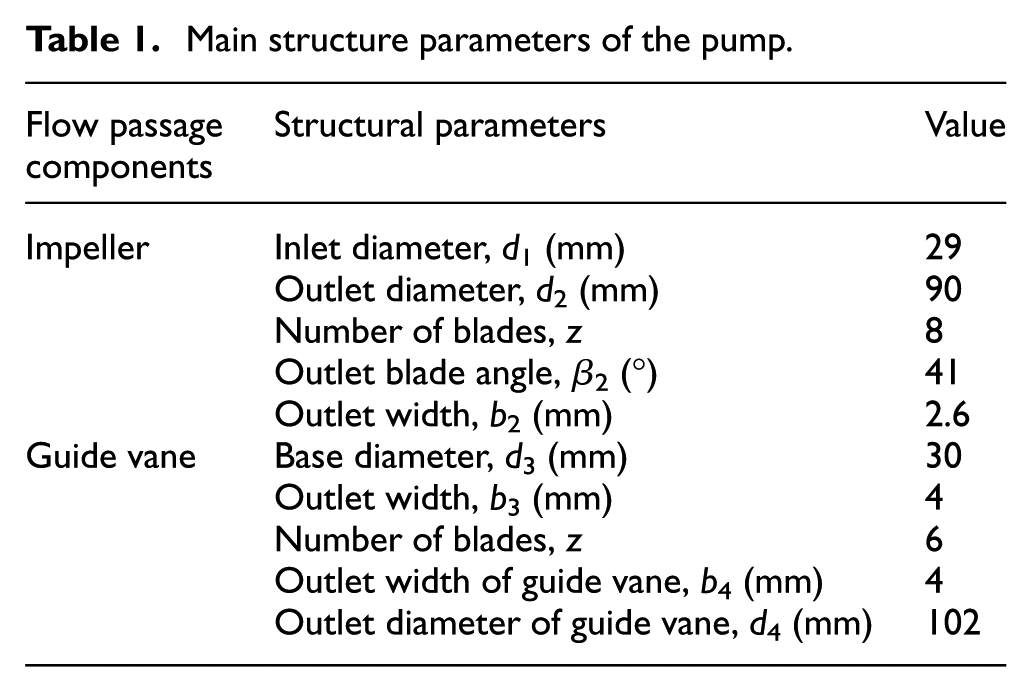
In this study, a horizontal centrifugal pump with five-stage impellers was used as the experimental model. The pump is designed to operate at 2900 r/min. The designed flow rate is 4.7 m3/h, and the designed head is 38.6 m. The pump has five same blades and five same guide vanes. Main parameters of impeller and guide vane are identified in Table 1. Figure 1 shows the arrangement of the impeller blades, and the angle θ between blades is 45°.
Main structure parameters of the pump.

Schematic of impeller blades.
Test rig and research scheme
Test rig
A synchronized test system of energy and vibration characteristics for multistage centrifugal pumps was used in this experiment. Figure 2 shows the graph of test rig. In order to improve test precision, the test pump was placed on a cement bench. 14
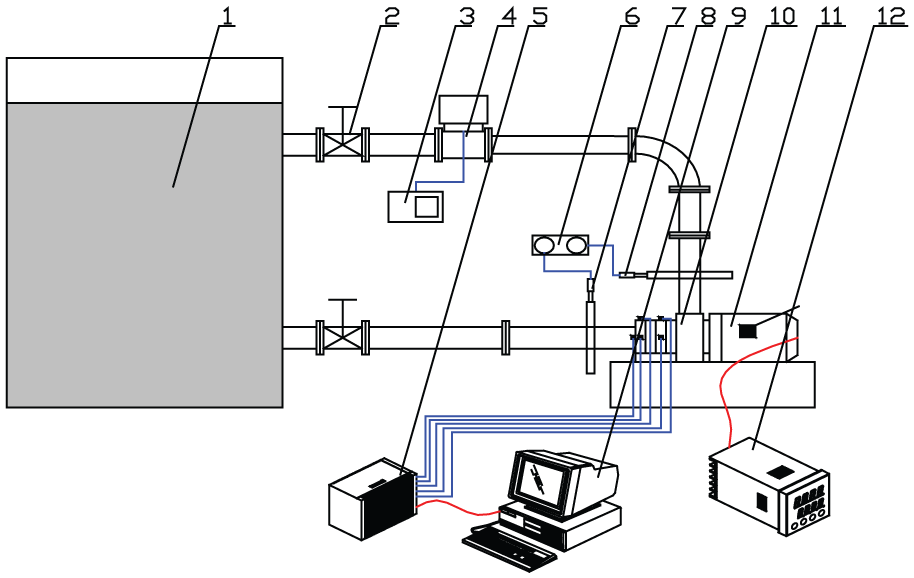
Schematic diagram of test rig. 1, tank; 2, valve; 3, indicator of flow meter; 4, electromagnetic flow meter; 5, signal collection instrument; 6, pressure indicator; 7, inlet pressure sensor; 8, outlet pressure sensor; 9, computer; 10, model pump; 11, motor; and 12, transmission.
Research scheme
The vibration of pump is generally measured by vibration speed according to the JB/T 8097-1999 of China because the main frequency of pump is in the range of medium frequency (f = 10–100 Hz). In this test, the vibration acceleration was measured by vibration acceleration sensors, and the vibration speed was obtained from the integral of vibration acceleration. Five integrated circuit piezoelectric vibration acceleration sensors were used to measure the flow-induced vibration signal. The frequency range of vibration acceleration sensor is 0.5 Hz–8 kHz, and its resolution ratio is 0.002 m/s2. The sampling time is 30 s. The vibration intensity was used to represent the vibration characteristics of pump according to the JB/T 8097-1999, and the vibration intensity can be written as

where v(t) represents vibration velocity at different time, T is sampling time, and vr.m.s is square root of vibration intensity.
In order to improve the experimental efficiency, the staggered angles between impellers were arranged by orthogonal method. 15 In the test, two staggered angles were considered, one is 0° with experimental serial number 1, and the other is 22.5° (θ/2) with experimental serial number 2. The experimental factors were named A, B, C, D, and E, for five-stage impellers, respectively. As shown in Table 2, the orthogonal table L8 (25) is used to arrange the tests, where 8 is the number of test, 5 is experimental factor, and 2 is the ratio of each factor. According to the design of orthogonal test method, the test scheme in the article is representative. In the test, the clocking position of impeller is guaranteed by groove at different angles on impeller and hub. The picture is shown in Figure 3. Figure 4 shows the staggered arrangement of impellers on the shaft in the experiment.
Test schemes.


The groove on impeller and hub.
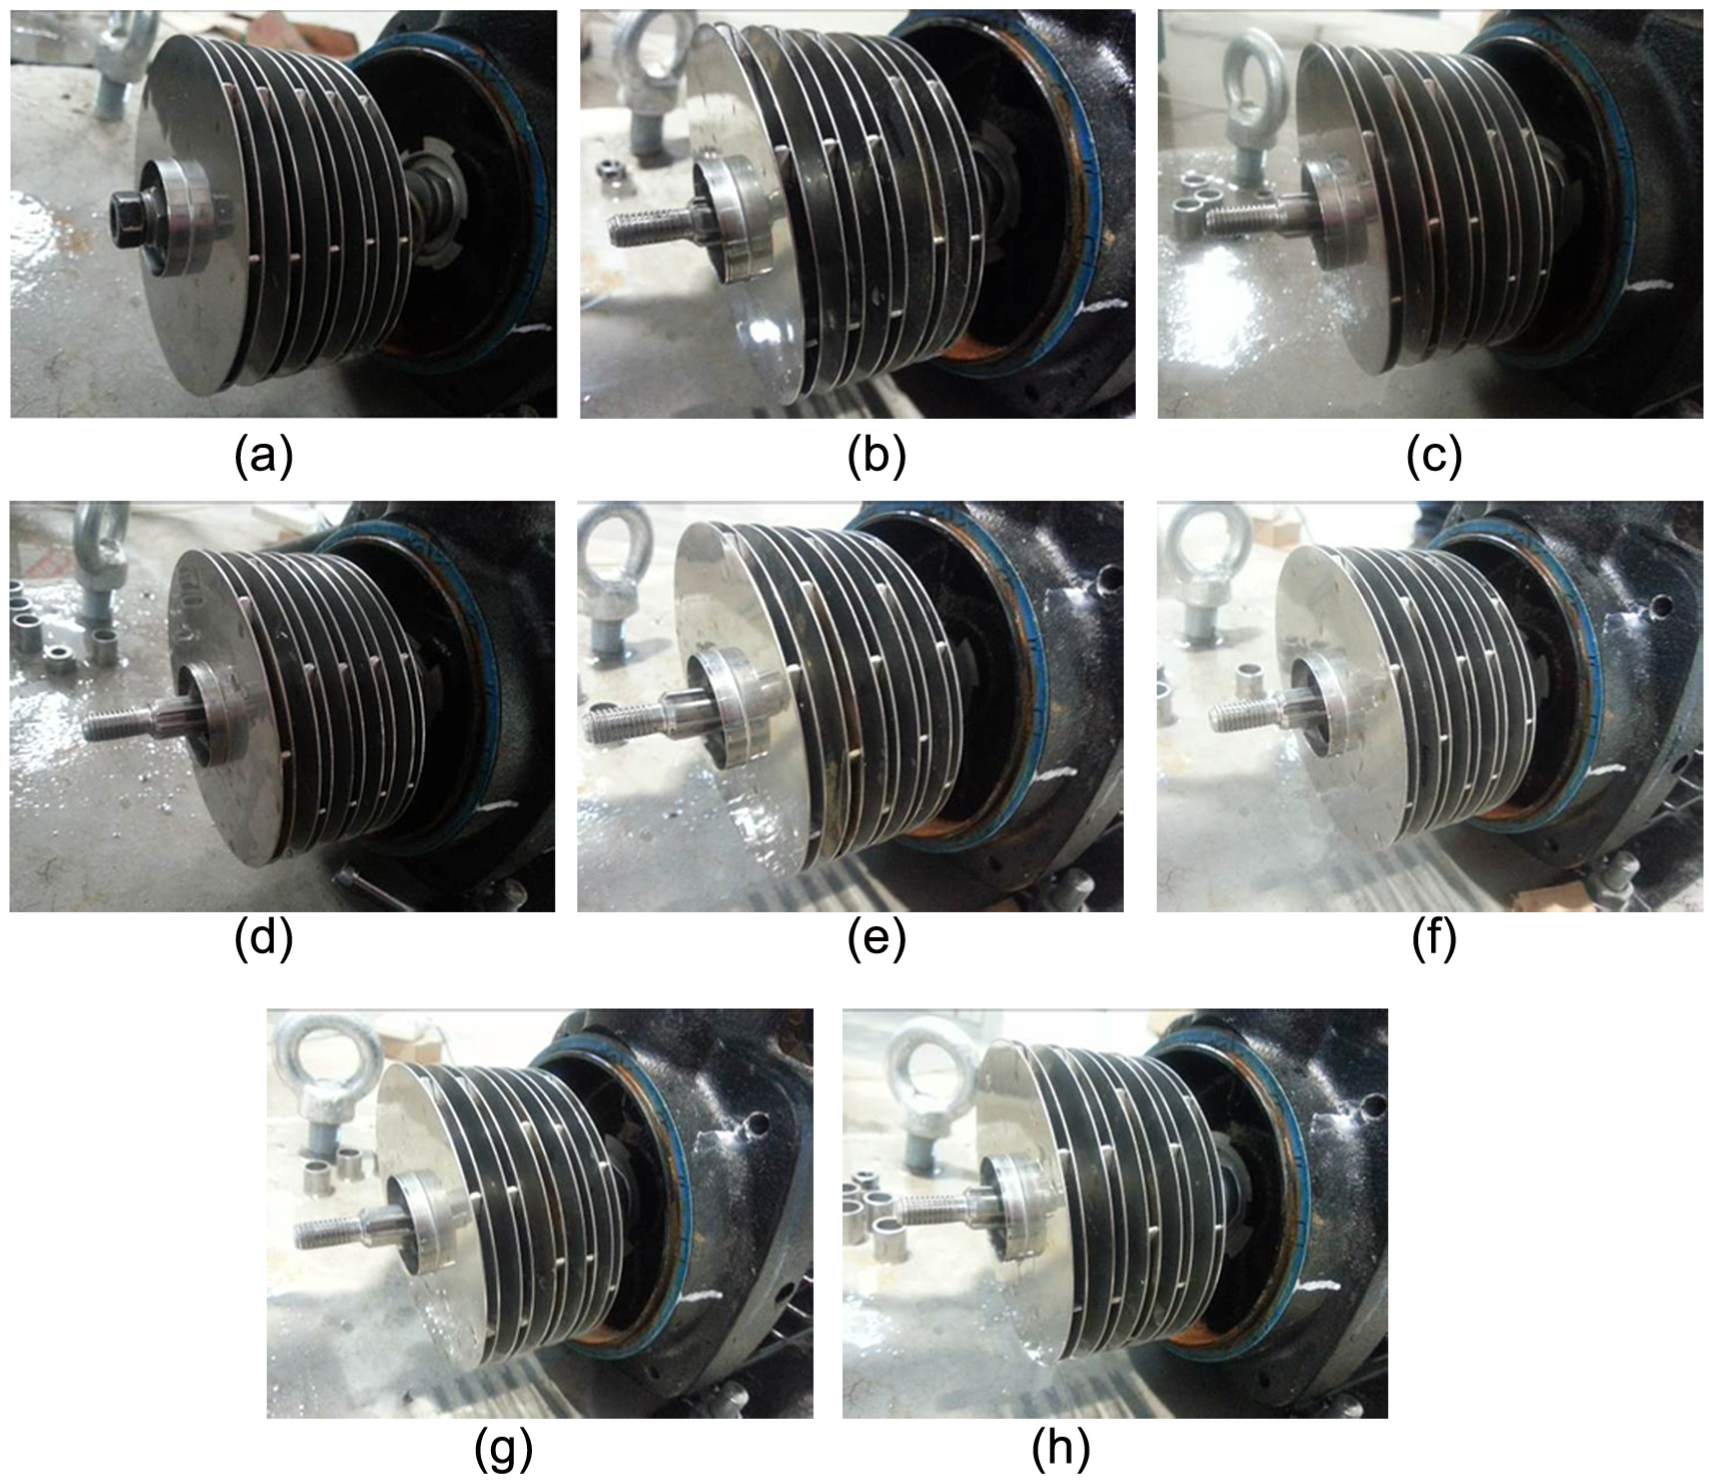
Staggered arrangement of impellers: (a) scheme 1, (b) scheme 2, (c) scheme 3, (d) scheme 4, (e) scheme 5, (f) scheme 6, (g) scheme 7, and (h) scheme 8.
Arrangement of measuring points
This article mainly focuses the flow-induced vibration; therefore, all the measuring points were set at the suction and discharge of the pump. Figure 5 shows the arrangement of the measuring points of acceleration sensors. Measuring point 1 is used to test the axial vibration of the pump; measuring point 2 and measuring point 3 are used to test the horizontal and vertical vibrations at the inlet, respectively; and measuring point 4 and measuring point 5 are used to test the horizontal and vertical vibrations at the outlet, respectively.

Measuring points of acceleration sensors.
Results and analysis
Energy characteristics
Figure 6 shows the pump head curves under different clocking positions. It can be seen that, at small flow rate, the head difference between all schemes is very small, and this difference gets more obvious with the increase in flow rate. Compared with the head of scheme 1 (the staggered angle between all impellers is 0°), at design flow rate, there are a maximum of 1.31% head increase under scheme 5 and a maximum of 0.53% head drop under scheme 8. Similarly, at small flow rate, there are a maximum of 1.03% head increase under scheme 5 and a maximum of 1.46% head drop under scheme 6. Also, at large flow rate, there are a maximum of 2.1% head increase under scheme 5 and a maximum of 1.18% head drop under scheme 8. It can be found that the head increase in scheme 5 is always the maximum, and the head drop of scheme 6 or 8 is the maximum.

Head curves under different clocking positions.
Figure 7 shows the pump efficiency curves under different clocking positions. It can be found that the efficiency difference between all the test schemes is small in the whole flow rate. Considering the efficiency of scheme 1 as the reference value, there are a maximum of 0.48% efficiency increase under scheme 2 and a maximum of 0.96% efficiency drop under scheme 6 at design flow rate. Similarly, at small flow rate, the maximum efficiency increase is 0.08% under scheme 3 and the maximum efficiency drop is 1.25% under scheme 7. Also, at large flow rate, there are a maximum of 0.7% efficiency increase under scheme 2 and a maximum of 1.5% efficiency drop under scheme 7.

Efficiency curves under different clocking positions.
According to the above analysis on head and efficiency of the model pump, it can be concluded that the effect of clocking position between impellers on multistage pump performance is not obvious in the whole flow rate. Therefore, it is not a good idea to optimize the multistage pump performance by clocking effect of impellers.
Vibration intensity
Figure 8 shows the vibration intensity curves of measuring point 1 under different clocking schemes, and the measuring point 1 is used to measure the axial vibration of model pump. From Figure 8, it can be found clearly that the axial vibration of scheme 2 is stronger than that of other schemes, especially at small flow rate. Also, the axial vibration of each scheme gets stronger at small and large flow rates.

Vibration intensity curves of measuring point 1.
In order to analyze the effect of rotor clocking effect on pump vibration quantitatively, the variance method was applied to analyze the vibration data in the whole flow rate. 16 Analysis of variance is applied to reflect the effect of each parameter on pump vibration. In this method, Fratio represents the test statistics, p is the test value, and Fcrit is the critical value with reference α. When α is 0.05, Fcrit is 4.225. According to the variance analysis theory, if p > 0.05, it means the difference between two schemes is small. The analysis results are identified in Table 3.
Vibration data variance analysis of measuring point 1.
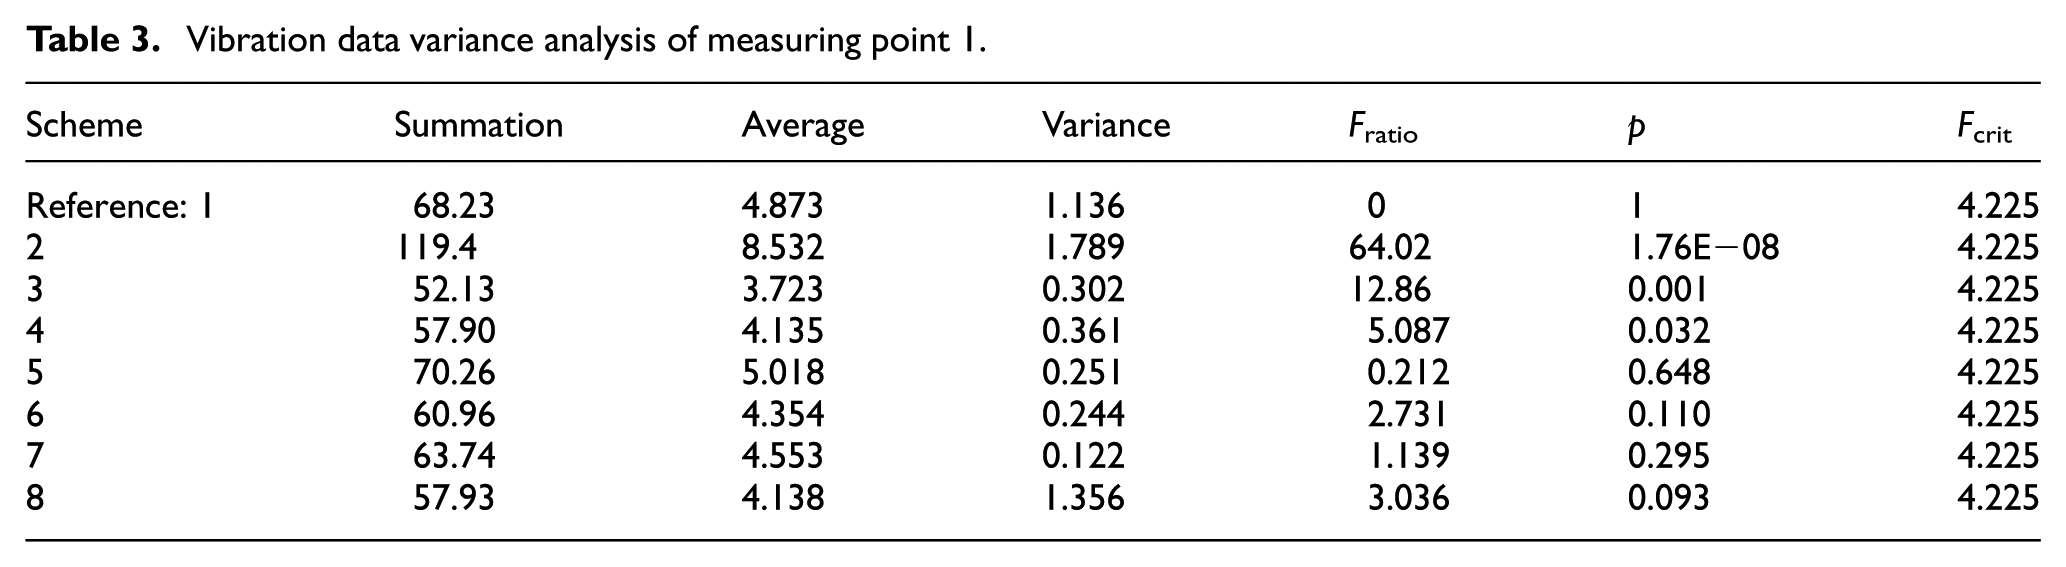
In Table 3, taking the p value of scheme 1 as a reference, the p value of schemes 5, 6, 7, and 8 is more than 0.05, and the average value of schemes 5, 6, 7, and 8 is close to that of scheme 1, which indicates that the difference of axial vibration between schemes 5, 6, 7, and 8 and 1 is not obvious. The p value of schemes 2, 3, and 4 is less than 0.05, so the difference of axial vibration between schemes 2, 3, and 4 and 1 is obvious. In addition, the average and variance of scheme 2 are larger than that of scheme 1, while the average of schemes 3 and 4 is less than that of scheme 1.
In conclusion, the clocking schemes 1, 5, 6, 7, and 8 have less effect on the axial vibration of this multistage centrifugal pump. To some extent, the clocking schemes 3 and 4 can reduce the axial vibration of the pump slightly. At last, the clocking scheme 2 can result in the increase in the axial vibration evidently.
Figure 9 presents the vibration intensity curves of measuring point 2 under different clocking schemes, and the measuring point 2 is used to test the horizontal vibration at the pump inlet. It can be seen that each clocking scheme has obvious effect on horizontal vibration at pump inlet, and the effect of scheme 3 near design flow rate is the most significant. Also, the vibration differences between schemes 5, 6, 7, and 8 and 1 are large.

Vibration intensity curves of measuring point 2.
The variance method is also applied to analyze the vibration data of measuring point 2 and all the results are shown in Table 4. In the same way, the data of scheme 1 are considered as the analysis base. According to the p value, the vibration difference between schemes 2, 3, and 4 (p > 0.05) and 1 is not obvious, while the vibration difference between schemes 5, 6, 7, and 8 (p < 0.05) and 1 is evident. The average of schemes 2 and 4 is close to that of scheme 1, and the average of scheme 3 is 1.2 times than that of scheme 1. The average of schemes 5 and 6 is 0.87 and 0.89 times than that of scheme 1, respectively, and the average of schemes 7 and 8 is 1.11 and 1.29 times than that of scheme 1, respectively.
Vibration data variance analysis of measuring point 2.

In conclusion, the clocking schemes 5 and 6 are helpful to reduce the horizontal vibration at pump inlet, and the clocking schemes 1, 2, and 4 have little effect on the horizontal vibration of pump inlet. The clocking schemes 3, 7, and 8 would increase the pump inlet horizontal vibration.
The vibration intensity curves of measuring point 3 are given in Figure 10, and the measuring point 3 is used to test the vertical vibration at pump inlet. It can be seen from Figure 10 that the vertical vibration is always large under each clocking scheme, which is same as the axial vibration of point 2. Besides, the vertical vibration of scheme 2 is stronger than that of other schemes obviously.

Vibration intensity curves of measuring point 3.
The variance analysis was also applied to estimate the vibration data of measuring point 3, and the results are identified in Table 5. The data of scheme 1 are also considered as the analysis base. From Table 5, it can be seen that the vibration difference between schemes 2, 5, 7, and 8 (p < 0.05) and 1 is obvious and the vibration average of the four schemes is 1.64, 0.86, 0.83, and 0.76 times than that of scheme 1, respectively. The difference between schemes 3, 4, and 6 (p > 0.05) and 1 is not evident and the vibration average of the three schemes is 0.95, 0.90, and 0.95 times than that of scheme 1, respectively.
Vibration data variance analysis of measuring point 3.

In conclusion, the clocking schemes 5, 7, and 8 can reduce the vertical vibration at the inlet of this multistage pump significantly, and the clocking scheme 7 is the best. The clocking schemes 1, 3, 4, and 6 just have little effect on the vertical vibration. The clocking scheme 2 obviously increases the vertical vibration of pump inlet.
The vibration intensity curves of measuring point 4 under different clocking schemes are presented in Figure 11, and the measuring point 4 is used to test the horizontal vibration at pump outlet. Totally, from Figure 10, it can be found that the horizontal vibration characteristics of pump outlet are very similar to that of measuring point 2, and the vibration of scheme 4 obviously gets bigger under large flow rate.
Vibration intensity curves of measuring point 4.
The results of variance analysis for vibration data of measuring point 4 under different clocking schemes are given in Table 6. Similarly, the data of scheme 1 are the analysis base. Based on the analysis of p value in Table 6, the vibration difference between schemes 2, 5, 6, and 8 (p < 0.05) and 1 is obvious and the vibration average of the four schemes is 0.85, 0.84, 0.86, and 1.16 times than that of scheme 1, respectively. The vibration difference between schemes 3, 4, and 7 (p > 0.05) and 1 is not evident and the vibration average of the three schemes is 0.96, 0.96, and 1.03 times than that of scheme 1, respectively.
Vibration data variance analysis of measuring point 4.

To sum up, the clocking schemes 2, 5, and 6 are beneficial to reduce the horizontal vibration of this pump outlet. The clocking schemes 3, 4, and 7 have little effect on the horizontal vibration, and the clocking scheme 8 plays a negative role on the horizontal vibration at pump outlet.
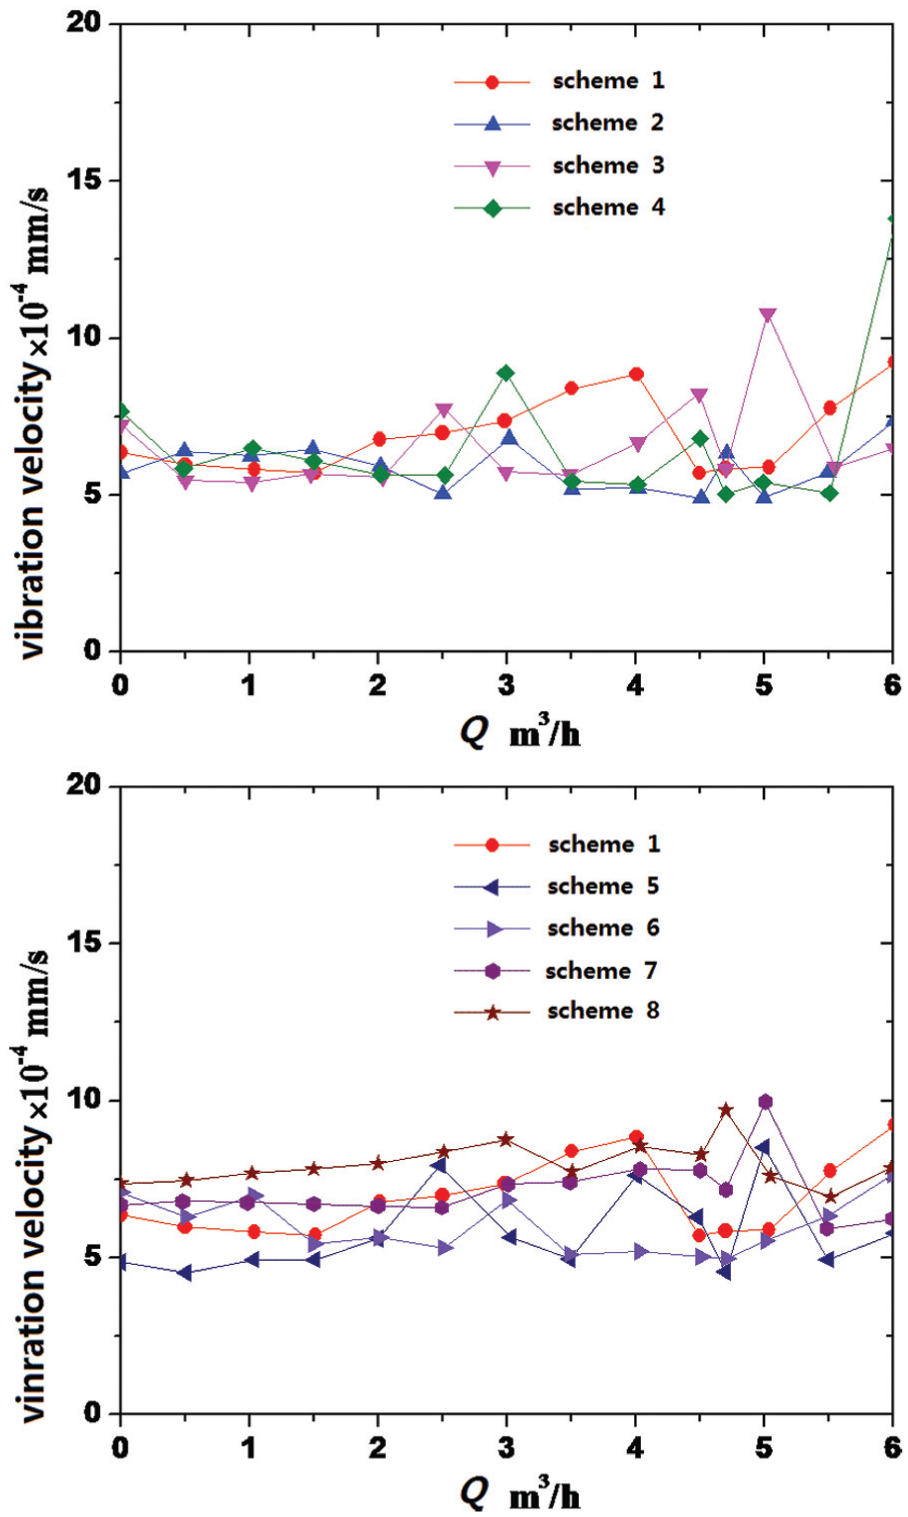
Figure 12 shows the vibration intensity curves of measuring point 5 under different clocking schemes, and the measuring point 5 is used to test the vertical vibration at pump outlet. From Figure 12, it can be found that the vertical vibration characteristics of pump outlet are similar to that of measuring point 3. Compared with Figure 10, the vertical vibration of pump outlet becomes larger obviously. In Figure 12, the vibration of scheme 2 is evidently stronger than that of other schemes.

Vibration intensity curves of measuring point 5.
The variance method was used to analyze the vibration data of measuring point 5 quantitatively too, and the results are presented in Table 7. As above, the data of scheme 1 are taken as the analysis base. Through the analysis of p value in Table 7, it could be found that the difference between schemes 2 and 8 (p < 0.05) and 1 is obvious and the vibration average of the two schemes is 1.37 and 0.77 times than that of scheme 1, respectively. The difference between schemes 3, 4, 5, 6, and 7 (p < 0.05) and 1 is not evident and the vibration average of the five schemes is 0.80, 0.91, 1.03, 0.90, and 0.93 times than that of scheme 1, respectively.
Vibration data variance analysis of measuring point 5.
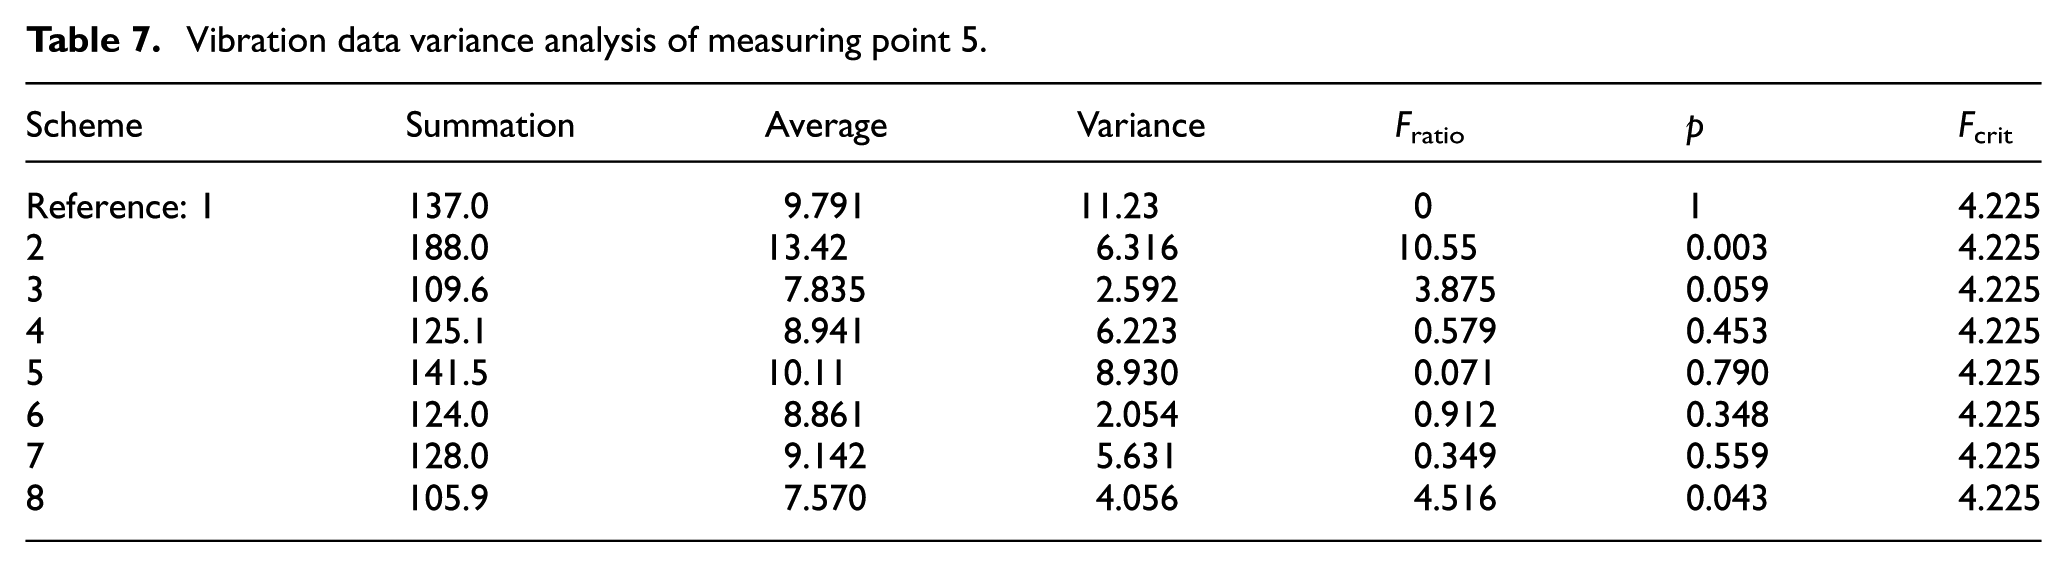
In total, the clocking scheme 8 is able to decrease the vertical vibration of pump outlet. The clocking schemes 1, 3, 4, 5, 6, and 7 have little effect on the vertical vibration of pump outlet, and the clocking scheme 2 obviously increases the vertical vibration at pump outlet.
Through the above analysis on vibration intensity, it can be concluded that the vibration of the pump gets bigger at off-design flow rate under all the clocking schemes. The maximum vibration is usually at the vertical direction of pump inlet. If the clocking angles of the two adjacent impellers in the multistage pump are the same, such as clocking schemes 1, 2, 3, and 4, the vibration will become big. The clocking scheme 7 is the best. Compared with scheme 1, the vibration of the multistage pump under scheme 7 can decrease by 23.1% and the average vibration intensity can decrease by 17.3%.
Conclusion
The effects of clocking effect on the energy and vibration characteristics of a multistage centrifugal pump were tested. The experiment scheme was arranged by orthogonal test method, and the vibration acceleration at five different places in a multistage centrifugal pump was measured. The main conclusions of the experiment are described below:
The staggered arrangement of impellers in a multistage pump has little effect on pump head and efficiency. Compared with the performance of clocking scheme 1 (the stagger angle between impellers is 0°), the fluctuation of head and efficiency of other clocking schemes is less than 1.5% and 1.3%, respectively, in the whole flow rate.
The clocking position of impellers has a significant effect on the vibration characteristics of model pump and the maximum vibration locates in the vertical direction of pump inlet. Compared with the vibration of clocking scheme 1, the maximum vibration intensity of the best clocking scheme can decrease by 23.1% and the mean vibration intensity can decrease by 17.3%.
To reduce the vibration of a multistage pump, it is better to make the clocking angle of the two adjacent impellers different.
Footnotes
Academic Editor: Ling Zheng
Declaration of conflicting interests
The author(s) declared no potential conflicts of interest with respect to the research, authorship, and/or publication of this article.
Funding
The author(s) disclosed receipt of the following financial support for the research, authorship, and/or publication of this article: The authors gratefully acknowledge the support from the National Natural Science Foundation of China (No. 51509109), the Foundation of Jiangsu Province (Grant Nos BY2014123-07, BY2014123-09, and ZBZZ-040), and a project funded by the Priority Academic Program Development of Jiangsu Higher Education Institutions (PAPD).