
Abstract
Numerical calculations and experimental measurements were carried out in a closed hydraulic test rig to investigate the vibration characteristics and instabilities induced by the development of cavitation in a centrifugal pump. The internal flow characteristics in the impeller and vibration signals at four different positions of the pump system were analyzed during the cavitation process. The results revealed that the occurrence and development of cavitation could be effectively detected by the sudden increase in the intensity of vibration at the testing points. Corresponding relationships were formulated between the occurrence and the development of cavitation and the intensification of the vibration at the measuring locations. It was found out that the virtual incipient for cavitation was much smaller than the traditional “critical” point.
Introduction
Cavitation and its related effects are complicated phenomenon and exist in most hydraulic machineries which include pumps, turbines, turbo-pump inducers, hydrofoils, and propellers.1–5 Primary problems produced by cavitation in pumps include inducing the flow instabilities, reducing the longevity of centrifugal pumps, being responsible for the vibration and noise generation, for the loss of efficiency in pumps, and for the erosive damage on surface of flow channels.6–12 Therefore, it is significant to know the inception and development of cavitation in a pump in a bid to prevent the pump operate at the cavitation condition. For this purpose, various kinds of methods are selected to research the development of cavitation. The most commonly used method to identify the presence of cavitation in pumps is based on observations of the drop in head. In fact, it is found that cavitation occurs before the traditional “critical” point which is the 3% drop in head from the non-cavitation condition at a constant flow rate in pump model testing. 2 In addition, other methods including acoustic emission (AE) techniques, 13 visualization of the flow inside the impeller, 14 pressure fluctuations,15–19 noise analysis, and vibration signals20–23 have also been used to identify cavitation in pumps. The best efficiency point (BEP) and the occurrence of cavitation in a centrifugal pump have been detected using the AE technique in Alfayez and Mba 24 and Neill et al.’s 20 research. Zhang et al. 25 combine the high-speed imaging system and numerical method to discuss the relationship between the tip leakage vortex cavitation and the reversed flow in an axial flow pump. The high-speed imaging method has also been conducted by Tan et al. 26 to elucidate the specific mechanism involved with cavitation breakdown within an axial waterjet pump. Lu et al. 17 and Li et al. 15 find that the degree of pump cavitation can be monitored effectively through pump inlet and outlet pressure pulsations. Noise signals are also proven to be an effective method to detect the generation and development of cavitation in pumps.7–9
Meanwhile, vibration characteristics are successfully adopted for fault diagnoses in pumps, which include the cavitation detection. Rus et al. 27 have experimentally investigated the relationship between noise, vibration, AE, and cavitation structures in a Kaplan Turbine. Černetič 8 and Čudina and Prezelj14,28 measure the structural vibration signals in audible spectra of kinetic pumps to research the cavitation process and discrete frequency is found. The vibrations and AEs have been combined by Escaler et al. 29 to experimentally investigate the draft tube swirling flows and cavitation over the full range of operation in a full-scale Francis turbine. The correlation between the transient cavitating flow structures and the vibration characteristics is analyzed for a modified NACA66 hydrofoil in Wang et al.’s 30 research. The intensity of vibration signals frequently fluctuates with cavitation number decreasing in a centrifugal pump with slope volute is found in Zhang et al.’s 31 work, and an increase in high-frequency signals is observed with cavitation generating.
In conclusion, vibration is one of the effective methods for the cavitation investigation in hydraulic machineries. Many of the researchers paid high attention to the high-frequency range of vibration to detect cavitation, yet few of them emphasize on the cavitation vibration from centrifugal pumps in low-frequency range. In the current research, the numerical simulation and experimental measurement are combined to investigate the vibration characteristics and flow instabilities induced by the generating and development of cavitation in a centrifugal pump. The internal flow instabilities in the impeller and vibration signals at four different positions of the pump system are analyzed during the cavitation process. The results reveal the relationship between the occurrence and development of cavitation and the intensification of the vibration. It is found that 0.59% drop in head is regarded as the incipient point of cavitation which is much smaller than the traditional “critical” point. The better position for the measurement of vibration induced by cavitation should be as close as possible to the impeller and the location where cavitation generated and collapsed.
Numerical simulation method
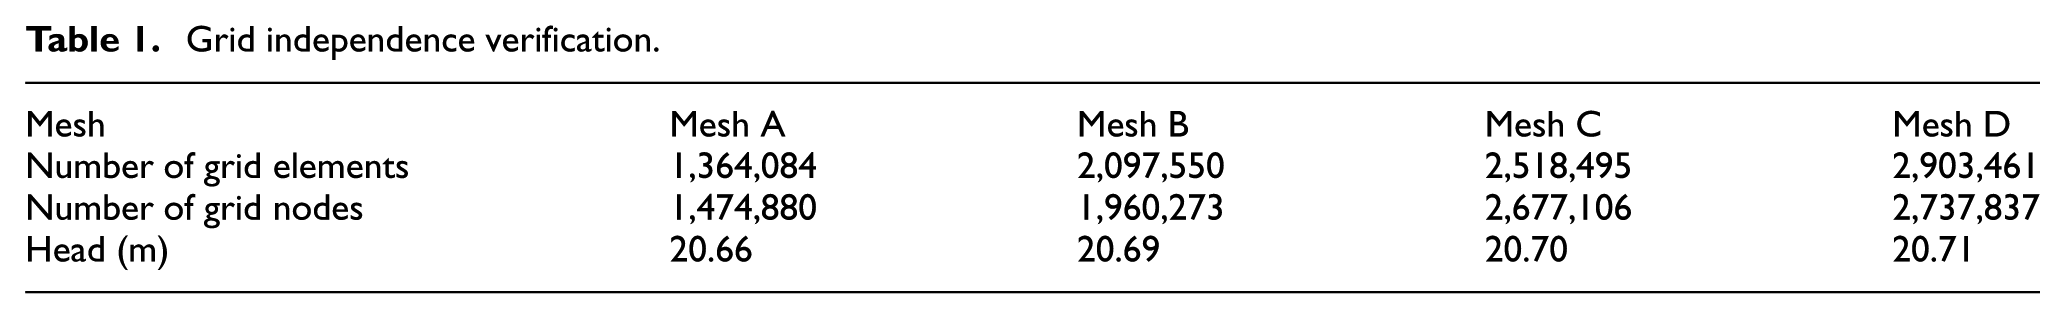
The research model in this article is a centrifugal pump which consists of a single suction and a shrouded impeller with six blades. The three-dimensional model of the pump is illustrated in Figure 1. The pump is designed to operate at 2910 r/min with the flow rate Qd = 50.6 m3/h and the head Hd = 20.2 m at the designed point. The specific speed of the pump is ns = 132.2 at the designed point (ns = 3.65nQ0.5/H0.75). The other main geometric parameters of the pump and more detailed information can be obtained in the previous research.17,32 The commercial code ANSYS CFX 14.5 is adopted to conduct the numerical calculations. The full flow fields are divided into different fluid domains and each of them are meshed by structured hexahedron mesh via the ICEM CFD. One of the advantages of the structured mesh is that the boundary layer can be adjusted flexibly by controlling the density of each node. 33 The meshes near the wall are densely generated to ensure the accuracy of numerical simulation. The structured grids in computational regions are seen in Figure 2. The grid independence test and verification are shown in Table 1. Due to both efficiency and sufficient accuracy of calculation are taken into consideration, mesh C is chosen to conduct the simulation. Computational domains for mesh C include the following parts: pump inlet section, ring, volute, chamber, impeller, and pump outlet section. In order to make the numerical simulation more close to a real situation, the import and export of the pipes are appropriately extended. The k − ε turbulence model is selected as the turbulence model for the steady calculation. More details about the initial boundary and basic settings are obtained in previous research.17,32

Model of entire pump passage. 17

Mesh of the centrifugal pump: (a) surface mesh of impeller and (b) surface mesh of main components.
Grid independence verification.
Experimental setup
The predicted results are validated by the experimental measurements of pump performance and the cavitation characteristic curve. The schematic of the test rig which is a closed hydraulic test rig is shown in Figure 3. The measurements of the impeller rotating speed, the flow rate, the pump inlet, and outlet mean static pressure can be obtained from the previous research. 17 Two pressure transmitters with their ranges from 0 to 4 bar installed at the outlet of the pump and −1 to 0.6 bar installed at the inlet of the pump are used to measure the mean static pressure of the pump. Four acceleration transducers are installed at different positions of volute and pump platform in different directions, respectively, to obtain the vibration signals during the development of cavitation. Accelerometer 1 is fixed on the surface of volute near the impeller outlet, which is along the axial direction and defined as in X-direction. Accelerometer 2 is mounted on the surface of volute along the radial direction of impeller which is defined as in Y-direction. Accelerometer 3 is installed on the surface of volute along the direction of pump export which is upright upward the ground and defined as in Z-direction. Accelerometer 4 is fixed on the pump platform along the direction which is upright upward the ground. The stereogram of the test rig and the positions of the sensors are illustrated in Figure 4. The X-, Y-, and Z-direction are perpendicular to each other and can meet the right-hand coordinate law. Accelerometers 2, 3, and 4 are in the same plane which is the center plane of the pump. The accelerometers are piezoelectric vibration acceleration sensors with the range from 5 Hz to 70 kHz and the type of the accelerometers is MA352A60. The characteristics of the accelerometers include a wide range of frequency domain, small volume, light weight, and can be disassembled and assembled easily and will not cause disturbance to the flow in the pump, and so on. 34 The inlet pressure is controlled by the vacuum pump and flow rate is adjusted by the flow control valve. A PXI-4772B data acquisition module is used to collect the electric signals and then convert them to digital signals. During signal sampling process, the flow rate is kept at the designed flow rate, and the sampling frequency is set as 20,000 Hz.
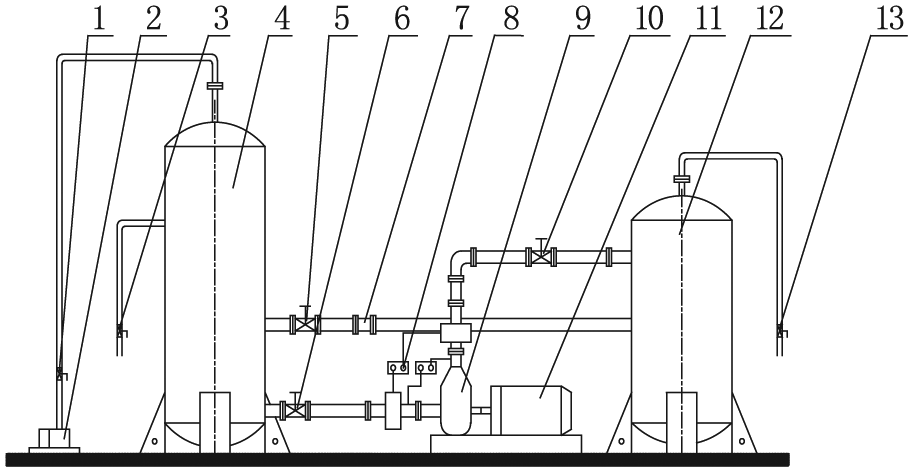
Schematic diagram of the experimental test rig. 17

Positions of accelerometers’ installation.
Results and discussions
Analysis of numerical results
Through the performance of the pump which was presented in previous article, 17 reasonable agreements between the experimental and numerical results under different flow rate conditions was found. The suction performance at Qd is also compared between the numerical results and experimental measurement, seen in Figure 5. In this article, the numerical NPSHr is 1.46 m and the experimental NPSHr is 1.63 m. It can be seen that there is a reasonable agreement between the experimental tests and the predicted results. According to the previous and the following investigations in the article, the pentagrams in the curves are regarded as the points of cavitation inception where NPSHa is 7.95 m in the centrifugal pump. The results present that the numerical method is able to predict overall performances including cavitation curve.
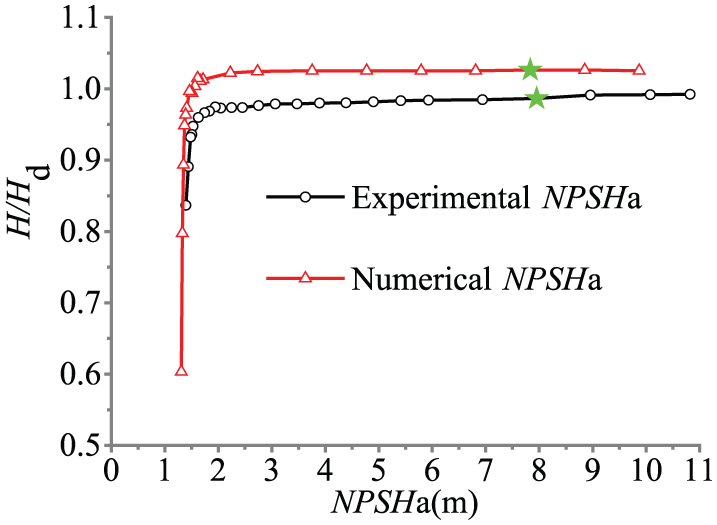
Cavitation performance at Qd. 17
The distributions of water vapor bubbles and velocity streamlines at Qd in an axial plane at b/b2 = 0.1 in the impeller are compared between different cavitation conditions, as shown in Figure 6, where b is the axial span between the axial plane and the point that is the interaction of shroud and outlet of blade and b2 represents the outlet width of blade. As depicted in Figure 6, no vapor bubbles and no flow instabilities are found in the non-cavitation condition when NPSHa = 9.87 m. As the NPSHa decreases to 7.95 m, vapor bubbles are found on the suction surface of the blades leading edge, which are in fact next to the volute tongue. However, cavitation bubbles attach in the leading edge of each blade is observed with the NPSHa decreasing. As cavitation fully developed, the vapor bubbles approximately occupy the whole impeller. It is clear that corresponding relationship between the distribution of cavity and the position of vortex in the blade channels is found. As the cavitation progressed, obvious vortexes and flow instabilities can be found in the cavity trailing edge of each blade channel. The reasons for that phenomenon are that the vapors’ bubbles attach in the leading edge and present a relative stable state characteristic when the cavitation is generating. Hence, the flow instabilities in the impeller are mainly induced by rotor–stator interaction between the rotating impeller blades and the steady volute tongue. However, the flow instabilities intensify and dramatically become complicated in the cavity trailing edges when NPSHa decreased to 1.31 m, corresponding to the 41.2% drop in predicted head. It is considered that the collapse of vapor bubbles and the shedding of cavitation mainly produce the occurrence and intensification of flow instabilities while cavitation fully develops.

Vapor bubbles’ distribution in impeller and velocity streamlines’ distribution in axial plane at b/b2 = 0.1, Qd.
Relationship between the vibration and the suction performance
As the NPSHa decreased from 10.82 to 1.44 m, different cavitation conditions from non-cavitation to severe cavitation are observed. Good corresponding relationship between the root mean squares (RMS) of vibration in different positions and the suction performance curve of the pump is found, as shown in Figure 7. It is clear that similar developmental trends of the vibrations measured in different positions are found with the development of cavitation. The RMS of the vibrations in different directions is kept almost the same with the NPSHa decrease from 10.82 to 8.96 m. Then, the RMS values start to increase and the head of the pump decreases as the NPSHa decreases to 7.95 m. It is considered that the cavitation is generated when the NPSHa declines from 8.96 to 7.95 m, corresponding to 0.1%–0.59% drop in head at the designed flowed rate. The head drops by 0.59% from non-cavitation condition when the NPSHa = 7.95 m. These results show that the incipient point of cavitation in this current research is larger than that of the previous research which was detected by the pump inlet and outlet pressure pulsations. The RMS signals rise up to several times greater than that in non-cavitation condition as the NPSHa decreases from 7.95 to 5.93 m. Especially, the RMS values in X-direction become about eight times greater when the NPSHa reduces to 5.93 m than that under the non-cavitation condition. Then, the RMS of the different vibrating signals is kept relatively steady when the NPSHa declines from 5.93 to 3.07 m. A possible explanation for the phenomenon is that most of the vapor bubbles attached to the leading edge, which created a relatively steady state. However, vibration signals were produced by the shock waves and high-speed jets, which were induced by the collapse and shedding of cavitation bubbles near the solid wall. As a further development of cavitation, the RMS signals rise up again when the NPSHa decreases to 2.75 m. The intensity of the vibration becomes dramatically severe as the NPSHa decreases to 1.74 m, meanwhile corresponding to the sharp drop in head. It is obvious that the intensifications of the vibration signals in different positions are resulted from the generation and development of cavitation. Because the accelerometer 1 is closer than other accelerometers to the region of cavitation bubbles and the running impeller and shaft, the vibration signals measured by accelerometer 1 is greater than that of the other three accelerometers. Therefore, only one accelerometer can detect the incipience and development of cavitation in a centrifugal pump, and the better positions for vibration measurement should be as close as possible to the point where the cavitation bubbles generate and collapse, as well as the running impeller and shaft.
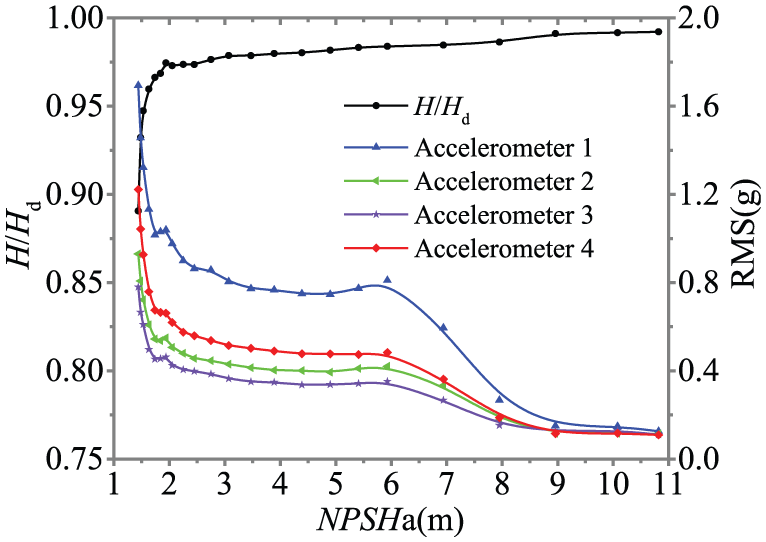
Root mean square of vibration and the suction performance curve.
Vibration in X-direction
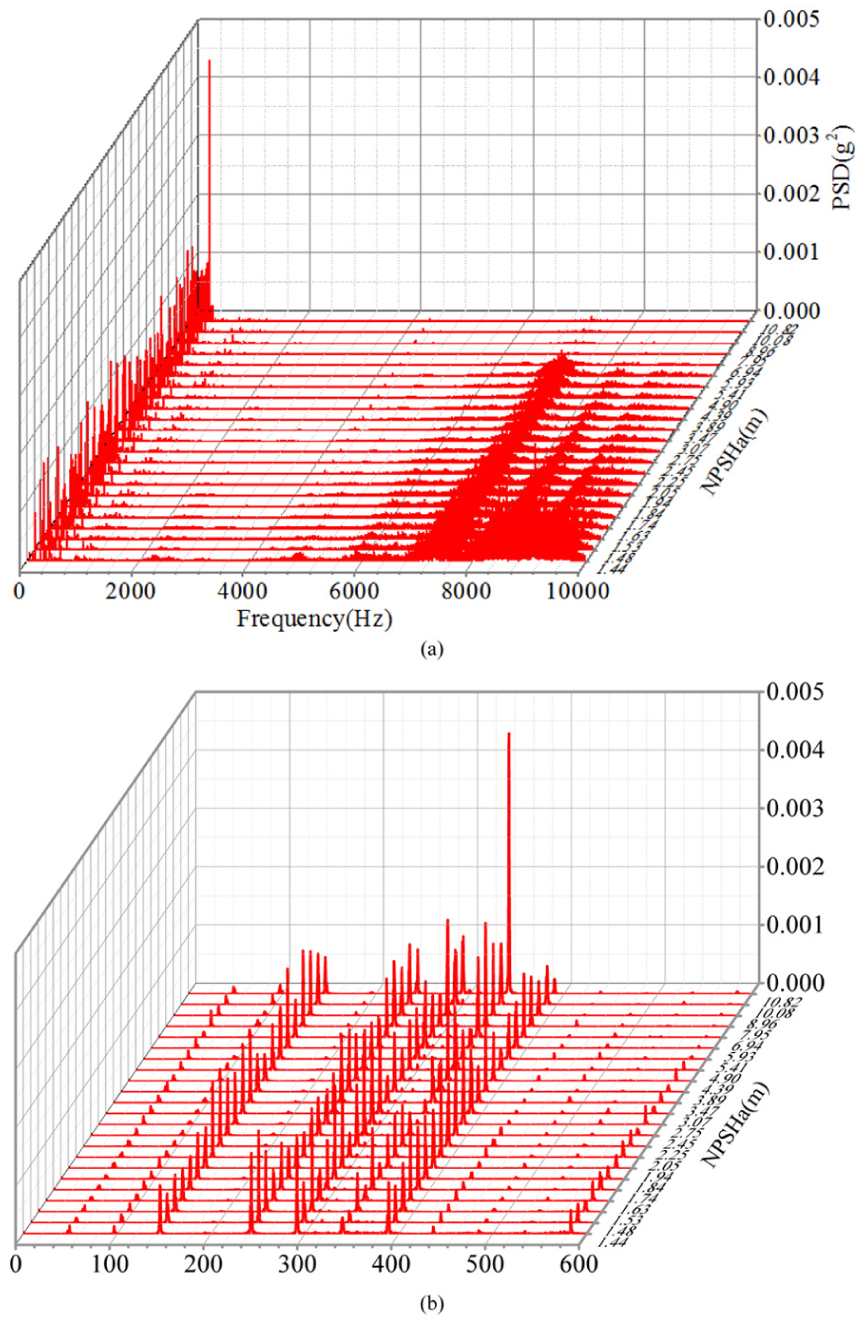
The power spectral density (PSD) of vibrating signals in X-direction at Qd with the decreasing NPSHa is shown in Figure 8. The dominant frequency of the vibration signals in X-direction was five times greater than that of the shaft frequency. Peaks were found at both three and four times of the shaft frequency with the amplitude fluctuating as the cavitation progressed. When the NPSHa decreased from 7.95 to 1.44 m, obvious broadband pulses of vibration signals were seen in the range between 2k and 10 kHz. Especially, the fluctuation intensity and amplitudes of PSD of vibration were distributed between 6k and 9 kHz and were much stronger than that of the other frequency bands. A possible explanation for the phenomenon is that due to the instabilities induced by the back flow in the region of the cavity trailing edge, the length of the cavities changed radically and produced a strong oscillational force. Simultaneously, as the NPSHa decreased, the increasing number and volume of cavitation bubbles accompanied the shedding of cavitation bubbles near the cavity trailing edge. Then, the huge pressure of shock waves and high-speed jets had an impact on the solid wall of the blade and impeller, causing both cavity erosion on the surface of channels and the vibration of volute. The occurrence and oscillations of the broadband frequency of vibration were not only caused by the impaction between the pump inside solid wall and the shock waves and micro-jets produced by the collapse of vapor bubbles but also induced by the interaction between the solid structures and the flow instabilities. However, a large number of cavitation bubbles were not generated and collapsed at the same time, which led to a wide range of broadband vibration with the development of cavitation. Obvious variations of the vibrating signals when NPSHa = 7.95 m were found with the development of cavitation, and the NPSHa = 7.95 m can be regarded as the symbolic point of cavitation occurrence in the centrifugal pump.

Waterfall plot of vibrating signals in X-direction of the volute at Qd with the frequency range from (a) 0 to 10 kHz and (b) 0 to 600 Hz.
A detailed observation of PSD signals at several key points during the cavitation process is compared in Figure 9. Broadband pulse of vibration signals generated between 6k and 10 kHz when NPSHa decreased to 7.95 m is observed in Figure 9. The amplitude of the PSD gradually increased, and the fluctuations of the signals intensified with the development of cavitation. Broadband fluctuations distributed between 2k and 6 kHz when NPSHa decreased to 4.90 m were found. As the cavitation fully developed where the NPSHa = 1.44 m, obvious broadband distributed between 2k and 10 kHz also occurred. The occurrence and intensification of the PSD signals happened as the attached cavitation bubbles shed from the blade leading edges and propagated to the outlet of the blade channels, which occupied almost the whole impeller. Then, the attached cavitation presented high instabilities in the region of cavity trailing edges with further decreasing in NPSHa. Meanwhile, the shock waves and pressure, produced by the collapse of vapor bubbles, intensified and became powerful. Due to the occurrence and fluctuation of the broadband in the range from 2k to 10 kHz with the occurrence and development of cavitation, the frequency of vibration in X-direction distributed between 2k and 10 kHz, which is the typical frequency of cavitation in the centrifugal pump.
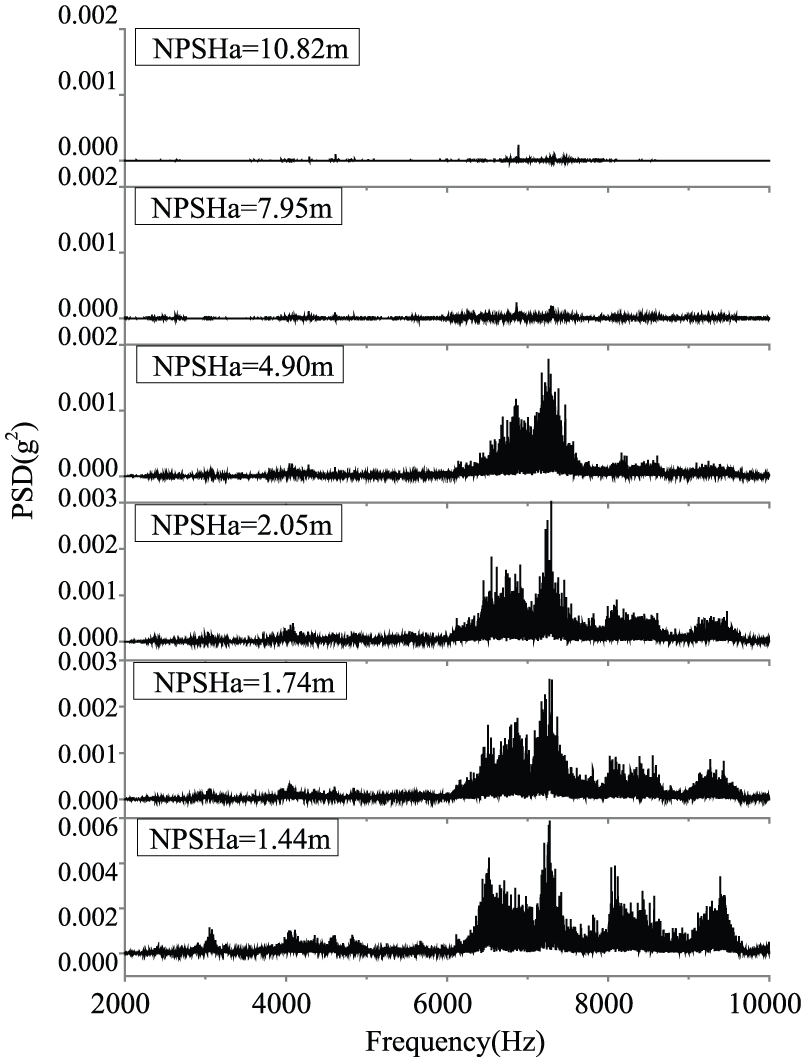
Power spectral density (PSD) of vibrating signals in X-direction of the volute at Qd.
Vibration in Y-direction
The PSD signals of the vibration in Y-direction with the NPSHa decreasing from 10.82 to 1.44 m at Qd are shown in Figure 10. It was found that the dominant frequency was 2f0 during the development of cavitation, where f0 represented the shaft frequency. The fluctuation intensity of the dominant frequency in Y-direction was similar to that in X-direction. A detailed observation of PSD between 0 and 600 Hz was also demonstrated to detect the presence of other peaks at 3f0, 4f0, 5f0, and 8f0 during the whole process of cavitation. While the NPSHa decreased from 7.95 to 1.44 m, obvious broadband fluctuations between the frequency ranges from 4k to 10 kHz were found. Especially, stronger intensities of the broadband signals distributed between 6k and 10 kHz were observed. However, the broadband fluctuations of vibrational PSD signals in Y-direction were weaker than that in X-direction at the same operating condition. The explanation for this phenomenon was that the position of accelerometer 2 (in Y-direction) was further from the generation, shedding and collapse of cavitation, and the rotating impeller and shaft than that of accelerometer 1 (in X-direction), then the shock wave and pressure radiated by the collapse of cavitation became weaker and weaker during a far distance propagation.

Waterfall plot of vibrating signals in Y-direction of the volute at Qd with the frequency range from (a) 0 to 10 kHz and (b) 0 to 600 Hz.
The broadband fluctuations of vibration signals in Y-direction from 4k to 10 kHz occurred as NPSHa decreased to 7.95 m, as shown in Figure 11. The broadband pulsations of vibration signals became intensified and its amplitude gradually increased during the cavitation process. As the cavitation fully developed (NPSHa = 1.44 m), the amplitude of the broadband pulsations increased to about 30 times larger than that in non-cavitation condition. According to the variation of PSD signals of vibration in Y-direction, NPSHa = 7.95 m was also regarded as the occurrence of cavitation. The frequency ranges collected from 4k to 10 kHz were considered as the typical spectrum of vibration signals in Y-direction under the cavitation conditions in the centrifugal pump.

Power spectral density (PSD) of vibrating signals in Y-direction of the volute at Qd.
Vibration in Z-direction
Figure 12 shows the variation of vibrating PSD signals in Z-direction as the cavitation progressed. It was clear that peaks at f0 and its harmonics 3f0, 4f0, 5f0, 6f0, 7f0, and 8f0 were found under both non-cavitation and cavitation conditions. The reason for the phenomenon was that the peaks at the shaft frequency and its harmonics were induced by the rotor–stator interaction between the volute tongue and the blades because the testing point in Z-direction was closer to the volute tongue than the other three measuring points. Relative weak broadband pulsations of vibration in Z-direction generated between 2k and 6 kHz as NPSHa decreased to 7.95 m. At the same time, obvious broadband fluctuations with its intensity being similar to that in Y-direction were observed between 6k and 10 kHz. But the intensity of both vibrating signals in Y- and Z-direction was weaker than that in X-direction. It was clear that apparent broadband fluctuations of vibration in Z-direction were stronger at around 7.2 kHz than the rest of the frequency bands. Compared with the vibrating fluctuation in Y-direction, the intensity of the vibrating signals in Z-direction was relatively weak in the same condition. The main reasons for the phenomenon included the following: the Y-direction was in the radial direction of the impeller, so the testing point of Y-direction was easily affected by the water in the volute. However, due to the volute structure, the wall of point 3 (in Z-direction) was thicker than that of testing point 2 (in Y-direction), and the point 3 was further to the running impeller and shaft than that of point 2, so the vibrating signals suffered from attenuation during propagation.
Waterfall plot of vibrating signals in Z-direction of the volute at Qd with the frequency range from (a) 0 to 10 kHz and (b) 0 to 600 Hz.
Several different cavitation conditions were chosen to analyze in more detail as seen in Figure 13. It was found that the broadband fluctuations of vibration in Z-direction gradually intensified with the development of cavitation. The amplitude of the vibrating PSD signals increased from 0.0002 to 0.002 g2 which meant that it increased approximately 10 times from non-cavitation condition to severe cavitation condition, corresponding to the NPSHa which decreased from 10.82 to 1.44 m. According to the analysis of vibration in Z-direction, it was found that NPSHa = 7.95 m was regarded as the cavitation incipient point. Meanwhile, the frequency range from 6k to 10 kHz was the typical frequency of vibration in Z-direction induced by cavitation in the centrifugal pump.

Power spectral density (PSD) of vibrating signals in Z-direction of the volute at Qd.
Vibration on the pump platform
With the NPSHa decreased from 10.82 to 1.44 m, the PSD signals on the platform are shown in Figure 14. The amplitudes of vibrating fluctuations on the platform at f0 and its octaves distributed between 0 and 600 Hz were much lower than that of the other three testing points on the volute. The main reason for the phenomenon was that due to the positions of accelerometers 1, 2, and 3 which are correspond to the X-, Y-, and Z-direction are closer to the impeller than that of accelerometer 4 which is on the base, the accelerometers 1, 2, and 3 are more likely to be affected by the rotor–stator interaction than the testing point on the platform. The testing point on the base suffered from attenuation during the propagation of a series of flow instabilities induced by cavitation and other types of unsteady flow. Similarly, obvious broadband fluctuation in the frequency range between 6k and 10 kHz occurred as NPSHa decreased to 7.95 m. The amplitudes and intensity of the broadband fluctuations on the base were much lower than that in X-direction, but which were stronger than that in Y- and Z-direction under the same NPSHa condition. The expiation for this phenomenon was that the shaft and the impeller were more susceptible to vibrate which was induced by cavitation and unsteady flow in the pump. Then, the signals obtained on the platform were transferred by the vibration of shaft. Meanwhile, the vibration signals measured on the pump platform not only included the vibration, which were induced by cavitation, flow instabilities, and the running of the impeller, but also incorporated with the vibration produced by the electromotor. According to the above analysis, cavitation played a significant role to the vibration in all the four testing points.

Waterfall plot of vibrating signals on the base at Qd with the frequency range from (a) 0 to 10 kHz and (b) 0 to 600 Hz.
As depicted in Figure 15, several different values of NPSHa points were selected to analyze the vibrating PSD signals on the platform in more detail. Broadband pulsations were found between 6.5 and 8 kHz under the non-cavitation condition. Obvious broadband fluctuations of vibrating PSD signals on the platform occurred, which distributed from around 6k to 10 kHz while NPSHa decreased to 7.95 m. As cavitation progressed, the amplitude of the PSD signals on the base gradually increased with the frequency range increasing from 6k to 10 kHz, which became 30 times larger than that under the non-cavitation condition as cavitation fully developed (NPSHa = 1.44 m). Therefore, the frequency range distributed between 6k and 10 kHz was considered as the typical frequency band of vibration induced by cavitation on the platform in this centrifugal pump. The fluctuation and amplitude of vibrating PSD on the base were more intensive and higher than that in Y- and Z-direction under the same cavitation condition.

Power spectral density (PSD) of vibrating signals on the base at Qd.
Therefore, the better position for the measurement of vibration induced by cavitation should be as close as possible to the runner and the location where cavitation generated and collapsed. Compared with the vibration radiated by the impeller and electric motor, the vibration induced by cavitation was more apparent and dominant as cavitation developed.
Conclusion
The vibration and instabilities induced by cavitation in a centrifugal pump have been investigated by experimental and numerical methods during the generation and development of cavitation. The numerical results were validated by means of measurements of pump performance and the cavitation performance curve. The results revealed that the formation, collapse and shedding of cavitation, and the rotor–stator interaction were responsible for the occurrence and intensification of flow instabilities. Obvious corresponding relationship between the development of cavitation and the intensification of the vibration was found during the decrease in NPSHa. Vibrating signals were regarded as the characteristic signals to detect the inception and development of cavitation in centrifugal pumps. The frequency ranges from 6k to 10 kHz collected in the experiment are considered as the typical frequency band induced by cavitation in the centrifugal pump. The better position for the measurement of vibration induced by cavitation should be as close as possible to the runner and the location where cavitation generated and collapsed. Cavitation occurred as NPSHa decreased to 7.95 m, corresponding to the 0.59% drop in head which was much smaller than the traditional “critical” point (the 3% drop in head from non-cavitation condition).
Footnotes
Academic Editor: Takahiro Tsukahara
Declaration of conflicting interests
The author(s) declared no potential conflicts of interest with respect to the research, authorship, and/or publication of this article.
Funding
The author(s) disclosed receipt of the following financial support for the research, authorship, and/or publication of this article: This research was supported by the State Key Program of National Natural Science Foundation of China (grant no. 51239005), the Program of National Natural Science Foundation of China (grant nos 51479082 and 51509108), the program of Natural Science Foundation of Jiangsu Province (grant no. BK20150516), the Science & Technology Promotion Plan of Ministry of Water Resources of China (grant no. TG1521), and the Priority Academic Program Development of Jiangsu Higher Education Institutions (PAPD).