
Abstract
An automatic and intelligent method for crack detection is significantly important, considering the popularity of large constructions. How to identify the cracks intelligently from massive point cloud data has become increasingly crucial. Terrestrial laser scanning is a measurement technique for three-dimensional information acquisition which can obtain coordinates and intensity values of the laser reflectivity of a dense point cloud quickly and accurately. In this article, we focus on the optimal parameter of Gaussian filtering to balance the efficiency of crack identification and the accuracy of crack analysis. The innovation of this article is that we propose a novel view of the signal-to-noise ratio gradient for Gaussian filtering to identify and extract the cracks automatically from the point cloud data of the terrestrial laser scanning measurement.
Keywords
Introduction
A three-dimensional (3D) construction model could contribute to the construction of a powerful information system against the background of the big data era. The automatic feature extraction and modeling according to the measurement data will be increasingly essential in the field of structural health monitoring. 1
Among the different sensors, terrestrial laser scanning (TLS) is a promising technique for the quick acquisition of 3D spatial information of objects. It has significant advantages when compared with traditional measurement in structure monitoring due to the TLS measurement being area oriented rather than point oriented. Some other advantages of TLS are that it is, for example, highly accurate, non contact, and non destructive. The TLS-based measurement is even more flexible and convenient nowadays by means of kinematic measurement technologies and different moving equipment.
Background
Currently, TLS is often used in various fields, such as civil engineering or archeology, for structural health monitoring and geographic information systems. 2 Surface-based measurement of TLS is reported by many authors. Some of the latter, such as Edelsbrunner, 3 converted point clouds into a consistent polygonal or mesh surface. Vertices, edges, and faces are contained in this mesh surface. Tsakiri et al. 4 used planes fitted to point clouds when estimating the deformation of a sea lock. Van Gosliga et al. 5 modeled the subject with a cylinder in a tunnel monitoring. Chang et al. 6 developed a program of structure surface analysis where the degree of deformation is acquired easily by statistic regression and polynomial function. Koch 7 fitted a 3D non-uniform rational B-spline surface using a lofting method. Deformations of all the points can be estimated over the entire surface of object structures since the identification of the index of representative points is made by interpolating arbitrarily distributed spots. Various types of deformation may result depending on the type of material, size and geometry of the object, 8 and the forces applied. 9
TLS measurement and data processing
The TLS measurement is a reliable method to gain 3D coordinate and intensive information of object surfaces. It can reconstruct the scanned objects accurately and builds a high-fidelity and high-precision 3D point cloud. The development in the fields of solid-state electronics, photonics, and computer vision and graphics in the last 50 years has made it possible to construct reliable, high-resolution, and accurate terrestrial laser scanners. 10 The main process of TLS is that the laser emits from a sender and is reflected by objects; the reflected laser is then received and recorded by the receiver of the laser scanner; finally, the distance between the sender and receiver is calculated. The TLS technology can reconstruct the 3D model of objects rapidly and get the information of the line, surface, volume, and other map data. Compared with conventional measurement methods, TLS changes from point oriented to area oriented and has a great advantage. Currently, TLS is applied in an increasing number of fields, such as civil engineering, 3D city modeling, cultural heritage protection, disaster assessment, and industrial measurement. The following are typical examples of TLS application. With the advantage of TLS, Riveiro et al. 11 obtained the collapse load value and position, as well as the hinges position, and reaction forces of a masonry arch bridge. Abellán et al. 12 studied the geomorphological evolution of the rock face in terms of volume and frequency of rockfall by the comparison of sequential data sets, benefiting from the high resolution and accuracy and the maximum range of the TLS.
The TLS-based method allows the determination of the crack behavior by the measurement of intensity values of the structure. The changes in intensity values between epochs indicate a change in the structure at this position which can usually only occur due to cracks forming. 13 Recently, a method utilizing 3D point clouds was developed to measure crack spacing and deformation, while further analysis of the structural behaviors of concrete slabs subjected to recruiting cracks were documented at the top of each test specimen by photography. 14 In a paper by Olsen et al., 15 cracks of specimen were mapped using TLS to form an intensity map of the specimen, which was also compared with the photos of the specimen. As terrestrial laser scanners have become more available, their applications have become more widespread.16–28
Unfolding and projection of the point cloud
A framework of crack extraction and analysis is presented in Figure 1 involving five steps. First, the 3D data of tunnel structures was collected utilizing TLS technology; second, we obtained the point cloud projection and transferred the point cloud data to an image file; third, we carried out image preprocessing; fourth, the automatic crack identification was programmed; and, finally, we analyzed the cracks of the tunnels. In this article, we focus on the automatic crack extraction with the optimal parameters. The crack width and position analysis are carried out based on the automatic crack extraction.
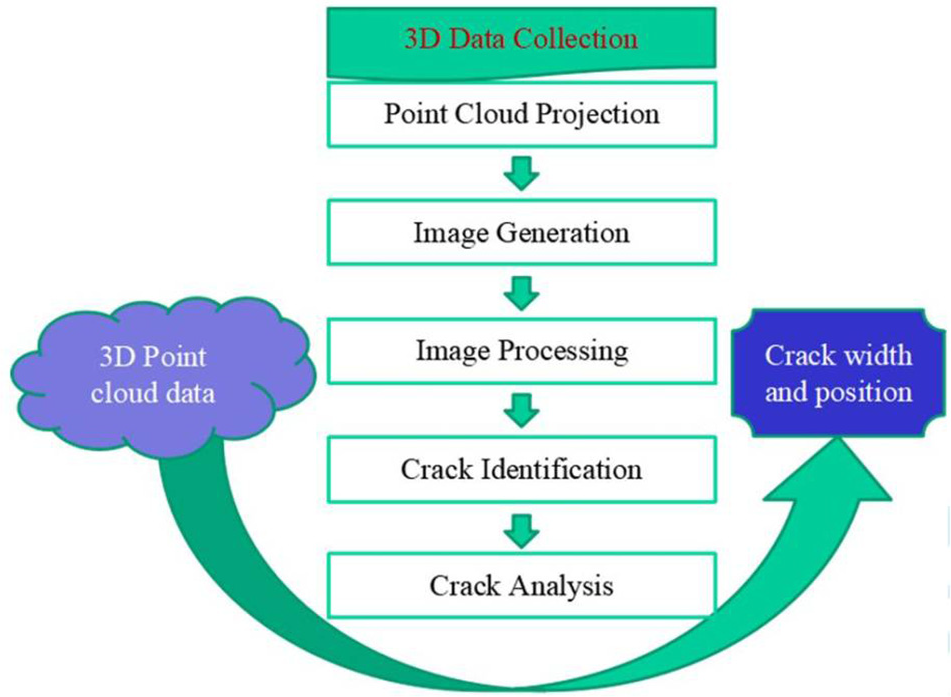
Framework of crack extraction and analysis.
Unfolding and projection are carried out as a pre-step to extract and analyze the character of the crack, and they transform the point cloud from 3D to two-dimensional (2D). First, the tunnel ring is unfolded along a straight line which goes through the highest point of the point cloud and is parallel to the central axis. Second, projection is achieved through remapping the point cloud in a 2D plane with the 3D information. The computational efficiency is improved through rotation of the 3D point cloud where the central axis of the profile turns parallel to a coordinate axis (here, it is a Y axis). In the projection process, the coordinate values of each X and Z are transferred directly to the 2D coordinate system, while Y becomes to zero. The intensity values are used to color the point cloud for visualization. Finally, the information from the 3D coordinates and intensity are mapped to a 2D plane.
Figure 2 shows the result of the transformation, which describes half of the point cloud on one side of the unfolding line. The color of the point cloud represents the intensity property, which will be a key feature used to extract cracks. It could be observed in Figure 2 that the point cloud reflects the complex constitution of the objects, such as electricity lines, segment protruding, and gaps. Therefore, suitable strategies are required to separate cracks from the complex background.

Unfolding and projection of the tunnel section.
The projection considers the protection of the original information of the point cloud. Because the main principle is to rotate the whole tunnel to be parallel to, for example, the Y axis, and then eliminate the Y coordinate of each point. Finally, the X and Z coordinate is obtained, strictly keeping the relative-position information of each point in the XOZ plane, and the intensity is directly the same as the original one. The projection method also has a low computation cost.
However, the effect of crack overlap or tensile deformation is challenging. The crack overlap could happen, for example, at the top area of the tunnel. In this case, we can improve it by projecting segmented parts, which is illustrated in the Figure 3. Suppose point E is the observation position, the arrows stand for the lines of sight, and the point cloud is distributed in angle range (–Pi, Pi). The observation angle OA is defined as the angle between the line of sight and the tangent of the local point cloud (excluding the parts of rails and ground under G1G2). The larger the OA, the better the observation gained. Before the improvement, the lines of sight (yellow arrows) are parallel to the top area, which could cause the OA to approach 0 and an overlapping effect of the cracks. However, due to the improvement (black arrows), the segments with angle A (Pi/4, 3Pi/4) have a vertical line of sight and the observation angle obviously increases. Therefore, the crack overlapping in the top area is eliminated.

Projecting segmented parts.
Concerning the tensile deformation, we discuss it in detail as follows. If the crack is parallel to the XOY plane, the length of crack detected changes to a lesser degree, and the change ratio is related to the observation angle. Suppose the minimum observation angle is Pi/4, according to the improved projection. Accordingly, the maximally changed length will be
We will pay more attention to the effect of crack overlap or tensile deformation in future papers. However, this article focuses mainly on the optimal Gaussian filter, which is important for successful crack detection.
Local index method
In order to extract cracks efficiently, an index method is used for the tunnel point cloud data, whose size is usually several gigabytes, which causes heavy computation costs. The index method could output the local point cloud data of a tunnel section of arbitrary miles and height. Suppose the tunnel is divided into M rings
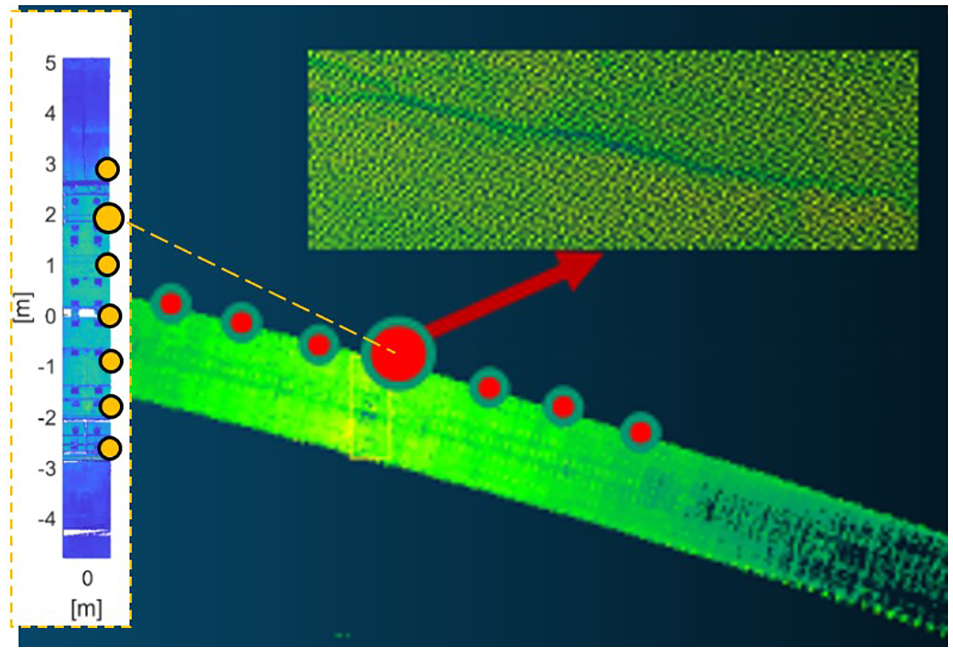
Crack in the 3D point cloud data of the tunnel.
Crack detection
The crack-detection method proposed is illustrated on a selected part of the point cloud whose area is about 60 × 30 cm2, as shown in Figure 5(a).

Crack description: (a) Projection of the tunnel point cloud and (b) gray image of the tunnel point cloud.
Based on the projected point cloud data shown in Figure 5(a), an image is generated where each point is projected to one pixel, which is presented in Figure 5(b). The projection is computed from equation (1), where

The transformation produces an image, which is shown in Figure 5(b) with a color bar whose range is (0, 255). An obvious texture is observed in Figure 5(b), caused by the line-wise scanning manner of TLS measurement. The texture is straight shape in the original 3D mapping but afterwards becomes curved through the unfolding point cloud to the 2D plane. It is challenging that the texture is intrinsic in the image, which will influence the results detecting the crack significantly. The method proposed should have a capability of noise immunity, which could settle the texture problem and extract the correct cracks.
Gaussian filter is a linear filter that suppresses noises and smooths images effectively. The principle of Gaussian filter is outputting the averaged value of elements inside the template; the template coefficients are computed after equation (2)

where H is the gray value of a pixel, i and j are the index of a pixel, σ is the standard deviation of Gaussian template, and k indicates the size of template to be (2k + 1) × (2k + 1). The σ is one of the most essential parameters in Gaussian filter, where a smaller σ reflects that the coefficient of the pixels close to the template center is large and far from the template’s center is small; conversely, a larger σ indicates similar coefficients of the elements inside the template, which approaches an average template. Therefore, a larger σ has a more significant smooth effect on the images. This method has a capability of noise immunity, which could settle the texture problem and extract the correct cracks.
However, an over-smooth effect undermines important features in the image, such as cracks whose size is very small in the crack width direction. The article adopted a signal-to-noise ratio (SNR) which is computed based on the number of pixels with the value 0 after equation (3)
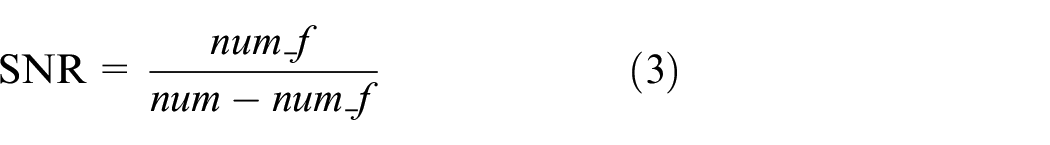
where num_f is the number of 0-value pixels after filtering, and num is the number of 0-value pixels before filtering.
Data analysis
It is critical to improve the efficiency of crack identification to extract cracks from massive 3D point cloud data. This article proposes a novel method which combined Gaussian filtering of optimal parameters and SNR analysis. This method can increase the effectiveness of automatic crack identification and ensure the accuracy of the crack analysis. Gaussian filtering of various parameters σ are presented in Figure 6, where the left corresponds to the parameters (N = 10, σ = 1), the middle (N = 10, σ = 2), and the right (N = 10, σ = 3). Here, N = 2k + 1 is the size of the template. It could be observed that when σ = 1, it requires more complex algorithms to identify cracks automatically, which not only extends the computational time but also reduces the reliability of recognition. This is unacceptable for tunnel identification of massive point clouds.
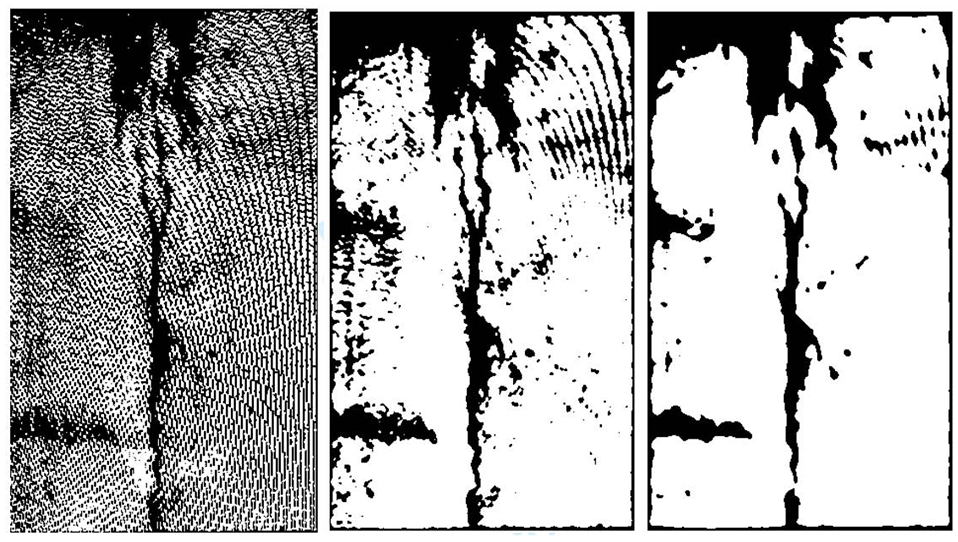
Gaussian filtering of various parameters (left corresponding to σ = 1, middle σ = 2, and right σ = 3).
The most important parameter for generating a Gaussian filter template is the standard deviation σ of Gaussian distribution. The standard deviation represents the degree of dispersion of the point cloud data. If the σ is small, the center coefficient of the template generated is large and the surrounding coefficients are small, so the smoothing effect on the image is not obvious; otherwise, when the σ is large, the smoothing effect on the image is obvious.
Result
In this article, the crucial problem is how to identify cracks more effectively while ensuring the accuracy of crack analysis. A new method is proposed adopting the SNR distribution to optimize the parameter σ. The distribution of SNR based on Gaussian filtering is presented in Figure 7.

SNR distribution of Gaussian filtering.
According to Figure 7, the relation of the SNR and σ is a reverse correlation which indicates that when the σ is increasing and the SNR is decreasing. It is hinted that the effectiveness of automatic identification is based on reducing the SNR. It could be observed that after σ is 2.1, which is marked as a red line in Figure 7, the SNR tends to a fixed value. Furthermore, it is better to take a bigger σ during the stage where the SNR is not significantly reduced. Therefore, it necessary to analyze the optimal parameters during the σ range from 1.1 to 2.1, which is marked with red dotted lines in Figure 7. The gradient of the SNR is listed in Table 1.
Analysis of parameter performances.
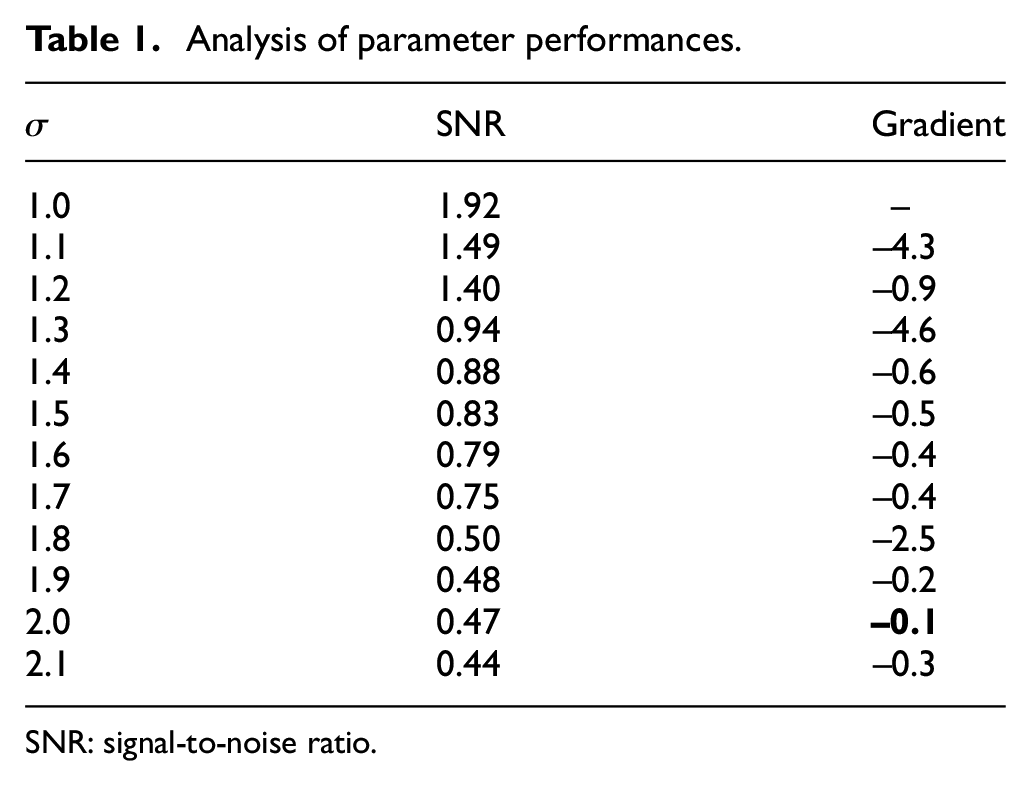
SNR: signal-to-noise ratio.
According to the gradient of the SNR in Table 1, the optimal parameter of σ is 2.0, which corresponds to the minimum absolute gradient 0.1 (marked in bold). Gaussian filtering when σ is 2.0 is presented in the middle of Figure 6.
Conclusion
The TLS measurements are adopted to extract crack information for intelligent structural health monitoring with the assurance of high-quality 3D model construction methodologies. In this article, we proposed an SNR distribution with the parameter σ of Gaussian filtering method to identify cracks automatically based on 3D point cloud data. The parameters SNR and σ are adopted to optimize the efficiency of crack extraction and accuracy of crack analysis. The following conclusions can be drawn:
The optimal value σ of Gaussian filtering can be automatically extracted by finding out the maximum gradient of SNR distribution.
A novel method is proposed to balance the efficiency of crack extraction and the accuracy of crack analysis. The results of different σ are presented and compared based on Gaussian filtering.
An automatic and intelligent modeling method for composite tunnel structures is investigated based on Gaussian filtering.
Footnotes
Handling Editor: James Baldwin
Declaration of conflicting interests
The author(s) declared no potential conflicts of interest with respect to the research, authorship and/or publication of this article.
Funding
The author(s) disclosed receipt of the following financial support for the research, authorship and/or publication of this article: The publication of this article was funded by the Open Access Fund of the Leibniz Universität Hannover. The authors gratefully acknowledge the support of the Natural Science Foundation of Jiangsu Province (grant no. BK20160558).