
Abstract
The hazards of cracks, which could badly decrease reliability and safety of structures, are receiving increasing attention with the popularity of tunnel constructions. Traditional crack inspection relies on visual examination, which is time-, cost- and labor-intensive. Therefore, how to identify and measure cracks intelligently is significantly essential. The paper focuses on the Canny method to extract cracks of tunnel structures by the intensity value of reflectivity. We propose and investigate a novel method which combines dilation and the Canny algorithm to identify and extract the cracks automatically and intelligently based on the point cloud data of terrestrial laser scanning measurement. In order for measurement of cracks, the projection of summed edge pixels is adopted, where a synthesis is carried out on the detection results with all sampling parameters. Based on the synthesized image, vertical crack presents two sharp peaks where the space of the peaks indicates the average width of the crack, as well as its position. The advantage of the method is that it does not require determination of Canny detector parameters. The deviation between manual measurement and Canny detection is 2.92%.
Introduction
Research about intelligent health monitoring of structures has be given important attention with the rise of artificial intelligence. 1 Automatic detection of cracks is an indispensable stage in the intelligent health monitoring of tunnel structures. 2 Visual inspection is a subjective and qualitative way which cannot satisfy the requirements of rapidly increasing tunnel structures, regarding the quantitative analysis of cracks, for example, the determination of orientation, length and width. As a result, it is important and necessary to propose a way to gain quantitative information of cracks which could be applied to assess the performance of tunnel structures. 3
Crack detection
It is extremely important to define maintenance strategies and to optimize interventions concerning the accurate assessment of the state of structures. Consequently, crack detection and analysis play a particularly essential role. However, many limitations are found in extempore techniques. Therefore, the investigation of automatic detection methods to monitor cracks of tunnel structures based on laser scanning and image processing has significant advantages, especially considering the rapid development time of tunnel engineering.
Some investigations are focused, for example, on bridge, beam and residence, but there is still an urgent requirement for relevant intelligent detection for tunnel structures. Valenca proposed the MCrack-terrestrial laser scanning (TLS) method to automatically assess cracks in bridge structures. The images captured using this method are orthorectified by geometric information surveyed by TLS, solving one of the major drawbacks of applying image processing for crack characterization on large structures. 4 Cabaleiro proposed a method to detect automatically cracks in timber structures through LiDAR data, which identified, analyzed and monitored cracks and determined crack geometries. Validation is carried out through testing laboratory specimens and field work structures. 5 Erkal coupled high resolution TLS with images in order to capture geometric data to detect and quantify damages of object surfaces which focuses mainly on combination of the high-quality features of point clouds and images. The method realized effectiveness and automation in damage detection and documentation which could reduce labor requirement compared with traditional methods. 6 A system was present by Chaiyasarn et al. 7 which could obtain a mosaic image of a tunnel structure that generates the point cloud data for the object surface from uncalibrated images.
TLS
Laser scanning techniques to measure 3D objects have been well known in the area of airborne surface information acquisition for many years. The main principle is that the laser beam measures the distance and the angle of the objects. Nowadays, theories and methods of TLS have been widely studied to solve the assignments of object monitoring. The TLS-based measurement is a suitable way to detect the cracks of various structures. It is frequently applied in the field of deformation monitoring, 3D mapping and digital design. 8
Terrestrial laser scanner collects point clouds data to draw the outline of objects. There are three steps for the measurement based on principle of phase difference. (1) Laser pulses are transmitted in a direction determined instantaneously by rotating mirrors. (2) Laser pulses are reflected from the object surfaces. (3) Terrestrial laser scanner receives laser reflected from objects. Consequently, TLS acquires the coordinate values of point clouds which can be applied to construct 3D model of objects. In addition to coordinates, the intensity information also could be detected which could be employed to extract and analyze cracks of the objects. The TLS method is highly accurate, reliable and has broad application perspectives which have been applied to enhance traditional approaches to the deformation analysis of concrete structures.8–21
Method
The main method used in this paper is dilation and Canny edge detection. Unlike crack detection in other applications, such as pavement crack detection where the image texture is not manifest, the appropriate method should be initially applied to settle the texture problem. We dilated the grayscale of the image in the preprocessing step for crack detection.
Image dilation adopts a structuring element to extract the corresponding shape in an image which dilates the image and decreases noise. 22 The output depends on the size and shape of the structuring element. Grayscale dilation is computed using equation (1) 23
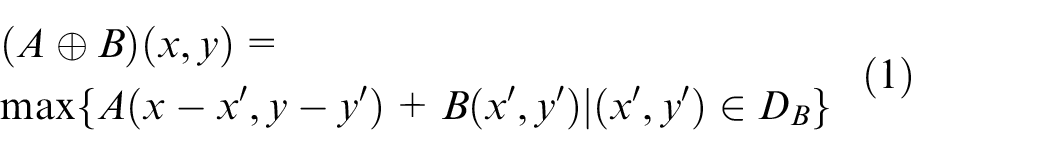
where A is the image, B is the structuring element, DB represents the domain of structuring element B,
Canny detection is adopted to detect the edge of the image where the cracks are separated due to a local gray value mutation identified as edges. The Canny edge detector was developed by JF Canny 26 in 1986 and uses a multistage algorithm for edge detection in images. It is known as one of the best performance edge detectors. The principle of Canny detection includes a Gaussian filter, intensity gradient, non-maximum suppression, a double threshold and edge tracking by hysteresis. It provides a relatively efficient and precise methodology for the edge detection problem, and further research also focused on improvements inside the steps to optimize the Canny detection performance in terms of accuracy and robustness in very complex application cases.
The Gaussian filtering step is computed with a mask of size (2k + 1) × (2k + 1), where each element in the mask is obtained after equation (2) 26
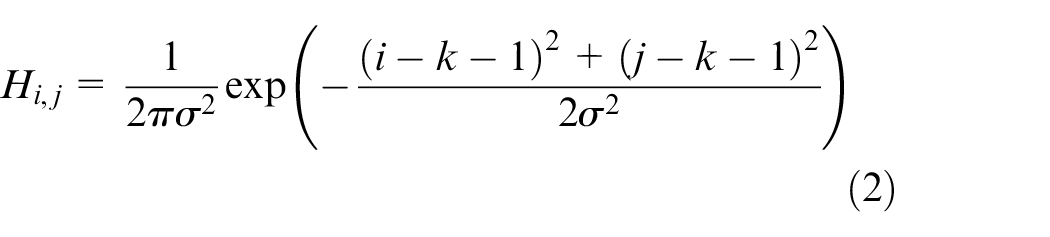
where i and j are pixel indexes,
The intensity gradient implies the edge direction of the image, where four directions are followed in the Canny detector as horizontal, vertical and diagonal directions. As defining the crack position and width are the main tasks and the shape of the crack is not the main concern, four directions in the operator are enough in this case. The gradient magnitude and direction are determined using equations (3) and (4),
26
where G is the gradient magnitude, Gx is the gradient in the first direction, Gy is the gradient in the second direction and

After the gradient is known, a pixel is marked as an edge through non-maximum suppression, where the pixel is preserved only when it is recognized as a local maximum gradient magnitude. In order to filter spurious edge pixels, double threshold is carried out to suppress edges that are under a low threshold. Finally, the edge connection is tracked where the weak edge is kept only when there is a strong edge pixel in its neighborhood. 26
We adopted MATLAB to program the edge detection where there are existing dilation and Canny detector tools. The dilation in MATLAB contains two steps: The generation of the structuring element and application of the structuring element to the image. The main parameters defined are the shape and size of the structuring element. The parameters of the Canny detector are the high threshold, low threshold, and standard deviation of the Gaussian filter. The threshold will be in the range of 0 to 1. Low threshold, if not set specifically, is assigned 0.4 times of the high threshold and standard deviation will be assigned 1 in default.
Measurement data
The method to extract the cracks in tunnel structures automatically is based on the data of TLS. A diagrammatic sketch is shown in Figure 1.
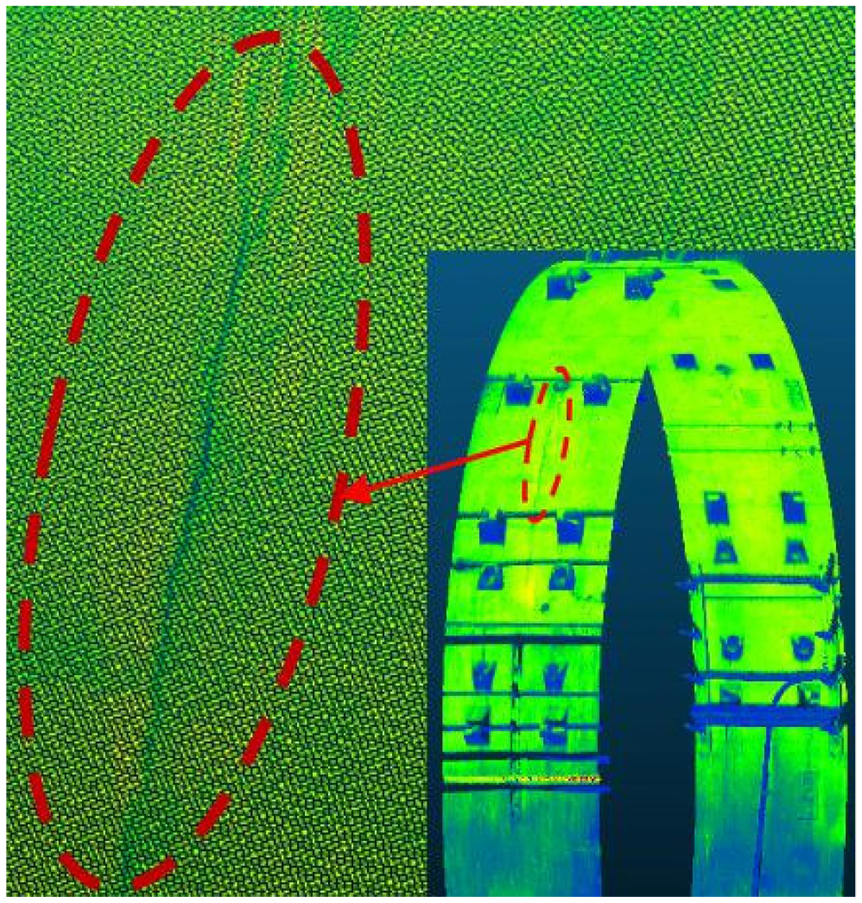
A description of a crack in the tunnel profile.
A section of tunnel is depicted in Figure 1, where colors indicate the intensity of the scattering laser beams. The red ellipse marks a crack in the tunnel. The 3D features of the tunnel could be observed in Figure 1 as well as external objects, such as electricity lines. The paper is aiming to extract cracks in the selected rings, where all the rings will be examined by applying an index method. The accuracy and time-consumption are the main concerns in evaluating the proposed crack detection method.
Analysis
The method proposed is based on image processing. The point cloud must be transformed into an image form to carry out the image processing steps. The point cloud data in Figure 1 is a 3D point cloud. Our method will generate an image from the 3D point cloud and preserve the features reflected.
First of all, the point cloud is unfolded along the top axis which is parallel to the center axis of the designated ring. Through this step, the ring point cloud will be transferred to a two-dimensional point cloud, which is necessary to generate a rectangular image that is easy to process further and whose block-wise form facilitates the global retrieval of point cloud data. Figure 2(a) shows a patch of point cloud which is obtained through unfolding. Thereafter, the image is generated based on the two-dimensional point cloud. Figure 2(b) presents the transferred image of Figure 2(a), where each point (X, Y) in (a) has a corresponding pixel I(i, j) in image (b). The index (i, j) of the pixel is proportional to the coordinate value (X, Y) of the point with a resolution value R, and the gray value of I(i, j) is obtained through an intensity value of each point, which is normalized to the range of [0, 255], marked as [R, G, B]. The space between the points is reflected in (b) as black pixels, which are not assigned with an intensity value, which is the case of the exemplary point with [R, G, B] value [0, 0, 0]. Because the laser scanning measurement is taken in a line-wise manner, the space between the lines is organized, but must not be equal to the space of points in line. This is why black pixels appearing in the image are structured in a direction. Crack detection is carried out which overcomes the challenge of the grayscale image through using dilation and the Canny detector.
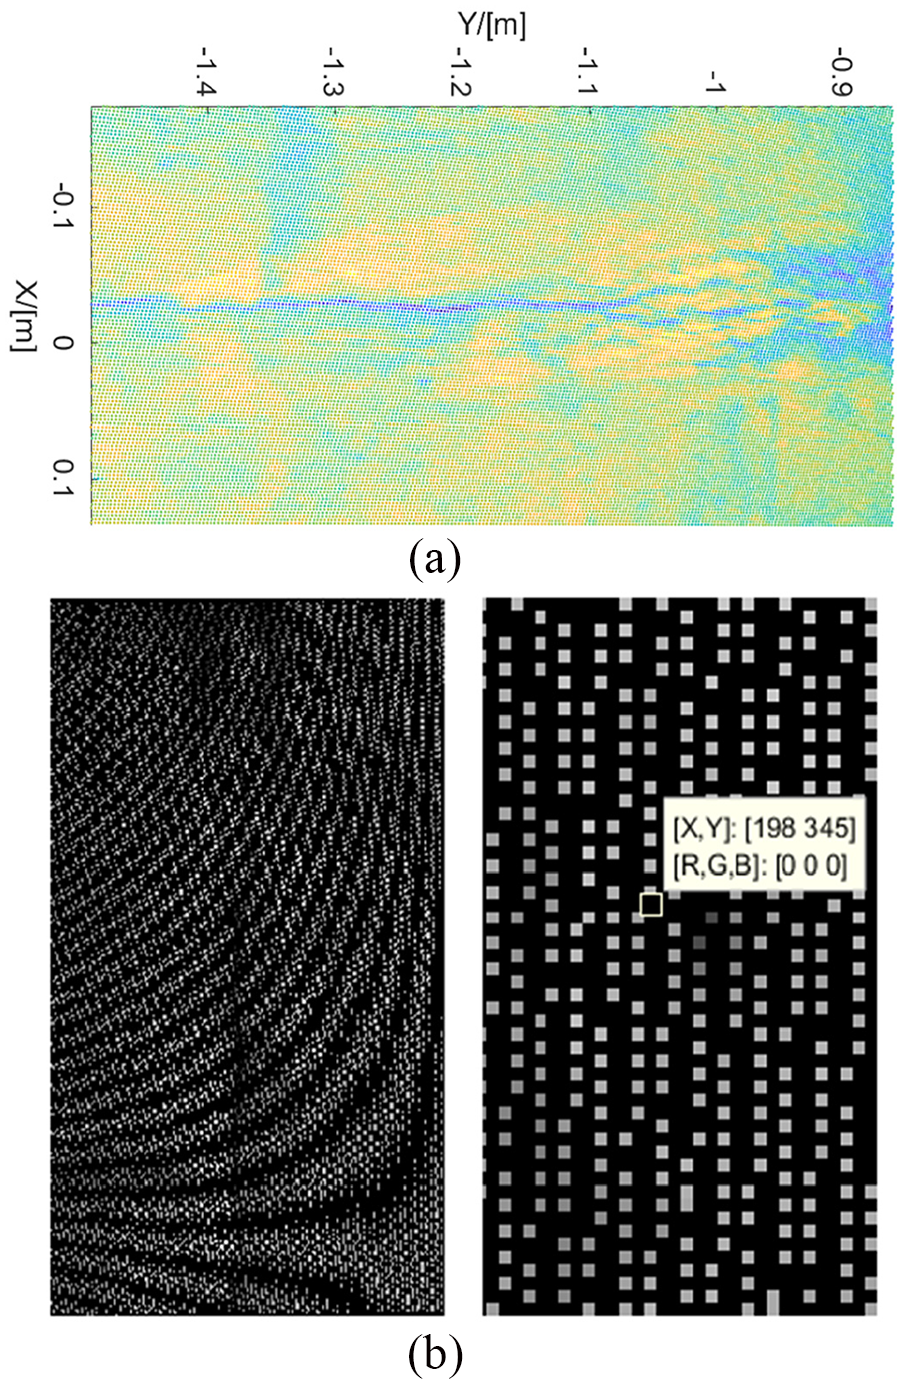
Prepossessing of point cloud: (a) point cloud data; (b) transferred data.
This paper applies a structuring element with a disk shape and a size of 2 pixels in the dilation step. The disk shape is applied because the point cloud is distributed in such a way that no special preference occurs in the directions. Neighbors in all directions of the structuring element are searching for equal treatment in the computation. In this regard, a square structuring element will not make an effect, since it overpasses some pixels near the four sides of square, which will be contained in a disk-shaped solution. The selection of 2 pixels is based on the fact that the average space of gray pixels is 2, which is reflected in Figure 2(b), and that the black space between bright pixels is an average of 2. The result of the dilation computation is presented in Figure 3. The dilation image is much clearer compared with the left figure in Figure 2(b) and eliminates the texture in the original image. Consequently, only features of the object remain, which improve the accuracy of crack detection.
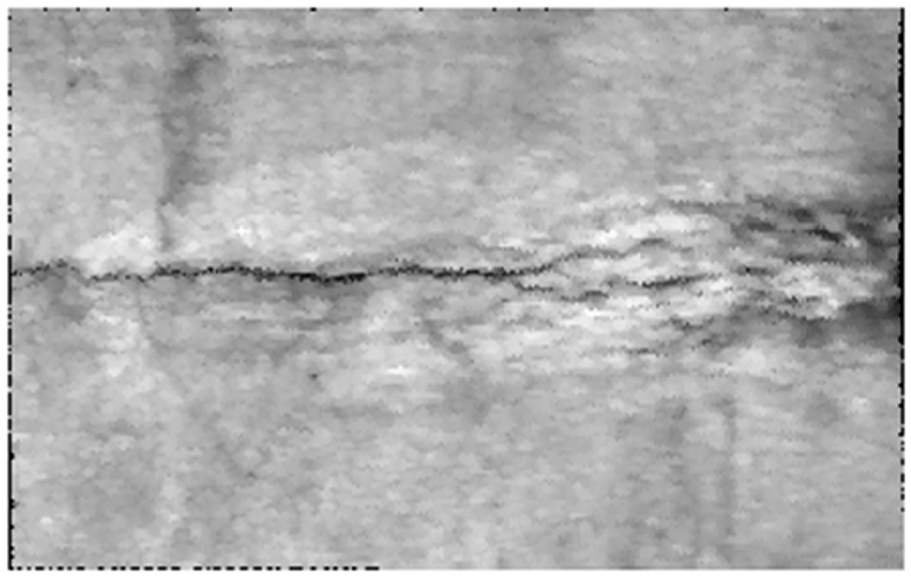
Dilation result of the data.
Considering the goal of this paper is to intelligently extract crack based on TLS measurement, which is 3D point cloud data but not the image data, it is not suitable to discuss the image quality metrics here; however, we will investigate the image quality metrics based on the laser scanning, photogrammetry and other technologies. It is better to avoid the excessive processing of the data, which will add extra noise and textures to the pixels, to make the dilation image much clearer. Therefore, the edge detector is applied straight after the dilation step.
Other morphological operators like erosion, opening and closing are investigated in this paper. The erosion is the opposite operation of dilation which has the effect to delete some pixels in the edge of object. Opening operation is the process of dilation of the erosion, and closing operation is the process of erosion of the dilation. Processing results of the closing, opening, dilation and erosion operations combined with Canny edge detector are presented in Figure 4, where the white pixels represent cracks. It is observed that the images of erosion and opening operations are black overall. This is related to the fact that the crack width is relatively small compared with the texture stripe, and the crack pixels are eroded totally when using erosion or opening operation, which starts with erosion, to eliminating textures. Here the parameters are set as in Table 1
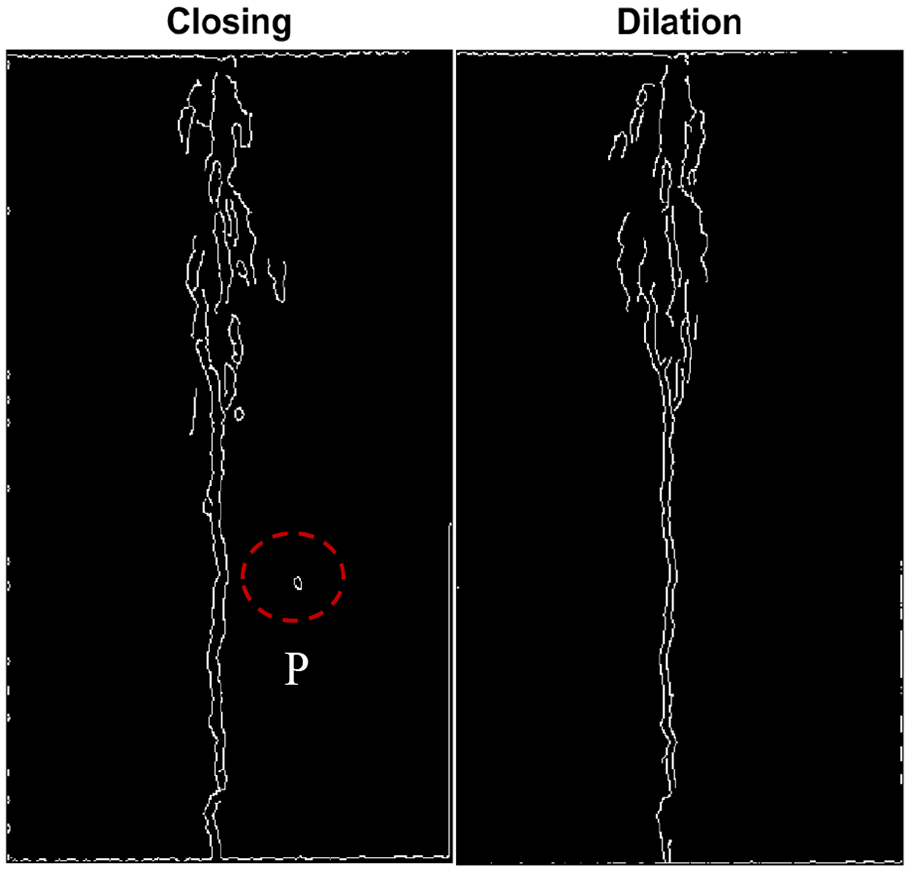
Canny edge detection with the Closing (left) and Dilation (right).
Parameter settings for the proposed method.
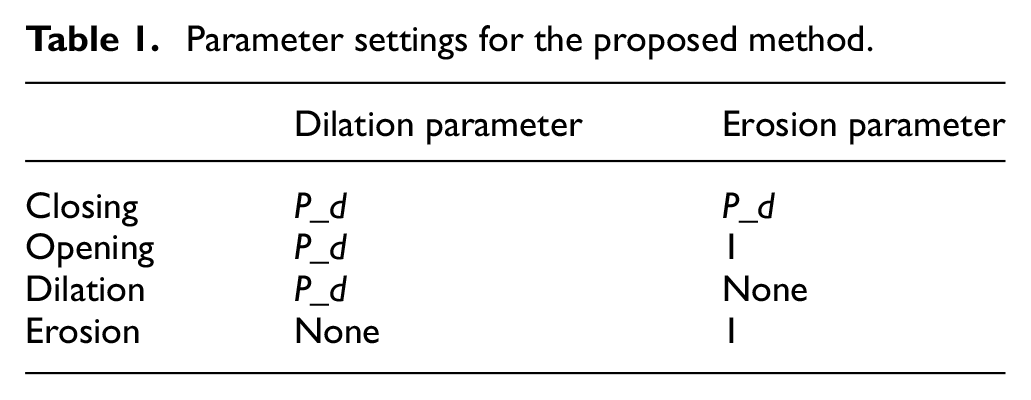
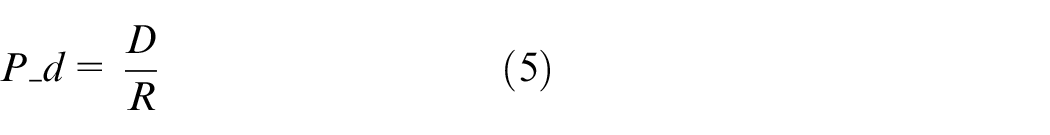
The dilation parameter is P_d, whose value should be related to the point cloud density metrics D. A reference value for P_d is obtained after equation (5), where the R is resolution involved in image transformation. The density metrics D in equation (5) is computed as the average of neighbor point distances. The erosion parameter is set according to different operations. In the erosion or opening operation, it is set to 1 pixel in attempt to preserve the small-width cracks, while in the closing operation, it equals P_d to accommodate the dilation step. All the information will be lost after we do the opening with canny edge detector. Therefore, the closing operation is benefited to extract the crack intelligently for the point cloud data. The Canny edge detection with the Closing and Dilation operations are presented in Figure 4.
According to Figure 4, area P marked with red ellipses in closing operation remains, which is not any part of cracks. As known to all, closing operation makes effect to fill in small voids in objects. But for this image transformed from TLS data, adoption of closing operation brings extra noises, which could be induced mistakenly by void filling of textures other than cracks. Therefore, the dilation operation performs best in the four operations.
Three methods to identify the cracks and the extractions are investigated in Figure 5 where the left one corresponds to the Sobel detector, the middle one is the Robert detector and the right one is the Canny detector.
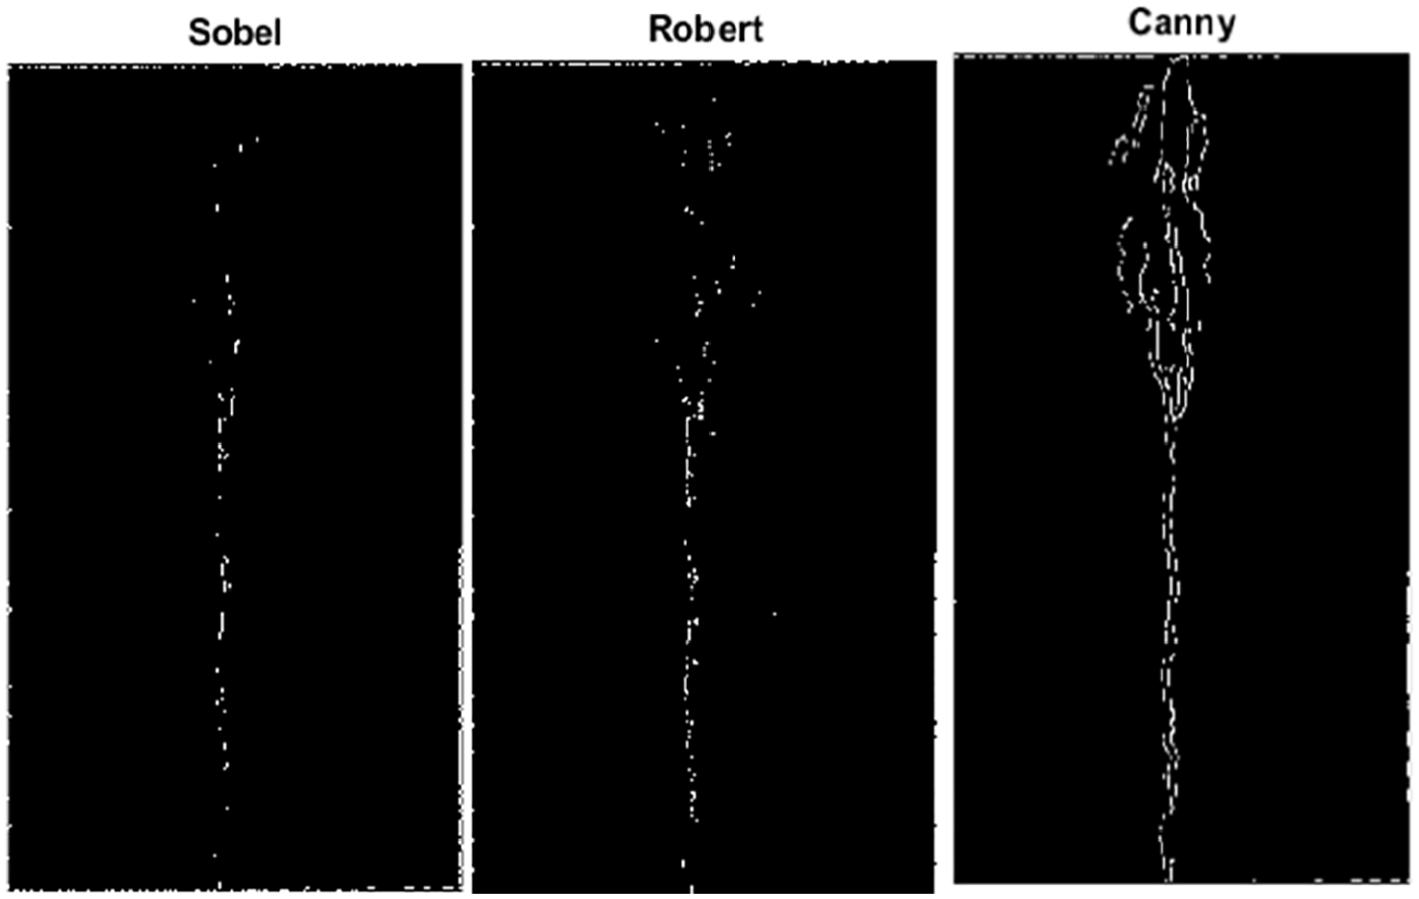
Crack identification with Sobel, Robert and Canny detectors.
The white pixels in Figure 5 are crack areas and black pixels are the background, where the total pixels are 580 by 300. It can be observed that the Canny detector algorithm is the optimal edge detector, which has advantages in the crack detection.
In order to compare the Canny filter with Sobel and Robert filters, two more experiment datasets are extracted and the results of Sobel, Robert and Canny detectors are presented in Figure 6, which is obtained from the point cloud of the same tunnel.
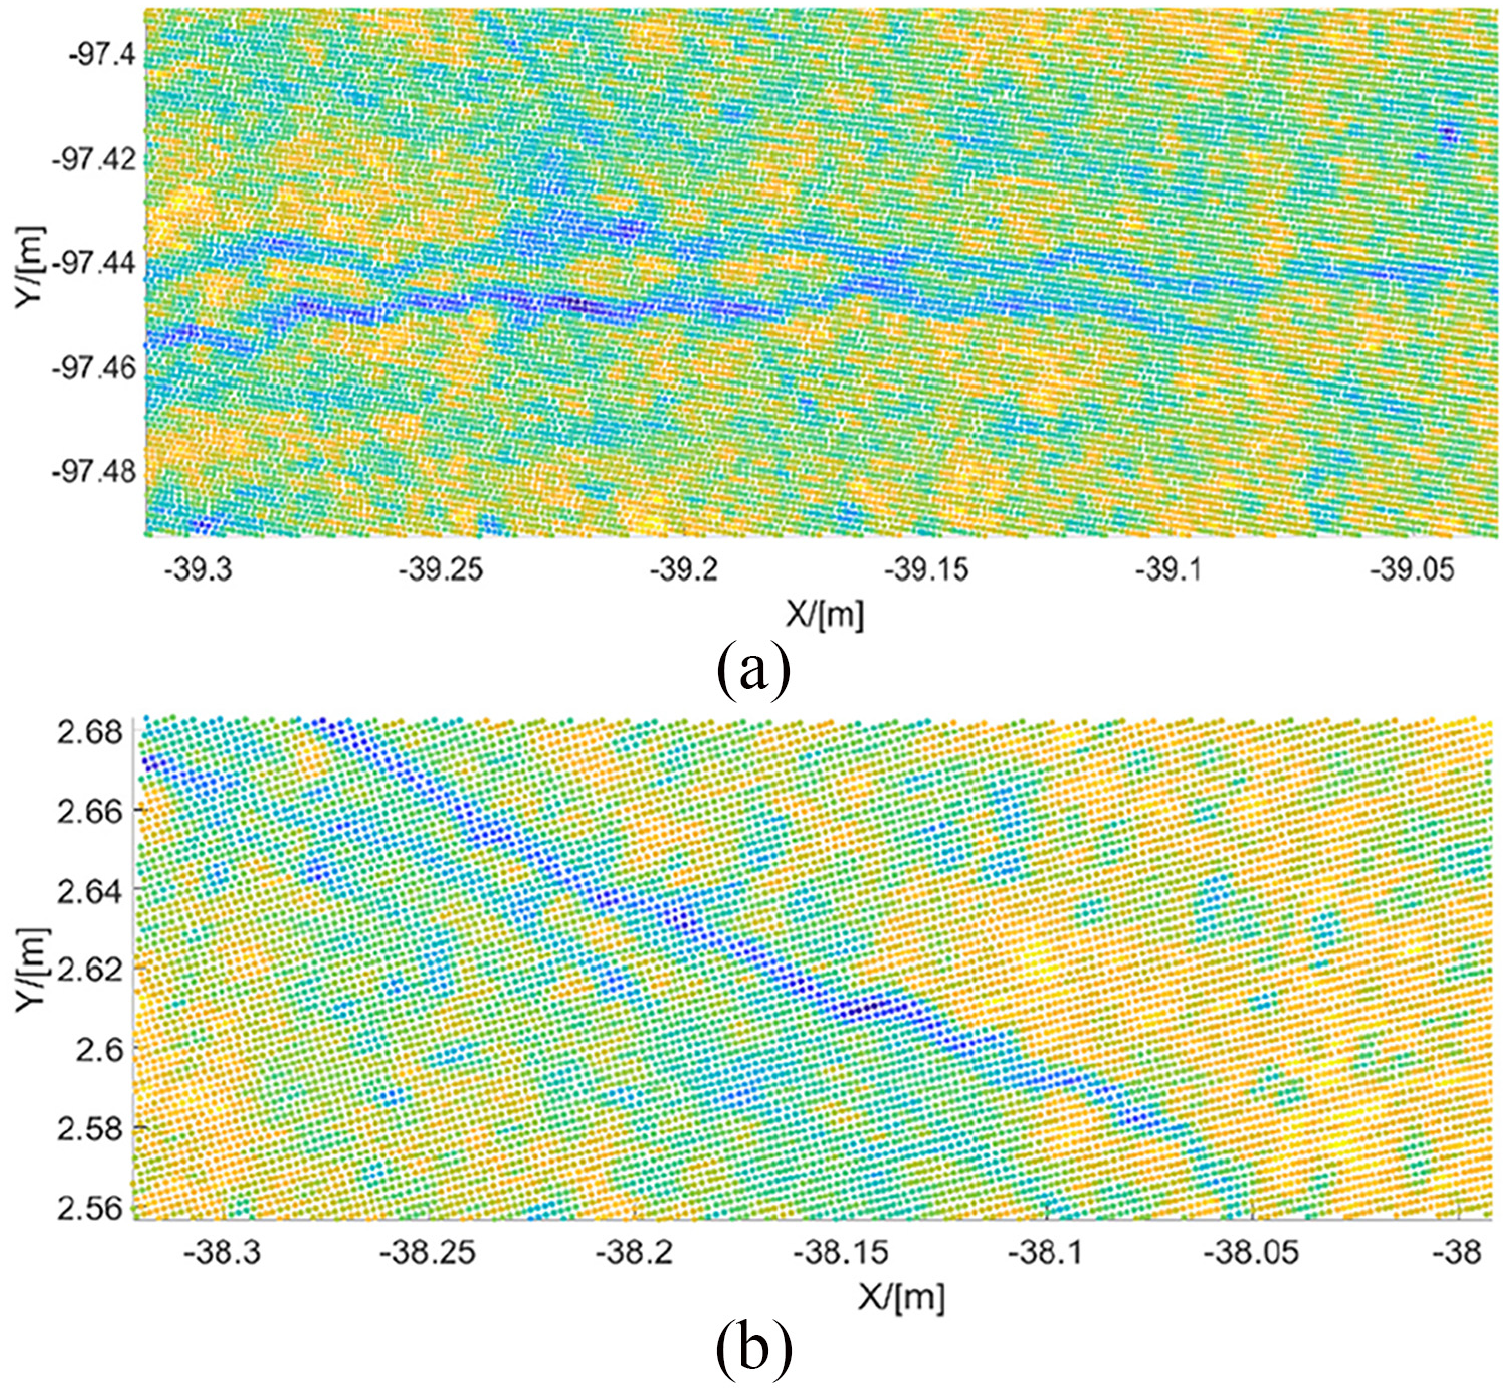
Point cloud datasets: (a) dataset A; (b) dataset B.
The color in Figure 6 stands for the intensity value of point cloud, where the crack area holds a different reflectivity value and therefore appears a sharp change in color. Sobel, Robert and Canny detectors with datasets A and B are presented in Figure 7 where the crack areas are corresponding to the white pixels and background is corresponding to the black pixels.
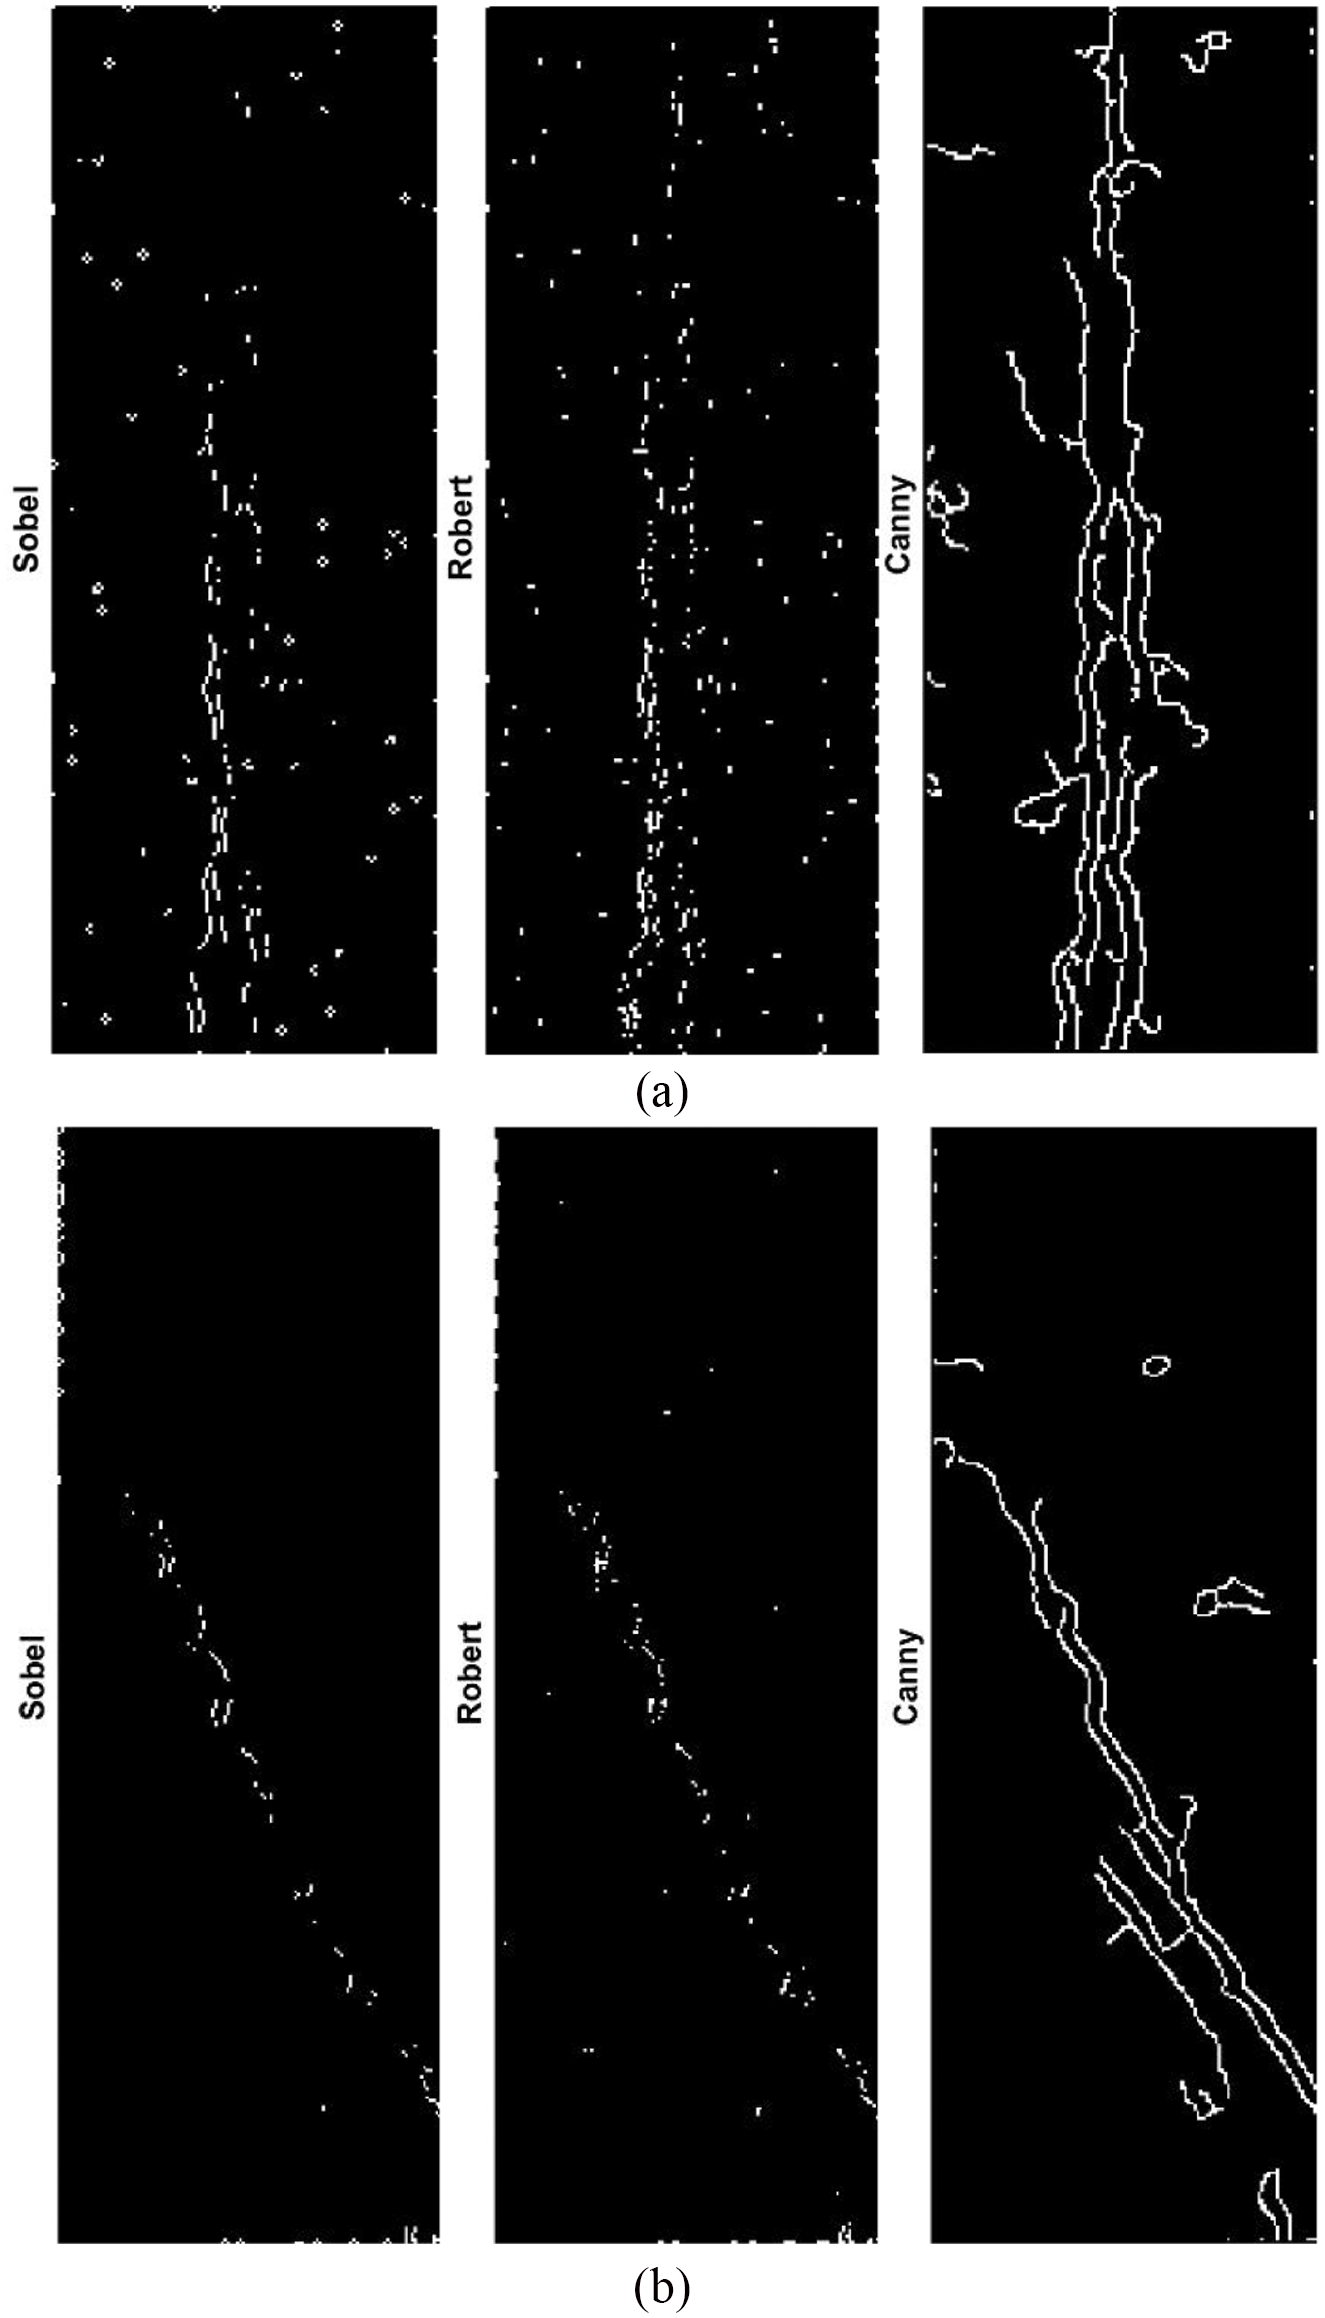
Comparison of Sobel, Robert and Canny detectors: Sobel, Robert and Canny detectors with (a) dataset A and (b) dataset B.
It is observed in Figure 7 that the result of Canny detector is better than Sobel and Robert detectors. Therefore, we adopted the Canny method to identify cracks for 3D point cloud data of the tunnel structure which is measured by TLS.
In order to verify the quality metrics of the image processed with the proposed method, we extract more cracks in the tunnel structures, with varying point cloud density, cracks appearance and positions. The method for parameter settings is indicated in equation (5) and Table 1. The image processing results are presented in Appendix 1, where the white pixels indicate cracks and the color images are point cloud data. The images are rotated so that one side of the image is parallel to the coordinate axis. This strategy can avoid the identification of image boundary as cracks.
Result
In order to characterize the credibility of the Canny parameter, confidence intervals are investigated which show that the true value of the edge pixel number has a certain probability of falling around the result detected. The high threshold is set as [0.01, 0.99] with an interval of 0.01 and the low threshold is 0.4 times the high threshold, where the number of detected edge pixels is show in Figure 8.
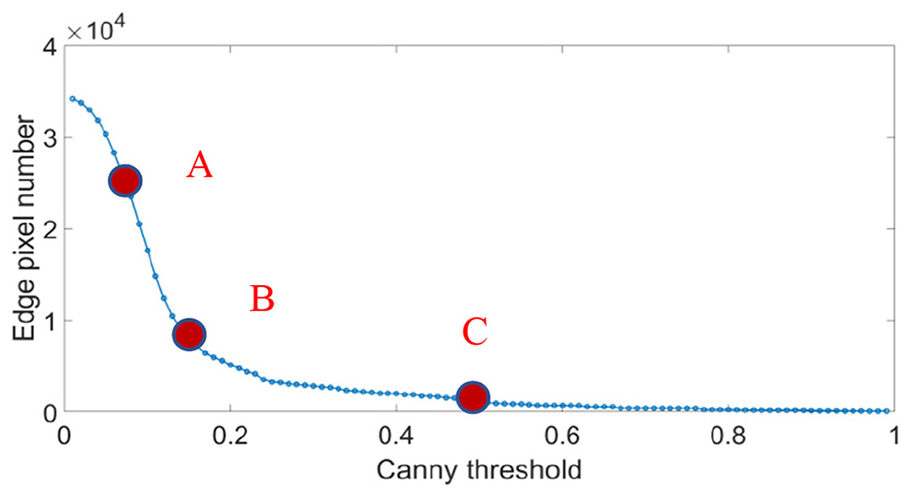
Relation of threshold and edge pixel number.
It could be observed in Figure 8 that the edge pixel number decreases continuously when the threshold increases. The marked points A, B and C correspond to the 50%, 75% and 95% of the confidence level, whose detecting results are presented in Figure 9.
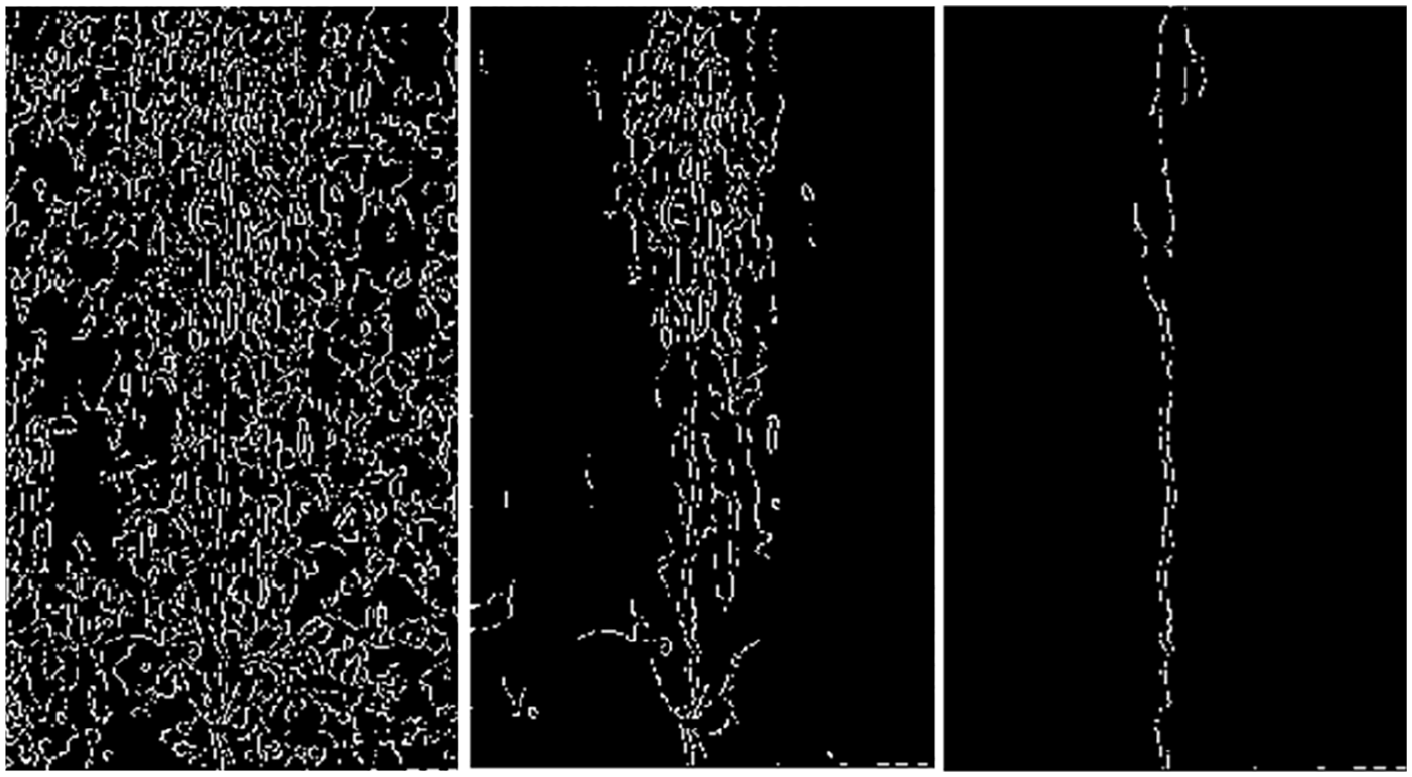
Comparison of different confidence levels.
The detection results of the different confidence levels are presented in Figure 9, where the left figure corresponds to the 50% confidence level, the middle one to75% and the right one to 95%. It is observed that the Canny detector with a 95% confidence level is the optimal parameter to identify the cracks in this study.
A visual verification of the detection result is shown in Figure 9, and a quantitative investigation is carried out based on the image of Canny detection in the following. Normally, the best detection result is calculated, and the measurement of cracks is carried out. However, in the case that no reference image and no other verified results are known, the best result is hard to determine. We proposed that the crack analysis should be based on the summed crack image, which is a synthetic image obtained from the sum of crack images of all thresholds detected in Figure 8. Based on the synthetic image, the pixels are summed according to each column, from the first column to the last column of the image. The result is shown in Figure 10, where the horizontal axis is the column number and the vertical axis is the total number of pixels detected as cracks in the corresponding column.
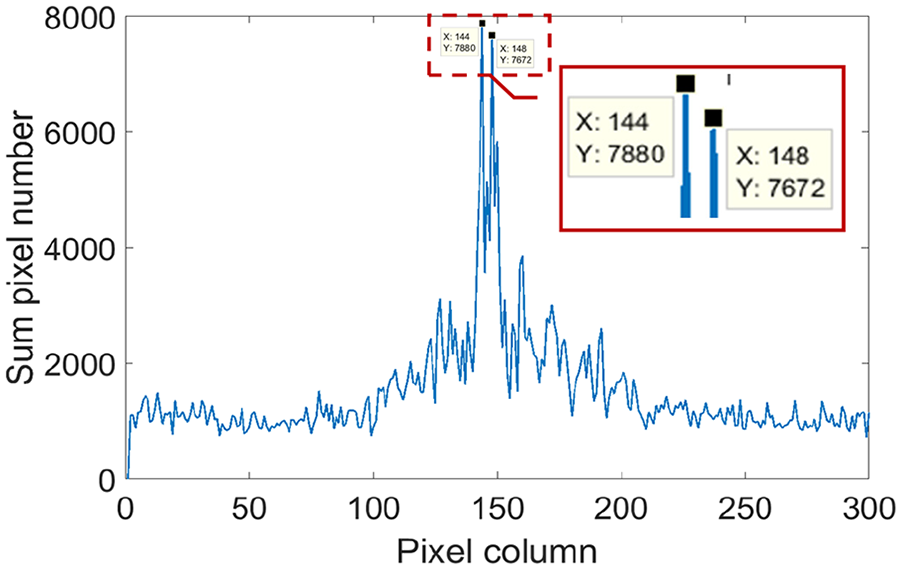
Projection of summed edge pixels.
According to the distribution of summed pixel numbers in Figure 10, there are two peaks at pixel number 7672 and 7880 around the middle of the columns, which are three times larger than in the other parts. In the Canny detection, the edge pixels are assigned a gray value, while non-edge pixels have a gray value of 0. Hence, the peaks in Figure 10 correspond to the crack occupation. Therefore, it is hinted that this projection of summed edge pixels can identify the crack and obtain its position. Furthermore, it can also be observed in Figure 10 that the crack occupies the columns 144 to 148, which is around the middle part of the image. Because the intensity of crack edges changes sharply in TLS measurement and the data process preserves this feature of the crack edge in order to analyze the cracks accurately, the first peak in Figure 10 corresponds to the left side edge of the crack and the second one is the right side. According to Figure 2(a), the width of the crack is measured as 0.42 cm at point a and 0.40 cm at point b, with an average crack width of 0.41 cm. The occupation of crack width in the point cloud width can be calculated approximately as 1.36%. The occupation of crack pixels in the total columns is 1.33%, which is obtained by (148 – 144)/300, so the error between the measurement and Canny detection result is 2.92%.
The method proposed manages to detect the tunnel cracks automatically with data from TLS measurement. It is applicable to both vertical and horizontal cracks. This is because the projection of summed edge pixels brings in significant peaks in the pixel distribution in both cases, where vertical cracks correspond to peaks in the column projection and horizontal cracks correspond to row projection. Since vertical and horizontal cracks are among the most significant crack forms in precast concrete segments of tunnel structure, automatic detection of these cracks will contribute to intelligent inspection of tunnel structures, which saves time and labor.
In the next step, the reticulated cracks that are presented as a net and the tilted cracks that holds a tilt angle with the central axis of tunnels will be investigated. It is supposed that the reticulated cracks will produce an area with moderate peaks in any direction of projection, and tilted cracks will be identified though a projection with a certain direction.
Conclusion
A new method to identify and extract the cracks with point cloud data from TLS measurement is proposed through the dilation and Canny edge detector. In summary:
A prerequisite of crack detection is eliminating distinct textures in the image generated from the point cloud data. The dilation method is employed for the purpose. A disk-shaped structuring element is essential due to the approximately equal treatment of element neighbors. The size of the structuring element depends on the average space of gray pixels.
The Canny detector is adopted for crack edge detection, where the detection results depend on important threshold parameters. Three different confidence levels are compared, where the 95% confidence level shows the best detection result. The projection of summed edge pixels is proposed, where vertical cracks present two sharp peaks and the space of the peaks indicates the average width of the crack.
The advantage of the method is that it doesn’t require determination of Canny detector parameters. And the error between the measurement and Canny detection result is approximately 2.92%.
It is recommended that the dilation and Canny edge detector are used for crack detection in similar scenes to tunnel measurement with TLS. Automatic detection of these cracks will contribute to the intelligent inspection of tunnel structures which saves time and labor.
In the future, the reticulated cracks presented as a net and the tilted cracks holding a tilt angle to the central axis of tunnels will be investigated further. This will probably draw our attention to the projection direction determination and peak area segmentation.
Footnotes
Appendix 1
Acknowledgements
The authors would like to acknowledge the support of all the colleagues in Geodetic Institute of Leibniz University Hanover.
Declaration of conflicting interests
The author(s) declared no potential conflicts of interest with respect to the research, authorship, and/or publication of this article.
Funding
The author(s) disclosed receipt of the following financial support for the research, authorship, and/or publication of this article: The publication of this article was funded by the Open Access Fund of the Leibniz Universität Hannover. The authors would like to acknowledge the support of Natural Science Foundation of Jiangsu Province (No: BK20160558).